Abstract
Rao, Vivek Raghunath. Mixed-Initiative Techniques for Assisted Visualization. (Under the direction of Christopher G. Healey)
The advent of computers and their subsequent use in scientific applications, has led to the generation of a large amount of information. This information usually has two characteristics, it is large and it is multi-dimensional. The need for analysis and exploration of this data has led to investigations of methods to visualize the data. The generation of effective visualizations is a hard problem, experiments on the use of the low level human-visual system have led to a set of guidelines which can produce perceptually salient visualizations. However the application of these guidelines to generate good mappings between data attributes and visual features, requires a human to be an expert on visualization.
We have developed a semi-automated visualization assistant (ViA), that uses the percep-tual guidelines and dataset properties to search the space of mappings to generate effective visualizations. However ViA’s knowledge about the perceptual guidelines needs to be aug-mented with the user’s preferences, knowledge about the dataset and the ultimate purpose of the visualization, to generate effectual visualizations.
MIXED-INITIATIVE TECHNIQUES FOR ASSISTED VISUALIZATION
by Vivek R. Rao
A thesis submitted to the Graduate Faculty of North Carolina State University
in partial fulfillment of the requirements for the Degree of
Master of Science
COMPUTER SCIENCE Raleigh, North Carolina
2002 APPROVED BY:
Biography
Acknowledgments
If there is one person who has worked more than me on this thesis, then it is my advisor, Dr. Christopher Healey. I thank him for giving me his precious time and sharing his insight. I thank him for his patience and belief in my abilities. He has treated me as a friend and corrected me on numerous occasions. I owe him much more than this thesis. He has created a stepping stone in my life for which I will be ever grateful to him. Thank you Sir.
I want to thank my parents for giving me an opportunity to extend my horizons. In spite of the distance, I always feel they are close to me. They have supported me throughout my masters and helped me overcome the rough patches as always. Love you mom and dad and thanks for everything.
I want to thank Dr. Robert St. Amant for keeping volleyball alive and providing a welcome break at times. I also thank Dr. John Doyle for meeting with me and discussing the thesis. His comments proved to be very insightful and provided me with a strong focus for my thesis.
Contents
List of Figures vi
List of Tables vii
1 Introduction 1
1.1 Scientific Visualization . . . 2
1.2 Perceptual Visualization and ViA . . . 4
1.3 Mixed-Initiative Interaction . . . 7
1.4 Research Goals . . . 8
1.5 Paper Organization . . . 9
2 Visualization Assistant 10 2.1 Architecture . . . 10
2.2 Evaluation Engines . . . 12
2.3 Search . . . 15
3 Mixed-Initiative Interaction 20 3.1 Overview of Mixed-Initiative Interaction . . . 21
3.2 Theories of Mixed-Initiative Interaction . . . 23
3.2.1 Initiative as Control over Flow of Conversation . . . 23
3.2.2 Initiative as Performing a Task to Solve a Problem . . . 24
3.2.3 Initiative as Control by Presenting a Goal . . . 25
3.2.4 A Process-Based Model of Scaled Initiative . . . 25
3.3 Principles and Issues of Mixed-Initiative Interaction . . . 27
3.4 Uncertainty in Mixed-Initiative Interaction . . . 29
3.5 Evaluating Mixed-Initiative Interaction . . . 31
3.5.1 Evaluating Models of Mixed-Initiative Dialog . . . 31
3.5.2 Datasets for Evaluation . . . 32
4 Example Mixed-Initiative Systems 34 4.1 Lookout . . . 35
4.2 TRAINS95 . . . 36
4.3 Assistant for Intelligent Data Exploration (AIDE) . . . 41
5 Mixed-Initiative Search 47
5.1 Mixed-Initiative Search in ViA . . . 49
5.2 Mixed-Initiative Framework . . . 49
5.3 Application of the Framework . . . 54
5.4 Modeling User Preferences . . . 56
5.4.1 Discretization . . . 58
5.4.2 Importance Weight Modification . . . 58
5.4.3 Task Removal . . . 60
6 Results 61 6.1 Comparison Between ViA-mixed and ViA-none . . . 62
6.2 Comparison Between ViA-mixed and ViA-UI . . . 73
7 Conclusions and Future Work 76
List of Figures
1.1 Minard’s Visualization of Napoleon’s March to and Retreat from Moscow . . . 3
1.2 Visualization Using Perceptual Guidelines . . . 5
2.1 ViA’s Architecture . . . 11
3.1 Bayesian Perspective on Human-Computer Interaction . . . 30
4.1 Lookout: Social Agent Mode . . . 37
4.2 Lookout: Handling Uncertainty . . . 38
4.3 TRAINS95: Map of Rail Connections . . . 39
4.4 TRAINS95: Sample Dialog . . . 40
4.5 Herman . . . 44
5.1 Expected Utility Against Probability . . . 52
5.2 Action, Inaction and the Dialog Utility Lines . . . 53
5.3 User Modeling: Discretization Probability Graph . . . 57
5.4 User Modeling: Importance Weight Probability Graph . . . 59
6.1 ViA-none Visualization . . . 64
6.2 Discretization Questions . . . 67
List of Tables
2.1 Hint Classes and Properties . . . 16
3.1 Evaluation Metrics for Mixed-Initiative Interaction . . . 32
5.1 Utility Table . . . 50
6.1 Attribute Characteristics . . . 62
6.2 ViA-none: Weather Dataset Mappings . . . 63
6.3 ViA-mixed: Weather Dataset Mappings . . . 63
6.4 Hint Chains Disallowed by ViA . . . 69
6.5 Space Explored by ViA . . . 72
6.6 Hints Allowed by ViA-none . . . 73
Chapter 1
Introduction
Rise in computational science, availability of powerful computers with increasing internal and external memory, and large bandwidth networks have greatly increased the ability to collect, create, and store data. Sensors and numerical simulations generate very large amounts of data. Examples of such datasets include sensor data from satellites [Nas], output from hydrodynam-ics simulations [KSS99], and archives of medical images [ABB+98]. For example, a dataset of coarse-grained satellite data (with 4.4 km pixels), covering the whole earth surface and cap-tured over a relatively short period of time (10 days) is about 4.1GB; a finer-grained version (1.1 km per pixel) contains about 65 GB of sensor data [KCF+99]. Converting this huge “data mountain” into useful information is important to all concerned.
scien-tific computing defined scienscien-tific visualization in 1987; “It transforms the symbolic into the geometric, enabling researchers to observe their simulations and computations. Visualization offers a method for seeing the unseen. It enriches the process of scientific discovery and fos-ters profound and unexpected insights. In many fields it is revolutionizing the way scientists do science”. The use of the phrase “I see” in place of “I understand” is common and indicates the synonymity that humans give to understanding and visualizing. Visualizations can reveal correlations, trends, unexpected patterns and support ‘Data Browsing’ [NHM97].
1.1
Scientific Visualization
simula-Figure 1.1: Minard’s visualization of Napoleon’s march to and retreat from Moscow. The brown line is propor-tional to the number of soldiers during the march to Moscow and the black line represents the number during the retreat. The loss of life can be easily seen: out of 422,000 soldiers, only 10,000 returned. Temperature was a contributory factor as shown in the plot at the bottom [Spe01].
tion of Einstein’s equations for the merger of two black holes were generated [ADF+99]. The visualizations allow scientists to ‘see’ their simulations and help in understanding Einstein’s general theory of relativity.
the raw data into images that can be presented to a viewer. Such a mapping is denoted by M = (V,Φ), where V = {V1, ..., Vm} is a set of m visual features Vj selected to represent each attributeAj, andΦj : Aj → Vj denotes the mapping of the domain ofAj to the range of displayable values inVj. Scientific visualization is the generation ofM and the viewer’s inter-pretation of the images generated byM. An effectiveM supports the tasks that users want to perform on their data.
1.2
Perceptual Visualization and ViA
The selection of a mapping to support accurate, rapid and effortless multi-dimensional visu-alization is a hard problem. Solutions have focused on specific application domains. More recently principles from cognitive psychology have been used to guide the selection of an effective mapping [HA99]. Certain visual features can be detected by the low-level human visual system without focused attention. These features include luminance, hue, orientation, size, contrast and direction. When combined properly these features can generate effective visualizations [HSC01]. The use of perception offers the following important advantages:
1. Speed: Perceptual exploration can be performed rapidly by the low-level visual system.
2. Dataset Size: The time needed to perform a task on an image is independent of the number of elements displayed in the image.
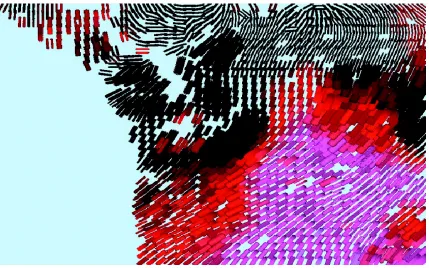
Figure 1.2: Visualization of weather conditions over the west coast of the United States during January; image was generated using the simulated brush stroke method with a data-feature mapping of: temperature→colour,
wind speed→orientation, pressure→coverage, precipitation→size.
of perceptual guidelines. Use of these guidelines can increase the amount of information that we can visualize [HE02]. Figure 1.2 shows a visualization, generated using simulated brush strokes built with the perceptual guidelines; colour represents temperature, density represents pressure, orientation represents wind speed and size represents precipitation. Experiments showed that this visualization supports a large number of tasks effectively [HE02].
more than one mapping that satisfies the rules is time consuming. In other words to be able to apply the guidelines users need to act as “visualization experts”. We have constructed an semi-automated domain independent visualization assistant (ViA) to assist the user with the task of visualization design. ViA casts the goal of generating effective mappings into a search prob-lem. A search engine is combined with a set of evaluation engines, that encode known rules for the use of each visual feature ViA supports. ViA applies an incremental mixed-initiative search strategy. The use of general perceptual guidelines and a domain independent search algorithm allow ViA to be applied to a wide collection of application domains. ViA uses the following as input to guide it’s search:
• A dataset,
• A user specified importance ordering of attributes in the dataset,
• Spatial frequency of each attribute,
• Domain type of each attribute, i.e. whether the attribute is continuous or discrete,
• Exploratory task(s) to be performed on each attribute e.g. search for specific attribute
values, identification of spatial or temporal boundaries, counting or estimation, region tracking in time and space.
generate improved mappings which are re-evaluated in an incremental manner. ViA records the best mappings it finds and displays them to the user when the search terminates.
1.3
Mixed-Initiative Interaction
The evaluation engines produce an evaluation weight for a particular mapping. This evaluation of the mapping is heuristic, since it is based on perceptual guidelines that may not meet the exact dataset characteristics or the preferences of the user. In order to address this uncertainty, ViA needs to incorporate user guidance into the search process. There is a tradeoff however, between allowing for user guidance and negating the advantage of automation by asking the user to make decisions that can be inferred by ViA. Thus the search for effective mappings should be modeled as a problem to be solved through a collaboration of the user and ViA . To this end we have incorporated mixed-initiative interaction into ViA. We expect user guidance to lead to a more rapid generation of better mappings, compared to ViA or the user acting alone.
formulating, collecting, identifying relevant information, and have good spatial and perceptive reasoning. Machines, on the other hand, are better at systematic searches and managing large amount of data and large numbers of constraints [BM98]. Another reason for the interest in mixed-initiative systems is trust. We often do not trust computers fully to automate every task, and thus need to keep a human in the loop. One example of this need is the China Airlines A300 crash at Nagoya airport. Because of reasons unknown, minutes before landing the au-topilot went into a ‘take-off mode’ which resulted in the auau-topilot doing exactly the opposite of what the co-pilot was trying to do [Ols01].
Mixed-initiative systems model problem-solving as a collaborative task, by a synergistic combination of humans and machine intelligence. The challenge is to support effective com-munication between the participants.
1.4
Research Goals
ViA is a semi-automated visualization assistant, that uses perceptual rules encoded in the evalu-ations engines to rate a mapping. This thesis studies how extending ViA to use mixed-initiative techniques improves it’s ability to rapidly generate high-quality visualizations. The mixed-initiative search combines the knowledge of ViA (perceptual rules) with the user’s knowledge of the dataset and it’s context. We attempt to achieve the following goals:
1. Identify broad areas of interaction with ViA.
3. Incorporate dataset properties, user preferences and goals of visualization into ViA’s search process.
4. Study the advantage of using the mixed-initiative interaction framework.
The broad areas of interaction include the specification of attribute properties and relaxing constraints during the search. In order to incorporate the user preferences and goals, we have implemented a version of Horowitz’s mixed-initiative framework, and a model of user prefer-ences. The framework along with the user model allow ViA to make decisions to apply, not apply or ask the user about the use of a hint. Finally we compare the mappings generated by ViA in three modes; non-interactive, interactive, and interactive with mixed-initiative tech-niques. We observe that ViA using mixed-initiative interaction techniques asks a small number of questions, generates perceptually more salient mappings, and explores a smaller part of the search space.
1.5
Paper Organization
Chapter 2
Visualization Assistant
One of the main requirements of any visualization is a method to support rapid, accurate, ef-fortless visual exploration. We are interested in visualizing multi-variate datasets that encode multiple data values at a single spatial location. Randomly assigning visual features to each data attribute may not result in images that are well-suited for visual exploration. Research in multi-dimensional visualization has focused on specific application areas. More general guide-lines for selecting visual features to represent data attributes are not well developed. We address this issue by employing what is known about the control of human attention as a foundation for our visualization tool.
2.1
Architecture
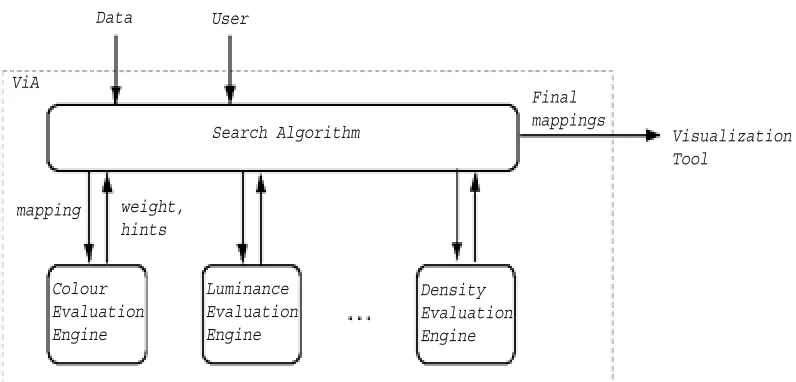
Figure 2.1: ViA’s architecture: ViA consists of two parts, the evaluation engines that rate a mapping and generate suggestions to improve the mapping, and the search algorithm.
problem. Figure 2.1 shows ViA’s architecture. ViA is composed of two main components: the evaluation engines and the search algorithm. The search algorithm is an incremental best first search. It decides the direction of search based on the evaluation of the current mapping by the evaluation engines. The evaluation engines encode a set of visualization rules that are based on the abilities of the low-level human visual system.
only certain types of tasks. Finally, the spatial frequency and the number of discrete values for each attribute are determined by ViA. These also influence the choice of visual feature to represent an attribute.
At the start of the search process ViA passes an initial mapping to the evaluation engines for examination. Each engine returns a weight that represents the perceptual salience of dif-ferent attribute-feature pairs in the mapping. An engine may also suggest ways to improve the mapping. These suggestions are used to generate new mappings. The process continues until a stopping condition is reached. The results of the search are then presented to the user.
A linked list of nodes (one per attribute) communicates mapping information between the search process and the evaluation engines. Each node contains the attribute properties: spatial frequency, domain type (continuous or discrete), exploration task, and the visual feature that is currently being used to represent the attribute. The node also contains a reference to the raw data values in the underlying dataset.
2.2
Evaluation Engines
Each visual feature that is used by ViA has a corresponding evaluation engine. Currently there are evaluation engines for luminance, colour, density, height, regularity and orientation. The data-feature mapping is given to each evaluation engine in turn. The evaluation engine determines the applicability of its visual feature for representing the corresponding attribute in the mapping.
Researchers have identified certain visual features that are detected rapidly and accurately by the low-level visual system, without the need for focused search. These include features such as hue, luminance, size, contrast, and orientation that are often used in visualization.
Experiments on the use of colour suggest the need to consider three criterion when se-lecting multiple colours to represent the values of an attribute: colour distance measured in a perceptually balanced colour model (e.g. CIE LUV or the OSA uniform colour space), the ability to separate colours from one another with a straight line (linear separation), and the named colour regions that the colour occupies (colour category). Experiments show that up to seven isoluminant colours can be displayed simultaneously and still support rapid, accurate exploration [Hea96].
Experiments on the use of the texture dimensions: density, regularity and height, led to the following conclusions: taller elements can be rapidly detected in all situations; shorter, denser, and sparser targets can also be quickly identified, but variation of a secondary, background texture dimension produces a reduction in performance due to visual interference (i.e. variation in the background texture dimension “mask” variations in the target dimension) [HE98].
Experiments on the combined use of texture and colour suggest that colour targets are detected rapidly, without any interference from variations of height or density [HE99]. With a constant background colour, detection of targets defined by height and density was good. Random variations in colour interfered with texture identification. More recent experiments with orientation indicate that up to 12 different orientations can be differentiated [HBE93]. The results of these experiments are encoded as perceptual rules in the evaluation engines.
feature (Fi) to represent the attribute (Ai) in the mapping:
1. Interference: Does some less important attributeAj use a more salient visual featureFj?
2. Domain type: DoesFi support the domain type ofAj?
3. Spatial frequency: CanFi represent the spatial frequency ofAj?
4. Task applicability: CanFisupport the task(s) that the user wants to perform onAj?
Results from these tests are used by an engine to assign a value between zero (a totally flawed attribute-feature mapping) and one (a perfect attribute-feature mapping) to the mapping. The weights are averaged to produce an overall evaluation for the entire mapping. Whenever possi-ble the engines also generate hints that suggest ways to improve the mapping. Hints describe a single suggested modification to the mapping. Hints also include an improvement weight, the expected increase in evaluation weight if the hint is adopted. The evaluation engines produce four categories of hints:
1. Discretization: Suggests discretizing a continuous attribute (or ranging a discrete at-tribute into a smaller number of unique values). This hint is generated when a feature is unable to support a continuous attribute (or the current number of discrete values).
3. Importance weight modify: Suggests that the importance weight of two attributes be made equal so that a more salient visual feature is not used to represent a less important attribute. This helps to prevent visual interference.
4. Task remove: Suggests to remove a task attached to a low-importance attribute when the feature does not support the task.
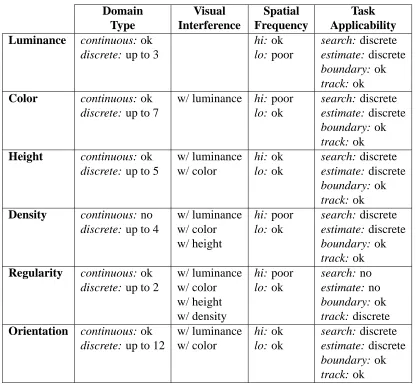
Table 2.1 summarizes the tests that are performed by the evaluation engines to determine prob-lems of using their feature to represent an attribute. The table also describes the attribute characteristics that are supported by each visual feature.
Hints generated by the evaluation engines are used by the search algorithm to direct the search towards better mappings. The average of the weights returned by the evaluation engines (the mapping weight) is used to compare mappings. The search algorithm selects appropriate hints from those generated by the evaluation engines to generate new mappings. Since the hints are based on the perceptual rules used by the evaluation engines, we expect the resulting mappings to be better.
2.3
Search
Table 2.1: Hint tests performed on visual features, showing the attribute characteristics supported by the different features (luminance, color, height, density, regularity, and orientation): “ok” for a good match, “poor” for a weak match, and “no” for an unallowed match.
Domain Visual Spatial Task
Type Interference Frequency Applicability
Luminance continuous: ok hi: ok search: discrete
discrete: up to 3 lo: poor estimate: discrete
boundary: ok track: ok
Color continuous: ok w/ luminance hi: poor search: discrete
discrete: up to 7 lo: ok estimate: discrete
boundary: ok track: ok
Height continuous: ok w/ luminance hi: ok search: discrete
discrete: up to 5 w/ color lo: ok estimate: discrete boundary: ok track: ok
Density continuous: no w/ luminance hi: poor search: discrete
discrete: up to 4 w/ color lo: ok estimate: discrete
w/ height boundary: ok
track: ok
Regularity continuous: ok w/ luminance hi: poor search: no
discrete: up to 2 w/ color lo: ok estimate: no
w/ height boundary: ok
w/ density track: discrete
Orientation continuous: ok w/ luminance hi: ok search: discrete discrete: up to 12 w/ color lo: ok estimate: discrete
the size is exponential in the number of visual features. Research on new features such as animation and flicker will lead to larger F and therefore significantly larger search spaces. Search space size is also dependent on the initial user constraints and the dataset properties. If there is a change in either of these, then the evaluation engines may produce a different weight for a given mapping. Any mapping that use features that are affected by the change will now have two points in the search space. This modification of constraints (e.g. during “what if” analyses) can rapidly expand the size of the search space, making an exhaustive search infeasible in many situations.
ViA uses human perceptual guidelines encoded in the evaluation engines to avoid perform-ing a brute force search. Hints produced by the evaluation engines are used as operators to suggest an appropriate move from one point in the search space to another. ViA’s goal is to find the mappings with the largest evaluation weights. ViA pursues this goal as follows:
1. Choose a “good” initial mappingM by assigning the most salient visual features to the most important attributes.
2. SendM to the evaluation engines. The evaluation engines return the weight of the map-ping and hints to improve the mapmap-ping.
3. IfM has a higher evaluation weight than the best mappings to date, includeM in the list of mappings to be displayed to the user.
5. Determine the expected improvement weight for each hint chain. The expected im-provement weight is equal to the largest expected imim-provement for any individual hint weighted by the length of the chain. (longer chains are favored over shorter ones.)
6. Place the hint chains onto a priority queueP Q.
7. IfP Qis empty then stop the search and report the results, otherwise remove the chain with the highest weight fromP Qand apply it toM to generate a new mappingMN.
8. Repeat the process from step 2 withMN.
Since hints are generated based on the perceptual rules, changes to a mapping (or to the dataset or user properties associated with that mapping) should lead to visualizations with a higher evaluation weight. However, applying hints may result in an unacceptable loss of detail. For example, suppose ViA uses regularity to represent an attributeAi with twelve unique values. The regularity engine will penalize this mapping and suggest discretizingAi to two values. If this discretization is allowed then the weight of the mapping will increase, but we may lose the ability to differentiate among elements with different values ofAi. (i.e. elements with different values of Ai will fall in the same discretized range and will therefore be displayed with an identical regularity.) ViA handles this by using fixed constraints that disallow the application of any hints that causes a significant decrease in attribute detail. For example, the discretization hint is allowed only when the number of discrete values suggested are more than half of the number of unique values in the original attribute.
Chapter 3
Mixed-Initiative Interaction
3.1
Overview of Mixed-Initiative Interaction
Research in user interface innovation has taken two directions. One is improvements in intelli-gent aintelli-gents which determine user intention and goals and perform actions based on this evalua-tion. The other is improvements in interfaces for direct manipulation by the users. Rather than advocating one approach over the other, an innovative approach is to integrate the two means of user interaction and provide a best of both worlds solution. This offers a greater flexibility by providing fully automated action, and user controlled direct manipulation, together with a range of intermediate possibilities. This intertwining of automated services and user control is called mixed-initiative interaction [ACH99].
Mixed-initiative interaction lets participants cooperate to perform a task by contributing their unique strengths towards the completion of the task [PAR99]. Mixed-initiative interaction can be better understood by considering the duality between artificial intelligence (AI) and HCI.
AI aims to model human beliefs and the human thought process in order to create a system that can make intelligent decisions. HCI, on the other hand, aims to improve computer inter-faces to aid the human in making intelligent decisions. The boundary between these two fields encompasses mixed-initiative interaction [ACH99].
or impossible to fully automate a task and replace the human [FAM96]. Humans are better at formulating and planning tasks, collecting and evaluating the relevant information, supplying estimates for uncertain factors, and various forms of visual and spatial reasoning. Machines are better at conducting systematic searches, and managing and communicating large amount of data [BM98]. Based on these observations a productive synthesis of the complementary strengths of both humans and computers will help solve problems precisely and rapidly.
Mixed initiative interaction can take place at various levels. The different levels of mixed-initiative interaction, as stated by James Allen, are:
1. Unsolicited reporting: The system provides its own evaluation of the plan under devel-opment.
2. Sub-dialog initiation: The system initiates a sub-dialog with the user for clarification of facts.
3. Fixed sub-task initiative: Each agent knows in advance the sub-parts that it is responsible for. The appropriate agent controls or initiates the interaction associated with that sub-part.
4. Negotiated mixed-initiative: This final level of mixed-initiative take place when the par-ticipants decide which parts of the problem each will solve as part of the interaction.
mixed-initiative interaction is a natural and efficient combining of users and automated agents aimed at providing solutions to problems [Hor99a].
3.2
Theories of Mixed-Initiative Interaction
There is no consensus in the field of mixed-initiative interaction about the meaning of the term initiative. The following theories explain the term initiative as used in the design of mixed-initiative systems [CAC+98].
3.2.1
Initiative as Control over Flow of Conversation
This theory defines flow as the movement of conversation through a subject or series of sub-jects. According to the theory a participant will interrupt and pass initiative, either due to information quality or due to plan quality.
The reasons for interruptions based on information quality are as follows:
1. The listener wants to add additional information that he thinks the speaker does not know or does not believe.
2. The listener wants to clarify an assertion by the speaker.
The reasons for interruptions based on plan quality are as follows:
1. The listener thinks that the assertion by the speaker will not work, or that it has already been satisfied.
The theory equates initiative with control. In order for a system to be classified as a mixed-initiative system, all participants must be able to control the flow of the conversation. Intelligent tutoring systems fall into this category. However, it should be noted that in many task oriented applications the system will have initiative all the time and will not be classified as a mixed-initiative system by this theory.
3.2.2
Initiative as Performing a Task to Solve a Problem
This theory defines initiative as the power or ability to perform or suggest a plan that is im-portant for solving the problem at hand. In this theory, dialog participants who elicit infor-mation or delegate tasks take the initiative. The participant who initiates a direction to the problem-solving process has the initiative and retains it, until the proposal is rejected or no clear direction is present.
The circumstances in which the initiative will shift are as follows:
1. The initiative taker can no longer proceed in attempting to solve the problem.
2. Another participant detects invalidity and proposes a correction.
3. An alternative is suggested.
3.2.3
Initiative as Control by Presenting a Goal
This theory models both the control of conversation and the control of task. It contrasts with the previous theories in which only the dialog initiative or the task initiative is modeled. A shift in initiative takes place when a participant presents a new sub-problem to solve. Actually solving the sub-problem in response to a dialog is not considered as taking the initiative. Initiative is defined as a conversation which occurs at an instant in time when a person seizes control of the conversation by presenting a domain goal for the participants to achieve. This theory models interactive conversation, since it requires the creation of goals and thus implies the inability of a single participant to solve the problem completely.
3.2.4
A Process-Based Model of Scaled Initiative
This theory defines two concepts. One is a process. The other is strength of initiative. A process is goal oriented and defined as a sequence of turns. A turn is composed of utterances. The initiator of a process has the initiative, i.e., the person who takes the first turn in the process has the initiative. The theory also establishes the concept of strength of initiative, which allows it to represent how strongly a participant is in control of a conversation when he/she has the initiative. The theory models initiative in view of the entire conversation and not from the perspective of an individual participant. It can be used to describe tutoring and collaborative planning systems.
below is part of an interaction with ViA during the search for good mappings. The attribute wind speed has 500 discrete values, ViA asks the user if he will allow discretization of wind speed to 7 values. ViA also provides an option of specifying a different number of discrete values. For example, the user can allow discretization of up to 9 discrete values. This option provides a mechanism for the user to take initiative in the search.
1. User: Please generate a visualization of the dataset.
2. ViA : Can I discretize wind speed from 500 to 7 discrete values? (ViA has initiative)
3. User: No, But you can discretize into 9 values. (User has taken initiative)
4. ViA : Ok. (Implicit)
5. ViA : Do you want to remove task Search on attribute temperature? (ViA has initiative again)
3.3
Principles and Issues of Mixed-Initiative Interaction
Design of mixed-initiative systems requires the consideration of principles that are specific to mixed-initiative interaction. These principles are a general guideline to be followed when designing mixed-initiative systems.
1. Provide significant automation: The service provided by the system should be a valuable addition to the user’s task. The automation should be significantly more valuable than what can be accomplished by direct manipulation [Hor99a].
2. Provide some form of shared representation: To attain collaboration, there should be a representation of the plan, goals, and the constraints that are shared among the partici-pants [BM98].
3. Consider uncertainty about the user goals: The system must employ techniques to handle uncertainties about the user goals [Hor99a].
4. Use costs, benefits, and uncertainties to infer ideal action: There are a number of costs associated with taking actions under uncertainty. The system should take into consid-eration these costs and benefits and use the expected value of a certain action to decide whether to execute it.
5. Employ dialog to overcome uncertainties: If the system is uncertain about the user’s goals and preferences then it should ask the user for clarification [Hor99a].
7. Provide mechanisms for refining results: Mixed-initiative systems should allow the user to review the results of the problem-solving and provide means to refine them [BM98].
Mixed-initiative systems should consider a key set of issues in their effort to support joint problem-solving. These issues are related to the principles of mixed-initiative interaction [Hor99b].
• When to engage the user with a service: The aim of mixed-initiative systems is to provide
service to users when they most need it. If the user is provided the service when he does not need it or his goal is something else, there is a large disadvantage in providing the service. The timely provision of service can be guaranteed by a cost benefit analysis to determine the advantage of providing the service.
• How best to contribute to solving a problem: The design of mixed-initiative systems
should consider the general scope of each participant’s roles. It is likely that users will want to maintain overall control of setting objectives and constraints and allow the sys-tem to control some of the more mundane tasks [BM98].
• When to pass control to the user for guidance: The user should be given control in
accordance with one of the theories of initiative that the system design is based on.
• When to query a user for additional information: Questioning the user when he is doing
• How to deal with uncertainty: Uncertainty is inherent in mixed-initiative systems. There
is uncertainty in one’s information, in one’s ability to estimate the outcome of actions, and in others goals and actions. The use of decision theory and reasoning along with the use of maximum expected utility is one method of handling uncertainty. All the other issues should be handled even when there are significant uncertainties about the user goals and intentions [Hor99a].
• How to control communication overhead: Mixed-initiative systems should allow users
some mechanism to convey the communication bandwidth, for example the number of dialogs exchanged. The communication bandwidth refers to the volume of communica-tion between the user and the system.
• Support for refinement after the solution has been reached: The system should also
sup-port mechanisms for refinement of the solution once it has been reached. One extreme view is to consider all mixed-initiative problem-solving as refinement [FAM96].
The consideration of the principles and effective solution to the issues of mixed-initiative in-teraction will lead to systems that are easier to interact with and which can act as collaborators in solving a problem.
3.4
Uncertainty in Mixed-Initiative Interaction
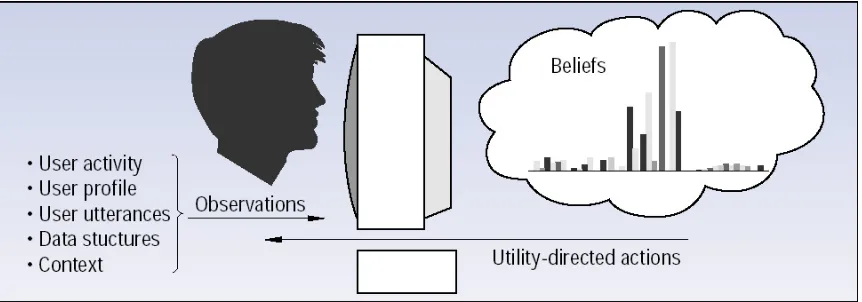
Figure 3.1: A probability distribution generated by the lumiere system, displaying the likelihood of a user’s different goals while working with Microsoft Excel; the distribution is based on background information and a set of observations.
goals and needs are resolved by mutual understanding, a process referred to as grounding. Systems that provide automated services rely on the ability to make good guesses about the users intentions based upon the interaction history with the user. Given this, these systems have to deal with a considerable amount of uncertainty. The Bayesian approach to human-computer interaction provides a direction for mixed-initiative system design. A Bayesian agent maintains information about the user’s intention and goals and updates the beliefs based on probabilistic methods [Hor99b]. Figure 3.1 shows the user interaction events and background information that Lumiere’s Bayesian model analyses to infer probability distributions over user interests [HBH+98].
of the user’s beliefs and intended goals with the expected utility of action or inaction can be a valuable component of a mixed-initiative system [Hor99b].
3.5
Evaluating Mixed-Initiative Interaction
Evaluation of mixed-initiative interaction can be done in order to determine the amount of value that the system adds to the process of solving a problem. Evaluation can also determine problems with the system and suggest possible directions of improvement. There are two considerations when evaluating mixed-initiative systems [ACH99]:
• What metrics are used?
• What is the nature of that dataset that is used for evaluation?
3.5.1
Evaluating Models of Mixed-Initiative Dialog
Two approaches to evaluate the goodness of a model are the descriptive approach and the prescriptive approach.
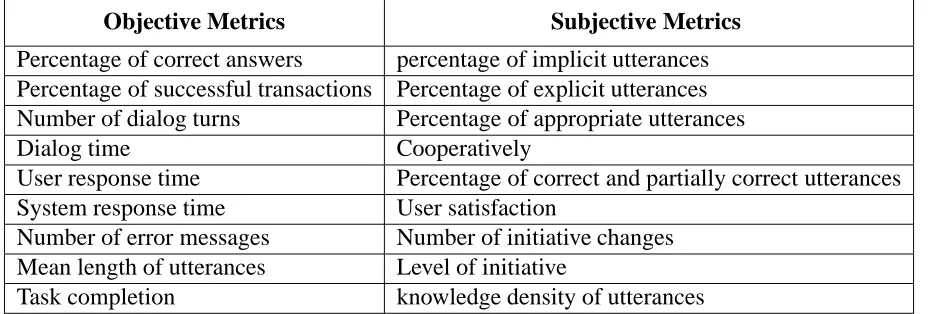
Table 3.1: Objective and subjective metrics for evaluating mixed-initiative systems.
Objective Metrics Subjective Metrics
Percentage of correct answers percentage of implicit utterances Percentage of successful transactions Percentage of explicit utterances Number of dialog turns Percentage of appropriate utterances
Dialog time Cooperatively
User response time Percentage of correct and partially correct utterances System response time User satisfaction
Number of error messages Number of initiative changes Mean length of utterances Level of initiative
Task completion knowledge density of utterances
Prescriptive dialog models study the effectiveness of computational agents carrying out a particular dialog theory. This approach focuses on a number of objective and subjective performance metrics as summarized in Table 3.1 [WLKA98].
3.5.2
Datasets for Evaluation
Three types of datasets have been used to evaluate models of dialog. These are datasets in-volving human, computer and computer-computer dialogs. Gathering human-human dialogs is a significant challenge, because there are a number of factors that affect the validity of the dataset. The data should be collected in a natural setting without any intrusion. Communication may include gestures and intonation, which should also be captured. For this reason, the corpus of human-human interaction data is limited.
development of the system is time consuming, and the system should be able to communicate in multiple media.
It is theoretically possible to conduct experiments, involving computer-computer dialogs in which two computers communicate using the dialog interface. These experiments offer researchers several benefits. First, these experiments lead to large datasets. Second, the in-teraction communicated entirely in terms of text does not require complex speech processing engines. Third observation of computer-computer interaction may provide information about the underlying model and whether the model can support observed human or human-computer dialogs [ACH99].
Chapter 4
Example Mixed-Initiative Systems
aims to imitate human-human tutorial dialogue [LSS99].
4.1
Lookout
Lookout developed by Horowitz et. al. is an extension to Microsoft Outlook, a direct manip-ulation messaging and scheduling system. Lookout identifies new messages and attempts to assist users with reviewing their calendar and composing appointments. Lookout parses the text in the body of a message and determines if the message is attempting to schedule an ap-pointment. It then tries to determine the time and date associated with the event in the message. The system then brings up the user’s appointment book and fills in the relevant fields of the ap-pointment. It displays its guesses to the user and allows the user to make any desired changes. If Lookout cannot identify the exact date and time of the event, the system degrades its goal to identifying the general span of time implied by the message and displays the relevant view of the calendar. Lookout reduces the number of interactions and the complexity of the navigation required by the user to read a message and annotate his/her schedule. The system works auto-matically when the user is reading a message. It then determines the probability that service is required. Based on this probability and on the assessment of the costs and benefits it decides to do either of the following:
1. Do nothing.
2. Engage the user in a dialog.
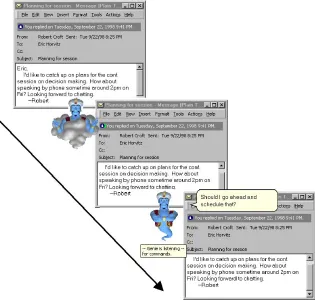
Lookout has various modes of operation. It can be made to operate in a manual mode or in one of the several automated modes. In manual mode Lookout will take action only when explicitly invoked by the user. When activated, Lookout analyses the message that has the system focus. In the basic automated mode Lookout opens the appointment book, and displays dialogs to request additional information when appropriate. Lookout can also be operated in the social agent mode. In this mode Lookout has an explicit screen presence in the form of an animated character drawn from the MS social agent package. Lookout monitors the audio channel for user interactions. In this mode if Lookout is confident about the assessment of the user’s goals the character informs the user that it has readied an appointment before displaying the results. At lower levels of confidence Lookout inquires about the user’s interest in seeing the calendar or in scheduling an appointment. Figure 4.1 shows a series of screens demonstrating Lookout’s operation in the social agent mode.
Figure 4.2 shows how Lookout handles uncertainty in user goals by degrading its perfor-mance by opening the calendar to its best guess. Thus, rather than making a poor guess, Look-out brings up the appropriate week on the user’s calendar. In summary the LookLook-out system presents a framework for employing mixed-initiative interaction under uncertainty.
4.2
TRAINS95
Figure 4.1: Social Agent mode of operation of Lookout
particular problem at hand) and large and complex plans. Automated systems can handle scale better than human planners; however, the vagueness of the initial conditions and the intuitive nature of decisions in planning make them hard to apply. Ferguson et. al. view mixed-initiative planning as different from traditional planning for two reasons:
1. The goals are not well defined; they cannot be stated clearly at the beginning and they may change.
Figure 4.2: Degradation of service in Lookout based on uncertainty
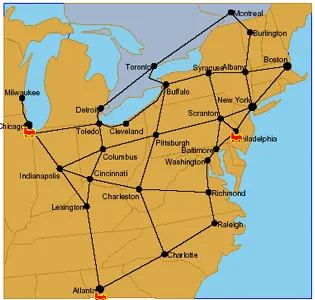
Ferguson et. al. consider the domain of transportation planning. The manager is presented with a map displaying cities and rail connections between them as shown in Figure 4.3. Envi-ronmental conditions such as weather and traffic are generated by the system asynchronously. The system generates random problems that require route planning.
Since it is conceivable to build a planner that will be able to generate perfect plans in this environment, the authors weakened the planner in the system to simulate a more complex domain. The authors further claim that even the presence of a perfect planner will not reduce the need for mixed-initiative interaction because of the inherent uncertainties in goals and initial information.
Figure 4.3: Map displaying cities and rail connections between them presented to the user
TRAINS95 is shown in the Figure 4.2. The system supports speech, graphics, and text input and output. It is robust in that it can dynamically adjust to environmental factors. It is modular, with modules communicating via a messaging system. The authors model of mixed-initiative interaction consists of the following steps:
1. Identify the goals and subgoals.
2. Identify the constraints.
1. M: I need to get to Detroit, Syracuse, and Montr´eal.
2. S: Ok. [highlights the tree cities]
3. M: Let’s send the trains from Chicago to Detroit.
4. S: Ok. [draws route from Chicago to Detroit via Toledo] But the terminal at Toledo is delaying traffic due to bad weather. Trains will take an additional five hours to move through there. [highlight Toledo in red]
5. M: That’s ok. Now let’s go from Atlanta up to Syracuse.
6. S: Please tell me a route to use to get from Atlanta to Syracuse. [highlight engine at Atlanta and city Syra-cuse]
7. M: Go via Charleston and Pittsburgh.
8. S: Ok. [draws route via Cincinnati] But traffic through Cincinnati is being delayed due to construction.
9. M: Ok, let’s go via Charleston and Buffalo instead.
10. S: No problem. [draws route]
11. M: That’s great.
12. S: I hope it was helpful.
13. M: Finally, I want to go to Montr´eal from Philadelphia.
14. S: Ok. [draws route]
15. M: That’s great. I’m done.
Figure 4.4: Sample dialog from the TRAINS95 mixed-initiative system.
4. If the solution is criticized then repeat the process from step 2.
4.3
Assistant for Intelligent Data Exploration (AIDE)
AIDE, developed by St. Amant et. al., is a mixed-initiative system for supporting exploratory data analysis. It is based on the observation that in exploratory data analysis strategy is as im-portant as specific statistical operators. Many attempts at automated statistical reasoning agents have been unsatisfactory, because the main question asked in designing these systems is,“What parts of statistical software can be automated?” A more effective question according to St. Amant et. al. is, “How can human reasoning be enhanced or complemented by automation?”
AIDE treats exploratory data analysis as a problem in planning. It has a library of about 100 plans mostly for analysis of univariate and bivariate relations. AIDE supports three higher order operators: reduction, transformation, and decomposition, as well as the standard statistical operators. These allow AIDE to construct higher level plans to analyze the data.
The use of plans reduces the search space, as compared to the size of the space when only the primitive operators are considered. There are a number of issues that need to be handled however, Which plan should be applied? What data should be examined? When should the choice of plan be reconsidered? Which data should be bound to the variables of the plan? To solve these problems AIDE uses three mechanisms:
1. Activation rules: determine which plans are active and applicable.
2. Focus points: maintain the different courses of action and also evaluate the plans.
Rules determine which plans become active at any point in planning. The focus point deter-mines the specific plan to pursue. The shift of the plan focus from one focus point to another is controlled by the meta planner. When a dataset is presented to the system, a goal is established for its exploration. The planner then searches its library to locate an applicable plan. Sub-goals are identified based on the chosen plan. The planner uses control rules to determine the variable bindings. These decisions form focus points similar to the focus points for plans. As planning progresses the planner can backtrack to a focus point and make a different selection for variable bindings. Thus, planning is presented as constructing and navigating through a focus point network.
4.4
Herman the Bug
Herman is a lifelike pedagogical agent, for the DESIGN-A-PLANT learning environment, de-veloped for the domain of botanical anatomy and physiology for middle school students (Fig-ure 4.5). The goal of DESIGN-A-PLANT’s learner is to design a plant that will thrive in a given natural environment. To facilitate mixed-initiative problem-solving, lifelike pedagogical agents must have access to a good model of the problem-solving context. For Herman this context consists of an environmental description, a multi-modal advisory history, and a task model. The environmental description contains specifications for sunlight, the amount of nu-trients, and the height of the water table. The multi-modal advisory history contains a temporal sequence of advisory entries, which are updated as the agent provides advice. Each entry con-tains the topic of advice, the frequency with which the agent has advised the learner about the particular topic, and a record of the media that was used to communicate the advice. The task model provides the agent with an updated representation of the tasks performed by the user during the problem-solving activity.
A desirable feature of interaction is that the learners should be able to take control when they are performing the problem-solving actions, and the agent should be able to take control when it appears that the learner is having difficulty with a concept or when the learner asks a question. The following are the initiative transfers in a learning session:
Figure 4.5: Herman the bug looks at the plant that a user is designing in the DESIGN-A-PLANT environment.
2. Episode introduction: The agent takes initiative by introducing the particular episode.
3. Problem-solving: Herman relinquishes control while the learner solves the problem. At this time the agent may perform some visual actions that increase believability, such as toe tapping or standing up and lying down.
4. Advisory initiative: At any time the learner may perform an action or seek assistance. When the agent determines that assistance should be provided he becomes visually more active and provides assistance.
5. Taking problem-solving initiative: If after repeated explanations to the learner, the learner cannot perform the task, the agent takes the initiative to explicitly solve the problem.
Intervention by Herman during the problem-solving phase takes place when the learner makes an incorrect design decision or when the problem-solving idle time exceeds a threshold. When Herman intervenes, the components that are incorrect and the component having focus deter-mine the type of advice to be provided. There are four levels of abstraction at which Herman provides advice:
1. Direct action: Herman directly performs the action.
2. Direct verbal: Herman provides advice that is directly applicable.
3. Abstract animated: The advice is abstract, but accompanied by animated gestures.
4. Abstract verbal: Herman provides abstract advice and requires the learner to operational-ize it.
Herman can also present explanations of fundamental knowledge about the domain. By pro-viding explanations of domain phenomena that are relevant to the problem-solving activity, Herman can broaden the learner’s knowledge. The explanations, however, should be provided in context and should be temporally distributed over the problem-solving episode. To achieve this Herman determines the subset of the animated segments that are relevant. Herman tracks the sequences that are selected and shown.
Chapter 5
Mixed-Initiative Search
The goal of search is to find a sequence of operators that lead from the start state to the goal state. Operators are a set of valid actions that a search agent can take at any point in the search space. In ViA the search space consists of all possible data-feature mappings. Hints generated by the evaluation engines are the operators that ViA uses to explore the search space. Each evaluation engine may suggest a number of hints to improve the current mapping. Thus, at each point in the search space a number of hints may be applicable. In the absence of mixed-initiative interaction ViA applies these hints without consulting the user. Such a solution ignores the user’s ability to apply domain knowledge and an understanding of the problem context to aid in making decisions, however.
communicating with the user. User guidance may also reduce the number of mappings that have to be evaluated. If the user disallows certain hints, large parts of the search space can be ignored. The user can also provide access to parts of the search space that were previously in-accessible by allowing hints that would not normally be applied by ViA. Moreover, mappings in these areas are likely to have high evaluation weights since the user relaxed their constraints specifically to consider these mappings. In all of these situations the involvement of the user is necessary and important for rapidly producing better mappings.
A first step for including the user into the search process is to ask the user if certain hints should be performed. This step makes the search sensitive to the user’s preferences, and re-duces or eliminates the necessity for fixed constraints. Asking the user to decide about the application of every hint, however, burdens the user with an overwhelming large number of questions. The example interaction below illustrates this problem.
1. ViA : Can I discretize wind speed from 100 to 7 unique values?
2. User: No, but I will allow 8 discrete values.
3. ViA : Can I discretize wind speed from 100 to 6 unique values?
5.1
Mixed-Initiative Search in ViA
The basic search process described in Section 2.3 was modified to incorporate the mixed-initiative framework. ViA prunes the hint chains by removing chains that contain hints that the mixed-initiative framework disallows. After generating the initial set of hint chains ViA proceeds by the following algorithm:
Algorithm 5.1.1: MODIFIED SEARCH(HintChains)
for eachHC ∈ CHAIN S
do
useHC ←true
for eachH∈ HC
do
Determine whether or not to apply H or ask the user, based on the mixed−initiative f ramework.
ifNot apply H then
(
useHC ←f alse
ifUseHC =f alse then
(
discard HC.
5.2
Mixed-Initiative Framework
Table 5.1: The four outcomes and their associated utilities.
Desired Goal Not Desired Action u(A, G) u(A,¬G)
No Action u(¬A, G) u(¬A,¬G)
Intelligent agents that autonomously solve problems need a mechanism to decide whether or not to provide service. The advantage of taking an action depends on whether the user wants the outcome of the action. The benefit of each outcome is mapped to a utility factor that ranges from zero to one (with one being the best outcome). Four utility values are calculated for each decision about action or inaction (Figure 5.1):
• u(A, G)is the utility of taking actionAwhen the user’s goal isG.
• u(A,¬G)is the utility of taking actionAwhen the user’s goal is notG.
• u(¬A, G)is the utility of not taking actionAwhen the user’s goal isG
• u(¬A,¬G)is the utility of not taking the actionAwhen the user’s goal is notG.
Letp(G|E)be the conditional probability that the user’s goal isGwhen the set of eventsEare observed. This term models the extent to which the system believes that the user’s goal is G based on its previous interactions with the user. The expected utility of taking actionAbased on the observed events is then:
Equation 5.1 can be restated in terms ofp(G|E)as:
eu(A|E) =p(G|E)×u(A, G) + [1−p(G|E)]×u(A,¬G) (5.2)
Similarly the expected utility of not taking the action is given as:
eu(¬A|E) =p(G|E)×u(¬A, G) + [1−p(G|E)]×u(¬A,¬G) (5.3)
Figure 5.1 graphs Equations 5.2 and 5.3 as action and no action lines. The horizontal axis represents probability (p(G|E)) and the vertical axis represents the utility of action or inaction. The two outcomes on the left of the graph are associated with p(G|E) = 0, i.e., the system believes that the user’s goal is notG. The outcomes on the right are associated withp(G|E) =
1, indicating total system confidence that the user’s goal isG.
The action and the no action lines cross at probabilityp∗. At this point the expected utility of action and inaction are identical. The best decision to make for any given value ofp(G|E), is the option that maximizes expected utility. Forp(G|E)< p∗the no action line has a higher expected utility, so the system should not apply the action. Alternatively, ifp(G|E)≥ p∗the system should apply the action.
Next, the option of asking the user is added to the framework. Two additional utilities are now needed:
• u(D, G)the utility of engaging the user in dialog when the users goal isG.
Figure 5.1: Expected utility of action versus inaction, yielding a threshold probability for action.
u(D,¬G)> u(A,¬G)because we assume it is always better to ask rather than automatically applying an action the user does not want. Conversely,u(D,¬G) < u(¬A,¬G)since user’s prefer that the system automatically ignore an action they do not want, rather than asking about it. Similarlyu(A, G) > u(D, G) > u(¬A, G). The expected utility of engaging the user in dialog is given by:
eu(D|E) = p(G|E)×u(D, G) + [1−p(G|E)]×u(D,¬G) (5.4)
Figure 5.2: Figure shows the inaction, action and the dialog utility lines and their intersections. Based on the value of the intersections and the value ofp(G|E)a decision of taking autonomous action or asking the user is made.
p(G|E) < p∗¬A,D. Whenp(G|E) > p∗D,A then action is taken without consulting the user. Finally a dialog is generated whenp∗¬A,D ≤p(G|E)≤p∗D,A.
5.3
Application of the Framework
Application of the framework to ViA, requires mapping concepts from ViA’s search process to the parameters of the framework as follows:
1. G: represents the user’s desire to apply hints generated by the evaluation engines.
2. A: represents the application of a hint.
3. E: the interaction history with the user.
Before describing the values of the utility factors, the following terms need to be defined:
1. Evaluation weight: A measure of the perceptual salience of a mapping.
2. Conservative factor: A user defined value between 0 and 1 that controls the amount of interactivity. A value of 1 indicates that the user is very conservative and wants to review all decisions made by ViA.
3. Expected improvement: The expected increase in evaluation weight from applying a particular hint chain.
The values of the utility factors in our implementation of the framework are:
• u(A, G) =evaluation weight + expected improvement
• u(¬A, G) =evaluation weight−expected improvement
The utility of not applying a hint when the user wants it applied is the current weight of the mapping minus the expected improvement (i.e. the anticipated loss from not applying a desired hint that can improve the current mapping it applied).
• u(A,¬G) = 0
An expected utility of zero is used to penalize applying a hint when the user does not want it applied. Ideally, we would penalize the utility relative to “how undesireable” application of the hint was for the user. However, ViA has no way of computing this relative value. Therefore, we default to a significant penalty for any unwanted hint.
• u(¬A,¬G) =evaluation weight
The utility of not applying a hint when the user does not want it applied, is the current evaluation weight of the mapping. There is neither an advantage or disadvantage in this case.
• u(D, G) = evaluation weight + (conservative factor×attribute importance weight ×
expected improvement)
The utility of invoking a dialog when the user wants a hint applied depends on the con-servative factor, the importance weight of the attribute being modified by the hint , and the expected improvement. As the conservative factor varies from 0 to 1, the utility of showing the dialog ranges from evaluation weight to evaluation weight×attribute im-portance weight×expected improvement. Thus, there is a higher utility in showing the
utility of asking about a hint. ViA is more likely to ask about decisions that involve attributes that are important to the user.
• u(D,¬G) =conservative factor×attribute importance weight×evaluation weight
The expected utility of invoking a dialog when the user does not want a hint applied is also based on the conservative factor and the importance weight of the attribute. As before a higher conservative factor or importance weight makes a dialog more likely.
These utilities are used to calculate the values ofp∗¬A,Dandp∗D,Afor each hint in a hint chain (Figure 5.2). Oncep∗¬A,Dandp∗D,Aare determined, the framework uses the value ofp(G|E) to decide how to proceed. The next section describes how the value ofp(G|E)is maintained.
5.4
Modeling User Preferences
(a)
(b)
5.4.1
Discretization
The probability graph for discretization hints is shown in Figure 5.3a. The graph represents the probability of the user allowing the hint on the y-axis and the number of discrete values of the attribute on the x-axis. The graph indicates that the user will allow zero discrete values with zero probability and will allow discretization into the maximum number of values that can be effectively represented by the visual features used by ViA with probability one. The answers that the user gives about questions related to discretization lead to changes in the graph. As an illustration, suppose that the user allows seven discrete values and disallows five values. The graph will change as shown in Figure 5.3b. This new graph implies that the user will allow all discretizations of the attribute with seven or more values, but will disallow all discreitzations with five or fewer values.
5.4.2
Importance Weight Modification
(a)
(b)
5.4.3
Task Removal
Graphs for task removal hints are modeled as a single number. The task removal probability is initially fixed at 0.5, meaning the user is equally likely to allow or disallow a task removal. If the user allows the task removal, then the probability is updated to one. If the user disallows the task removal then the probability is set to zero.
The probability graphs are stored as equations in ViA. They are updated following each user interaction. In this way ViA tries to maximize the information that can be gained from an interaction.
Chapter 6
Results
In order to study the effects of a mixed-initiative strategy in ViA, we applied it to a real world weather dataset representing average monthly weather conditions in 12◦ latitude and longitude steps across the continental United States. The averages were provided by the Intergovern-mental Panel on Climate Change (IPCC) using historical weather conditions for the years 1961 to 1990. The dataset contains eleven separate data attributes: temperature, wind speed,
pres-sure, precipitation, cloud cover, diurnal temperature range, ground-frost frequency, maximum
temperature, minimum temperature, radiation, vapor pressure, and wet day frequency. The
weather dataset was used because it is complete and free of known errors and in part because most viewers can readily comprehend the meaning of the data and the corresponding visual-izations ViA recommends.
ViA was used to visualize four attributes: temperature, wind speed, pressure, and
precipi-tation. Table 6.1 summarizes the characteristics of these attributes.