ABSTRACT
MALONEY, PETER VINCENT. New Advances in Fall Sown Oat Winter Hardness. (Under the direction of J. Paul Murphy.)
Fall sown oats (Avena sativa L.) are plagued by a poor ability to tolerate freezing temperatures. Of all the fall sown small grain cereals, oats have the poorest winter field survival. Advances in marker technology and mapping techniques have allowed for more efficient and accurate location of quantitative trait loci (QTL). With these new technologies, breeders can more accurately screen early segregating generations for winter hardiness component traits.
The objectives of this research were: (i) screen and validate new microsatellite or simple sequence repeat (SSR), single nucleotide polymorphism (SNP), and cleaved amplified polymorphic sequences (CAPS) markers; (ii) map new SSR, SNP, and CAPS markers to the Fulghum (winter tender) x Norline (winter hardy) recombinant inbred population (iii) screen the Fulghum x Norline population for QTL linked to winter hardiness component traits and (iv) develop a association mapping population to test for marker associations across a wider oat genetic base for winter hardiness component traits and validate marker use in marker assisted selection (MAS).
co-dominant and 11 were dominant makers. Polymorphic information content (PIC) scores were generated for JAO primers with an average PIC score of 0.64 and an average of five alleles per primer pair.
Sixty-five new SSR markers, four SNP markers and one CAPS marker were added to the Fulghum x Norline linkage map. This brought the total number of markers mapped on the population to 101. The map contained 19 different linkage groups for a total distance of 326.9 cM. Four major QTL were identified for winter field survival. Norline contributed three of the QTL and Fulghum contributed one QTL for increased winter field survival. Most of the winter field survival QTLs were located around the TC7-17 translocation event characteristic of Norline. Other QTL were identified for crown freezing tolerance, photoperiod effect, vernalization effect, heading date, and plant height.
New Advances in Fall Sown Oat Winter Hardness
by
Peter Vincent Maloney
A thesis submitted to the Graduate Faculty of North Carolina State University
in partial fulfillment of the requirements for the Degree of
Master of Science
Crop Science
Raleigh, North Carolina 2009
APPROVED BY:
David Marshall
Gina Brown-Guedira
David P. Livingston
J. Paul Murphy
DEDICATION
BIOGRAPHY
ACKNOWLEDGEMENTS
I would first like to thank my committee for all the help and support they have shown me through my graduation process. They are a very dedicated group of individuals with a wealth of knowledge among them all. Through all the troubles and the countless questions I had they never tired and continued to show their support and for that I could not be more grateful
Secondly I would like to thank those that worked with me in the small grains breeding program. The countless hours of harvesting, planting, filling pots, running markers and gels, etc. would never have been completed without the dedicated people that put in the long hours and hard days. René Navarro, Jeannette Lyerly, Dr. Judd Maxwell, and Sydney Jarrett, I thank you for all the support through those tough harvests and long hours in the lab.
TABLE OF CONTENTS
LIST OF TABLES ... vii
LIST OF FIGURES ... viii
CHAPTER I. LITERATURE REVIEW ... 1
OAT BACKGROUND ... 2
WINTER HARDINESS ... 4
GENETICS ... 5
QTL ... 5
MARKERS ... 7
Microsatellite or SSR markers ... 7
EST derived markers ... 8
Association Mapping ... 8
GENETICS OF CROWN FREEZING TOLERANCE ... 11
Previous Research ... 11
Objectives ... 11
REFERENCES ... 13
CHAPTER II. MARKER DEVELOPMENT AND QUANTITATIVE TRAIT LOCI IN A FALL-SOWN OAT RECOMBINANT INBRED POPULATION ... 19
ABSTRACT ... 20
INTRODUCTION ... 21
MATERIALS AND METHODS ... 24
Mapping Population ... 24
Molecular Markers ... 24
DNA Extraction, Primer selection and PCR ... 24
Band Recovery for Sequence Analysis ... 27
CAPS Marker Development ... 28
SNP Marker Development for Luminex 100 ... 29
Mapping Method ... 30
Polymorphic Information Content ... 31
Phenotypic Evaluations ... 32
RESULTS ... 34
EST-derived SNP markers for oat... 36
Linkage Map ... 38
Quantitative Trait Loci ... 39
DISCUSSION ... 40
QTL ... 43
REFERENCES ... 46
CHAPTER III. ASSOCIATION MAPPING OF CROWN FREEZING TOLERANCE IN OAT ... 57
INTRODUCTION ... 59
MATERIALS AND METHODS ... 62
Plant material ... 62
DNA extraction, Maker selection, and PCR ... 62
Phenotypic data ... 64
Crown freezing tolerance ... 64
Genotypic and Subpopulation Analysis ... 66
Association mapping ... 67
RESULTS ... 68
Phenotypic and Genotypic Data ... 68
Subpopulation analysis ... 68
Association mapping ... 69
DISCUSSION ... 71
Genotypic analysis ... 71
Association Mapping ... 72
Origins of the Crown Freezing Tolerance Trait ... 73
Marker Assisted Selection ... 75
LIST OF TABLES
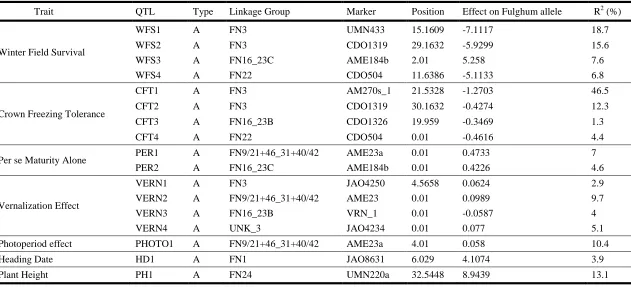
Table 2.1: Component of winter hardiness traits, QTL name, Type of Effect, Linkage Group where QTL is located, associated linkage group, associated marker positions and effects in an oat population of 128RIL developed from a cross of Fulghum and Norline ... 51
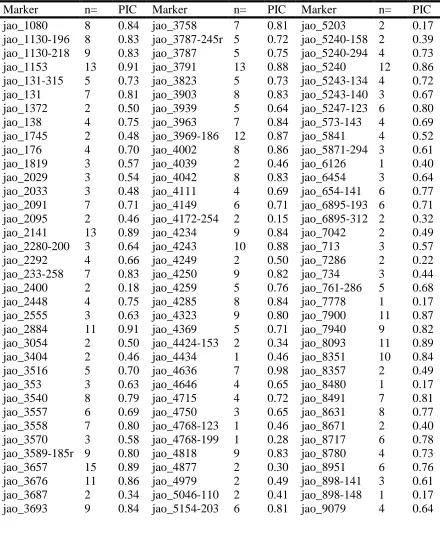
Table 2.2: Marker designations, number of alleles per locus and PIC Scores generated from a panel of 11 oat cultivars. ... 52
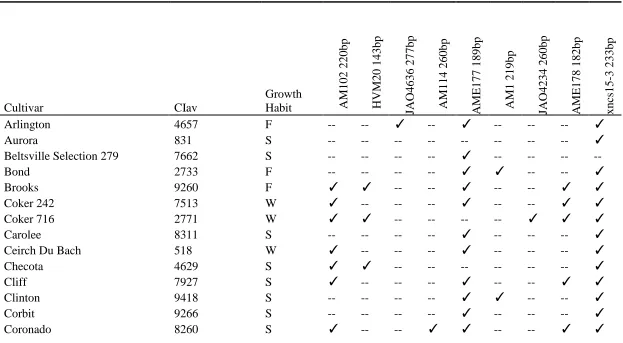
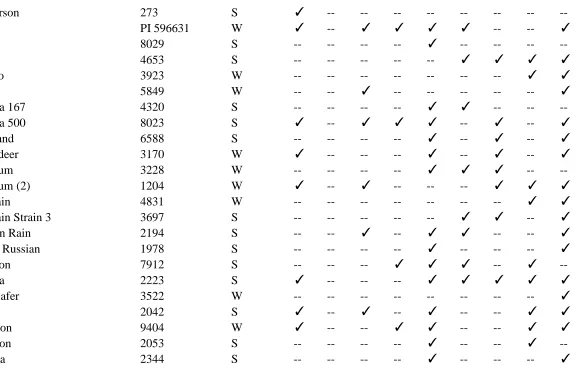
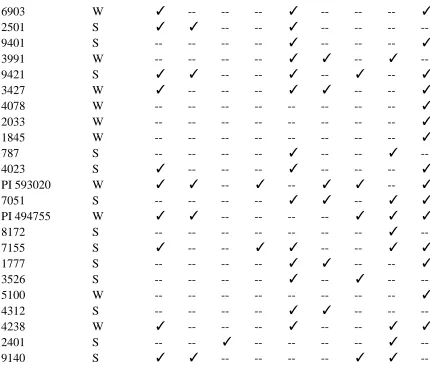
Table 3.1: Cultivars used for the mapping population, the CIav identification number, the cultivars growth habit, and the scores for the four marker loci with corresponding allele sizes in base pairs (bp). ... 82
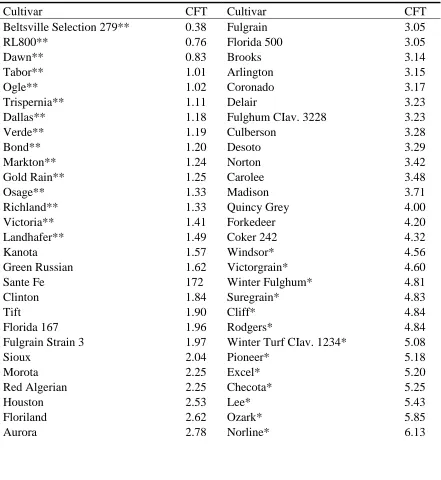
Table 3.2: LSmeans calculated using PROC MIXED in SAS for Crown Freezing
Tolerance scores (CFT) for each cultivar in the association mapping population and mean for the crown freezing tolerance scores. ... 86
LIST OF FIGURES
Figure 2.1: Molecular marker linkage map from ‗Fulghum‘ X ‗Norline‘ using 128 F6 derived recombinant inbred lines. Markers include RFLPs, SSRs, and SNPs and distances are listed by cM positions. Linkage groups are named according to previously identified linkage groups. Five groups are unnamed. ... 54
Chapter I
Oat Background
The annual US production of oat was about 78 million bushels in 2007 (FAO 2007). Oat production in the United States and around the world has declined over the past few decades due to the drop in on farm feed use. The United States production alone has been cut by over a third since 1990 (308 million bushels).
Oats were unknown in the Americas before Columbus. Two types of hexaploid cultivated oat were introduced to the Americas. The Spanish cultivars (Avena byzantina C. Koch) brought into the southern latitudes were of Mediterranean origin and the English cultivars (A. sativa L.) brought into the northern latitudes were of northern European origin. In the interim there has been widespread intermingling of the two germplasm pools in breeding programs. Contemporary cultivated hexaploid oats are generally classified as A. sativa, but Zhou et al. (1999) and Jellen and Beard (2000) illustrated their separate ancestry based on an interchromosomal translocation and molecular marker profiles.
Avena sativa is a hexaploid with 42 chromosomes (2n = 6x = 42). Other species of oat occur naturally at the diploid, tetraploid and hexaploid level. Common cultivated oat has the A, C, and D genomes while the tetraploid species contain the A and D or A and C genomes (Hayasaki et al. 2000). Diploid species contain either the A or C genomes.
Oat consumption has been found to lower cholesterol and blood glucose levels (Wood et al., 2007; Nilsson et al., 2008), which has led to increased human consumption of oat over the last 20 years.
Most of today‘s U.S. cultivars are descendents of a limited number of introductions
(Stanton, 1955). Important early cultivars and landraces include Red Rust Proof, Winter Turf, Victoria, Green Russian, Markton and Red Algerian. Red Algerian and Red Rust Proof (thought to be a selection from Red Algerian) were both introduced into the Mexico– California area before 1811. Red Algerian is thought to have originated in Algeria and Red Rust Proof from the Mediterranean region of Europe. Winter Turf was first introduced into Virginia from England and was cultivated by George Washington at Mount Vernon. Victoria was introduced into the US in 1927. It is thought to have originated from a cultivar grown for many years in Uruguay. Green Russian may have been introduced to Iowa or Minnesota in 1870 by Russian or some other European immigrant. Markton was a selection from an un-named variety in Turkey. It was introduced into the US in 1904 (Stanton, 1955).
Winter Hardiness
Winter hardiness is a complex trait that encompasses tolerance to all adverse winter variables such as freezing temperatures, soil heaving, and reduction in vigor due to disease. The many factors influencing winter hardiness include, but are not limited to, heading date, vernaliztion response, photoperiod, and crown meristem freezing tolerance. Crown meristem freezing tolerance is the most important quantitative trait contributing to winter hardiness in oat (Marshal, 1965; Livingston et al., 2004).
Freezing damage occurs when water inside the plant cell becomes subject to ice formation. This can cause three different ice induced stresses on the plant: intracellular ice formation, adhesion and freeze dehydration. Intracellular ice formation is a sudden and destructive process of ice formation inside the plant cell. This can cause extreme damage to the cell resulting in death (Steponkus, 1984). In most cold hardy plants, however, as the temperature lowers the plant excludes water from its protoplast causing the water to freeze in the intracellular space (Steponkus, 1984). This causes a drop in the osmotic pressure outside the cell and water diffuses out of the cell causing an increase in the concentration of dissolved salts in the protoplast, which effectively stops ice formation (Steponkus, 1984; Olien and Smith, 1977).
the ice formations (Olien and Smith, 1977). This can cause distortion of the cell membrane and result in more internal damage to the cell, possibly involving plant death.
Freeze dehydration is caused by the lack of usable water inside a plant cell. As intracellular ice is formed, more water diffuses out of the cell changing the osmotic pressure and the pH inside the cell. This can have adverse effects on the cell wall and the other organelles inside the cell. As the pH changes, normal cell functions can be disrupted and cause cell damage (Steponkus, 1984). It can also cause cell death, depending on exposure and duration. Phenotypically this looks like a plant response to drought.
Crown freezing tolerance contributes the most to a plants ability to survive harsh winter climates. Crown freezing tolerance can be classified as the crown‘s ability to tolerate
below freezing temperatures (Livingston, 1996). It has been hypothesized that crown freezing tolerance accounts for most of the winter hardiness in oat.
Genetics
QTL
the genome and find a correlation between the presence of a marker and a phenotypic response.
One of the most common sources of phenotypic and marker data is recombinant inbred lines (RIL). These are inbred lines derived from crossing two parents that differ phenotypically for the trait under investigation. Combing phenotypic data and marker data collected from a population of RIL can lead to the identification of QTL. The accuracy of mapping QTL is directly proportional to the population size, marker density and the quality of the phenotypic data collected. The larger the population the more recombinant events observed and the higher resolution the QTL map. Accurate tagging of QTL that control a low heritability trait such as freezing tolerance is particularly beneficial to the plant breeder because marker assisted selection enhances phenotypic selection.
Markers
Microsatellite or SSR markers
EST derived markers
Expressed Sequence Tag (EST) derived markers are usually Microsatellite or Single Nucleotide Polymorphism (SNP) markers made from a cDNA library. mRNA is first collected from the plant or animal species of interest. Then, by use of reverse transcriptase the RNA produces a copy of DNA called cDNA. This cDNA approximates the sequence of the transposable DNA located in the host cell. The sequence of the cDNA can be utilized to develop markers. The drawback is that it is unknown where the DNA is located in the genome without having a sequenced genome, but it is a quick and cost effective way to recover markers. ESTs have been used to show the synteny between cereal crops like rice, wheat, and maize and match certain sequences to known gene functions (Ahn et al., 1993). Other plants like Arabidopsis have also been used to show similarity in sequences (Brautigam, 2005).
Association Mapping
from linkage disequilibrium. Linkage disequilibrium is identified by the non random correlation between alleles at a pair of markers. By using association mapping one can draw information from a larger germplasm base than a traditional QTL study. Through the use of association mapping, better marker trait associations can be identified and put directly into marker-assisted selection programs (Jannink et al., 2001). The down side to this approach is that association mapping is less powerful at detecting rare QTLs than in tradition linkage studies.
Association mapping is based on the historical and evolutionary recombination events at the population level (Nordborg and Tavare, 2002; Risch and Merikangas, 1996). In contrast to standard linkage analysis, association mapping offers superior mapping resolution, a reduction in research time, and a greater number of alleles to work with (Yu and Buckler, 2006; Zhu et al., 2008). Association mapping has been gaining popularity since its debut in plants. It uses the statistical association between genotypes at a given locus and a phenotype. The strong correlation between the marker and the phenotype gives significant evidence to conclude that there is a close physical linkage between the marker and the QTL of interest.
scans through the whole genome to locate areas of association for complex traits (Risch and Merikangas, 1996).
Genetics of crown freezing tolerance
Previous Research
Research was begun by David Wooten a PhD Graduate at NCSU - Crop Science Department. David used different marker systems to develop a partial linkage map in a targeted region in the Fulgum/Norline recombinant inbred population. The RIL used in the experiments were phenotyped and screened for QTL linked to winter hardiness component traits. He concluded there was a link between the barley marker HVM20 and the translocation event T7C-17. This translocation is known to have certain QTL associated with winter field survival and crown freezing tolerance (Santos et al., 2006; Wooten et al., 2007; Wooten et al., 2008; Wooten et al., 2009).
My research built upon Wooten‘s work to place more makers (mainly SSR markers)
on the Fulghum x Norline linkage map, associate more QTL to the linkage groups, and develop an association mapping population to further the ability of marker assisted selection for winter hardiness.
Objectives
2. Find additional markers linked to the winter hardiness component trait QTL in the
Fulghum / Norline recombinant inbred population.
3. Search for additional winter hardiness component trait QTL in the Fulghum / Norline
recombinant inbred population using the new linkage map enhanced with additional
SSR markers.
4. Evaluate a selection of historically important winter oat cultivars for crown freezing
tolerance using controlled environment and field evaluations.
5. Place markers on the association mapping population and screen for marker
References
Ahn, S., Anderson, J.A., Sorrells, M.E., and Tanksley, S.D. 1993. Homoeologous relationships of rice, wheat and maize chromosomes. Mol. Gen. Genet. 241: 483–490 Becher, R. 2007. EST-derived microsatellites as a rich source of molecular markers for oats. Plant Breeding 126, 274—278.
Bossolini, E, Krattinger, S, & Keller, B. 2006. Development of simple sequence repeat markers specific for the Lr34 resistance region of wheat using sequence information from rice and Aegilops taushii . Theoretical and Applied Genetics. 113:1049-1062.
Brautigam, M., A. Lindlof, S Zakhrabekova, g. Gharti-Shhetri, B. Olsson, and O. Olsson. 2005.Generation and analysis of 9792 EST Sequesnces from cold Acclimated oat, Avena sativa. BMC Plant Biol. 5:18
Breseghello, F. and M.E. Sorrells. 2005. Association mapping of kernel size and milling quality in wheat (triticum aestivum L.) cultivars. Genetics 172:1165.
Buerstmayr, H., N. Krenn, U. Stephan, H. Grausgruber, and E. Zechner, 2007.
Agronomicperformance and quality of oat (Avena sativa L.) genotypes of worldwide origin produced under Central European growing conditions. Field Crops Research 101 (2007) 343–351.
Carlson, C.S., M.A. Eberle, L. Kruglyak and D.A. Nickerson. 2004. Mapping complex disease loci in whole-genome association studies. Nature 429:446.
Ewens, W.J. and R.S. Spielman. 1995. The transmission/disequilibrium test: History, subdivision, and admixture. Am. J. Hum. Genet. 57:455.
Falconer, D.S., and T.F.C. Mackay. 1996. Introduction to quantitative Gentetics. 4th ed. Addison Wesley Longman, Essex, UK
Fowler, D.B., A.E. Limin, and J.T. Ritchie. 1999. Low-Temperature Tolerance in Cereals: Model and Genetic Interpretation. Crop Sci. 39:626–633
Fox, S.I., E.N. Jellen, S.F. Kianian, H.W. Rines, R.L. Phillips. 2001. Assignment of
Fu, Y., J. Chong, T. Fetch, and M. Wang, 2007. Microsatellite variation in Avena sterilis
oat germplasm. Theor Appl Genet 114:1029–1038.
Groh, S., S.F. Kianian, R.L. Phillips, H.W. Rines, D.D. Stuthman, D.M. Wesenberg, R.G. Fulcher. Analysis of factors influencing milling yield and their association to other traits by QTL analysis in two hexaploid oat populations. Theoretical and Applied Genetics 103:9–18. Hayasaki, M., T. Morikawa, and I. Tarumoto. 2000. Intergenomic translocation of
polyploidy oats (genus Avena) revealed by genomic in situ hybridization. Genes Genet. Syst. 75:167-171.
Holland, J.B., S.J. Helland, N. Sharopova, and D.C. Rhyne. 2001. Polymorphism of PCR-based markers targeting exons, introns, promoter regions, and SSRs in maize and introns and repeat sequences in oat. Genome 44: 1065–1076.
Jannink, J.L., Bink M. and Jansen R. C. 2001. Using complex plant pedigrees to map valuable genes. Trends Plant Sci. 6:337.
Jin, H., L.L. Domier, X. Shen, and F.L. Kolb. 2000. Combined AFLP and RFLP mapping in two hexaploid oat recombinant inbred populations. Genome 43: 94–101
Jellen, E.N., and J. Beard. 2000. Geographical Distribution of a Chromosome 7C and 17 Intergenomic Translocation in Cultivated Oat. Crop Sci. 400:256–263.
Jones, E.S., M.P. Dupal, R. Kölliker, M.C. Drayton, and J.W. Forester. 2001.
Development and characterisation of simple sequence repeat (SSR) markers for perennial ryegrass (Lolium perenne L.). Theor Appl Genet 102:405–415.
Kennedy, B.W., M. Quinton and J.A.M. Vanarendonk. 1992. Estimation of effects of single genes on quantitative traits. J. Anim. Sci. 70:2000.
Killian, B. H. Özkan, J. Kohl, A. Haeseler, F. Barale, O. Deush, A. Brandolini, C. Yucel, W. Martin, F. Salamini. 2006 Haplotype structure at seven barley genes: relevance to gene pool bottlenecks, phylogeny of ear type and site of barley domestication. Mol Gen Genomics 276:230–241.
Lander, E.S. and N.J. Schork. 1994. Genetic dissection of complex traits. Science 265:2037.
Livingston, D.P. 1996. The second-phase of cold hardening: Freezing Tolerance and fructan isomer changes in winter cereal crowns. Crop Sci. 36:1568-1573. Livingston, D.P. and G.F. Elwinger, J.P. Murphy. 2004 Moving beyond the winter hardiness plateau in US oat germplasm. Crop Sci. 44:1966-1969.
Livingston, D.P., S.P. Tallury, R. Premakumar, S.A. Owens, nad C.R. Olien. 2005. Changes in the Histology of Cold-Hardened Oat Crowns during Recovery from Freezing. Crop Sci. 45:1545-1558.
Littell, R.C., G.A. Milliken, W.W. Stroup, and R.D. Wolfinger. 1996. Sas system for mixed models. Sas Institute, Inc., Cary, N.C.
Liu, Z.W., R.M. Biyashev, M.A. Saghai Maroof. 1996. Development of simple sequence repeat DNA markers and their integration into a barley linkage map. Theor Appl Genet 93: 869-876.
Mackay, T.F.C. 2001. Quantitative Trait Loci in Drosophila. Genetics 2:11-20 Marshall HG. 1965. A technique of freezing plant crowns to determine the cold resistance of winter oats. Crop Science 5: 83–86.
Marshall, H.G. 1992. Breeding oat for resistance to environmental stress. P. 700-745. In
H.G. Marshall and M.E. Sorrells (ed.) Oat Science and Technology. Agron. Monogr. 33 ASA and CSSA, Madison, WI.
Murphy, J.P., and L.A. Hoffman. 1992. The orgin, history, and production of oat. P. 1-28.
In H.G. Marshall and M.E. Sorrells (ed.) Oat Science and Technology. Agron. Monogr. 33 ASA and CSSA, Madison, WI.
Nilsson, A.C., E.M. Ostman, Y. Granfeldt and I.M. Bjorck. 2008. Effect of cereal test breakfasts differing in glycemic index and content of indigestible carbohydrates on daylong glucose tolerance in healthy subjects. Am. J. Clin. Nutr. 87:645-654.
Nordborg, M. and S. Tavaré. 2002. Linkage disequilibrium: What history has to tell us. Trends in Genetics 18:83.
Olien, C.R. and M.N. Smith. 1977. Ice Adhesions in Relation to Freeze Stress. Plant Physiol. 60:499-503.
Pearce, R.S., C.E. Houlston, K.M. Atherton, J.E. Rixon, P. Harrison, M.A. Hughes, and M.A. Dunn. 1998 Localization of Expression of Three Cold-Induced Genes, blt101, blt4.9, and blt14, in Different Tissues of the Crown and Developing Leaves of Cold-Acclimated Cultivated Barley1. Plant Physiol. 117: 787–795.
Portyanko, V.A., D.L. Hoffman, M. Lee, and J.B. Holland. 2001. A linkage map of hexaploid oat based on grass anchor DNA clones and its relationship to other oat maps. Genome 44: 249–265. 2001.
Pritchard, J. and N. Rosenberg. 1999. Use of unlinked genetic markers to detect population stratification in association studies. Am. J. Hum. Genet. 65:220.
Pritchard, J., M. Stephens, N. Rosenberg and P. Donnelly. 2000. Association mapping in structured populations. Am. J. Hum. Genet. 67:170.
Pritchard, J.K., Stephen M. and Donnelly P. 2000. Inference of population structure using multilocus genotype data. Genetics 155:945.
Risch, N. and K. Merikangas. 1996. The future of genetic studies of complex human diseases. Science 273:1516.
Santos, S.G., D.P. Livingston, E.N. Jellen, D.R. Wooten, and J.P. Murphy. 2006. A cytological Marker associated with winterhardiness in oat. Crop Sci. 46:203-208. Stanton, T.R. 1955. Oat Identification and Classification. United States Department of Agriculture. Technical Bulletin No. 1100.
Stein, N., G. Herren, B. Keller. 2001. A new DNA extraction method for high-throughput marker analysis in a large-genome species such as Triticum aestivum. Plant Breeding 120:354–356.
Stephens, M., N.J. Smith, and P. Donnelly. 2001. A New Statistical Method for Haplotype Reconstruction from Population Data. Am. J. Hum. Genet. 68:978–989. Steponkus, P.L. 1984. Role of the Plasma Membrane in Freezing Injury and Cold Acclimation. Ann. Rev. Plant Physiol. 1984.35:543.
Tabakoff, B., S.V. Bhave, and P.L. Hoffman. 2003. Selective Breeding, Quantitative
Teponkus, P/L/ 1984. Role of the plasma membrane in freexing injusry and cold acclimation. Annu. Rev. Plant Physiol. 35:543-581.
Thomas, H., Cytogenetics of Avena p. 473-503. In H.G. Marshall and M.E. Sorrells (ed.) Oat Science and Technology. Agron. Monogr. 33 ASA and CSSA, Madison, WI.
Thomashow, M.F. 1999. Plant cold acclimation: Freezing tolerance genes and regulatory mechanisms. Ann. Rev. Plant Physoiol. Plant Mol. Biol. 50:571-599
T.R. Stanton. 1955. Oat Identification and Classification. United States Department of Agriculture Technical Bulletin No. 1100.
Wight, C.P., N.A Tinker, S.F. Kianian, M.E. Sorrels, L.S. O‘Donoughue, D.L. Hoffman, S. Groh, G.J. Scoles, C. Dao Li, F.H. Webster, R.L. Phillips, H.W. Rines, S.M. Livingston, K.C. Armstrong, G. Fedak, and S.J. Molnar. 2003. A molecular marker map in ‗Kanota‘ × ‗Ogle‘ hexaploid oat (Avena spp.) enhanced by additional markers and a robust framework. Genome 46: 28–47.
Wood, P.J., U. Beer and G. Butler. 2007. Evaluation of role of concentration and
molecular weight of oat β-glucan in determining effect of viscosity on plasma glucose and insulin following an oral glucose load. Br. J. Nutr. 84:19
Wooten, D. R., D. P. Livingston III, E. N. Jellen, K. J. Boren, D. Marshall, and J. P. Murphy.2007. An Intergenomic Reciprocal Translocation Associated with Oat Winter Hardiness Component Traits. Crop Sci. 47:1832-1840.
Wooten, D. R., D. P. Livingston III, J. B. Holland, D. Marshall, and J. P. Murphy. 2008. Quantitative trait loci and epistasis for crown freeze tolerance in the 'Kanota' x 'Ogle' hexaploid oat mapping population. Crop Sci. 48: 149-157.
Wooten, D. R., D. P. Livingston III, J. H. Lyerly, J. B. Holland, E. R. Jellen, D. Marshall, and J.P. Murphy. 2009. Quantitative trait loci and epistasis for oat winterhardiness
component traits (In Press).
Yamada, T., E.S. Jones, N.O.I. Cogan, A.C. Vecchies, T. Nomura, H. Hisano, Y. Shimamoto, K.F. Smith, M.D. Hayward, and J.W. Foster. 2004. QTL Analysis of Morphological, Developmental, and Winter Hardiness-Associated Traits in Perennial Ryegrass. Crop Sci. 44:925–935.
Zhou, X., E.N. Jellen, and J.P. Murphy. 1999. Progenitor Germplasm of Domesticated Hexaploid Oat. Crop Sci. 39:1208–1214.
Chapter II
Abstract
Avena sativa L., or common cultivated oat, has the poorest winter hardiness among the small grain cereals. Marker-assisted selection for improved winter survival in oat is difficult because the number of SSR markers available in this species is limited. The objectives of this research were to increase the number of SSR markers on the ‗Fulghum‘ x ‗Norline‘ recombinant inbred population genetic map, and to scan for QTL associated with
winter hardiness component traits, including winter field survival, crown freezing tolerance, vernalization response, and heading date. SSR markers were developed from ‗Kanota‘ and ‗Ogle‘ genomic DNA libraries that were enriched for eight microsatellite motifs. New
Introduction
Oat (Avena sativa L.) production in the United States dramatically declined during the latter part of the 20th century due to shifting farm practices (Murphy and Hoffman, 1992). Consequently, oat breeding and genetics research has not kept pace with other small grains, such as wheat (Triticum aestivum) or barley (Hordeum vulgare L.), due to reductions in the number of oat researchers and research funding. Nevertheless, oat research continues, and the utilization of new technologies is vital for more efficient genetic advance. Molecular marker research in oat was initiated in the 1980‘s and genetic maps were constructed based primarily on RFLP‘s (O‘Donoughue et al., 1995; Hoffman et al., 2006; Portyanko et al.,
2001). Mapping studies based on AFLP‘s were also reported (Jin et al., 2000). Other marker-based research in oats included the use of some wheat, barley and fescue (Festuca arundinacea) markers (Hu et al., 2007; Jensen et al., 2007), the development of new PCR based markers (Li et al., 2000; Song et al., 2005), and QTL analysis of important traits (Orr et al., 2007). Nevertheless, oat has lagged behind the other small grains in the development of PCR based markers and map construction. As a result, marker assisted selection has not become a routine procedure in oat cultivar development.
construction, genetic diversity estimation, and marker-assisted selection (Roder et al., 1998; Pal et al., 2002; Song et al., 2005; Nersting et al., 2006; Yu and Herrmann, 2006; Becher, 2007; Fu et al., 2007). Relatively few SSR markers have been reported for oat and placed on genetic maps. Becher et al. (2007) used 326 expressed sequence tags (ESTs) to develop 216 new SSR markers, and mapped 51 of them in the ‗Kanota‘ x ‗Ogle‘ population. Jannink et al. (2005) used sequences available in GenBank to develop 32 new SSRs, and placed 20 loci from 16 markers on the ‗Ogle‘ x ‗TAM-O301‘ map. SSRs from related grass species have
also been evaluated for amplification and marker development in oat (Hu et al., 2004).
Single nucleotide polymorphisms (SNPs) are the most common type of DNA-based markers and represent the smallest unit of genetic variation (Cho et al., 1999). SNP markers have been developed for a variety of crop species and were utilized for mapping and marker-assisted selection in barley, rye (Secale cereale L.), wheat, soybean (Glycine max L.), and grapevine (Vitis vinifera L.) (Kota et al., 2008; Varshney et al., 2007; Somers et al., 2003; Ha et al., 2007; Vezzulli et al., 2008). However, like other PCR-based markers, few SNPs have been developed and mapped in oat. Sequence information from PCR-based markers was used to develop SNP markers for the crown rust (caused by Puccinia coronata f. sp. avenae) resistance gene Pc94 (Chen et al., 2007). SNP markers linked to short plant stature were reported by Tanhuanpaa et al. (2006).
encompasses protection of the plant from freezing temperatures, soil heaving, and reduction in vigor due to disease. Wooten et al. (2009) mapped 23 RFLP markers based on their proximity to the chromosome 7C- Chromosome 17 (7C-17) translocation in the ‗Fulghum ‗x ‗Norline‘ recombinant inbred population, and 21 SSRs developed from oat genomic libraries
or from sequences available in GenBank (Li et al., 2000; Jannink et al., 2005). SSR markers were randomly distributed throughout the linkage map, but the RFLP markers were selected for their association with known traits. Multiple QTL associated with winter hardiness component traits were identified, and most of the QTL were localized around the 7C-17 translocation event.
The objectives of this research were to increase the marker density on the ‗Norline‘ x ‗Fulghum‘ map with newly developed PCR based markers, and to examine marker-QTL
Materials and Methods
Mapping Population
One hundred twenty eight random F6-derived recombinant inbred lines from a cross between ‗Fulghum‘ and ‗Norline‘ were utilized. Norline is a winter hardy cultivar developed
in Indiana (Patterson and Schafer, 1978), and contains the 7C-17 translocation (Jellen and Beard, 2000). Fulghum was developed by a single plant selection from the land race ‗Red Rustproof‘ (Stanton, et al., 1926; Coffman, 1977). Fulghum is a winter-tender cultivar and it
does not contain the 7C-17 translocation (Wooten et al., 2007).
Molecular Markers
DNA Extraction, Primer selection and PCR
Roder et al., 1998; Stephenson et al., 1998), tall fescue (Saha et al., 2004), and barley (Liu et al., 1996). ―JAO‖ primers were provided by Dr. Joe Anderson, USDA-ARS, Purdue
University.
SSR Primers were evaluated for amplification and marker quality using two panels. One panel contained six oat lines, ‗Kanota‘ (CIav 839), ‗Ogle‘ (CIav 9401) , ‗Wintok‘ (CIav 3424), ‗Norline‘ (CIav 6903), Fulghum (CIav 708), and ‗Rodgers‘ (PI 593020), and was
utilized for wheat, fescue, and barley primers. The second panel, utilized for the oat primers, contained one Kanota and and one Ogle accession provided by Dr. Joe Anderson, USDA-ARS West Lafayette, IN, the Kanota and Ogle accessions from the first panel, Fulghum, Norline, Wintok, Rodgers, ‗Tam O-301‘ (CIav 9198), PI220373 (Avena sterilis L.), and PI411744 (Avena sterilis L.). PCR amplifications were conducted to utilize both the LI-COR 4300 DNA Analyzer (LI-COR Biosciences, Lincoln, NE) and the ABI3130 Genetic Analyzer (Applied Biosystems, Foster City, CA) platforms. Forward primers were modified to include the M13 sequence (5‘-cacgacgttgtaaaacgac-3‘) on the 5-prime end for universal fluorescent
labeling (Rampling et al., 2001) with IRD700, IRD800 or labeled directly with NED, FAM, PET, or VIC. Primers were synthesized by MWG Operon (Huntsville, AL).
(2007), reducing the initial denaturing step to 5 min. Reactions for LI-COR analysis contained 0.4pmol forward primer, 1.5pmol reverse primer, and 1.5pmol M13-labeled primer in a 10µl final volume. PCR reactions for analysis on the ABI were carried out in a 12µl reaction volume with 1.5pmol of forward and 1.5pmol reverse primer.
PCR products were run on either 6.5% denaturing polyacrylamide gels in LI-COR 4300 DNA Analyzers (LI-COR Biosciences) at 48°C, 42W, 35mA, 1500V for 2.5 h, or on an ABI3130 Genetic Analyzer (Applied Biosystems) and analyzed according to the manufacturer‘s instructions. Fragment scoring was completed using AFLP Quantar 1.0
(KeyGene Products B.V., The Netherlands) or GeneMarker v1.5 (SoftGenetics, State College, PA). Primers that produced polymorphisms between the parents Norline and Fulghum were examined in the 128 F6:7 RIL
Band Recovery for Sequence Analysis
PCR amplification was completed as written for the LI-COR 4300. Band recovery utilized the LI-COR Odyssey Infared Imaging System (LI-COR Biosciences) according to the manufacturer‘s instructions with the following modifications. The grid-drawing step was
eliminated. One 25mm spacer was cut with a notch and used as a spacer on the gel surface during the scan. After the scan was complete, the image was saved and imported into Adobe Photoshop v. 7.0 (Adobe Systems, Inc., San Jose, CA). The image size was adjusted to 25cm to match the gel size, and the resulting image was printed. The plate containing the gel was placed over the printed image, with the notch cut into the spacer exactly matching the notch shown on the printed image. Bands were excised while looking at the printed image underneath the gel. A second scan was completed to confirm that the fragments of interest were successfully excised.
(Huntsville, AL) or Genewiz (South Plainfield, NJ). Sequences were evaluated using 4Peaks v.1.7 (Griekspoor and Groothuis, 2005). Sequence alignments were completed using ClustalW (Thompson et al., 1994).
CAPS Marker Development
instructions. Restriction digested PCR products were resolved by electrophoresis on 2.5% agarose gels and visualized with ethidium bromide.
SNP Marker Development for Luminex 100
Oat ESTs were selected from the database at NCBI (http://www.ncbi.nlm.nih.gov). Primers were designed from these ESTs and used to amplify 400-600bp fragments in the oat lines Norline and Fulghum. PCR was carried out in 10µl reactions containing 1X ThermoPol PCR Buffer, 0.2mM dNTPs (New England Biolabs), 0.5pmol forward primer, 0.5pmol reverse primer, 2X BSA, and 0.6U Taq Polymerase (New England Biolabs). Cycling conditions were of 95°C for 4 min, 17 cycles of 95°C for 30 s, 60°C for 30 s (-0.5°C per cycle), 72°C for 30 s, 25 cycles of 95°C for 30 s, 55°C for 30 s and 72°C for 30 s, and a final extension step of 72°C for 5 min. Successful amplifications were purified using a QIAquick PCR Purification Kit (Qiagen) and sequenced by Genewiz Sequences were examined using 4Peaks (v.1.7), alignments were completed using ClustalW, and SNPs were identified by visual inspection.
5‘-upstream from the SNP, and contain a tag at the 5‘ end complementary to a ZipCode sequence that was coupled to a Luminex xMap microsphere (Luminex Corp., Austin, TX). SBE reactions were carried out in a 5µl total volume containing 1X PCR Buffer (Promega, Madison, WI), 3.0mM MgCl2 (Promega), 6pmol SBE primer, 0.4µM biotin-ddNTP (Perkin-Elmer, Waltham, MA), 0.4µM ddNTP mix (Fermantas, Glen Burnie, MD), 0.192U Thermo Sequenase (Promega) and 2.5µl of cleaned PCR product. PCR cycling consisted of an initial denaturing step of 94°C for 1 min, followed by 79 cycles of 94°C for 15 s, 50°C for 15 s and 72°C for 20 s, and a final extension step of 72°C for 1 min. After cycling, SBE products were precipitated with 75% ethanol and dried overnight in the dark.
SNP genotyping was completed in a 50µl hybridization reaction containing dried PCR products, 1X TMAC buffer (3M tetramethylammonium chloride (Sigma, St. Loius, MO), 50mM Tris (pH 8.0), 4mM EDTA, and 0.1% Sarcosyl (Sigma)) and 3000 coupled microspheres (Luminex). Reactions were denatured at 90°C for 2 min, and then incubated at 54°C for 30 min. The microspheres were labeled with freshly made 0.04mg/µl streptavidin– R-phycoerythrin conjugate (Invitrogen, Carlsbad, CA) in 1X TMAC at 54°C for 30 min. Reactions were subsequently analyzed using the Luminex 100 flow cytometer (Luminex Corp., Austin, TX) with a setting of 100 beads per sample.
Mapping Method
linkage. The mapping unit used was the Centimorgan (cM). A recombination fraction of 0.300 and the Kosombi mapping function were used to determine the order of the loci.
The genetic linkage maps created in JoinMap 3.0 (Van Ooijen and Voorrips, 2001) were imported into QTL Cartographer 2.5 (Basten et al., 1994) and used to locate QTL linked to winter hardiness component traits as well as plant height and heading date. An initial LD score of 2.5 was used in the Composite Interval Mapping process to locate the major effect QTL. The final locations, along with the QTL effects and variance, were obtained using Multiple Interval Mapping function of the program. Single factor analysis was done using the Proc GLM function in SAS v9.0 (SAS Institute, 2003)) was utilized to determine the significance of the unlinked makers.
Polymorphic Information Content
Polymorphic information content (PIC) values for the ―JAO‖ markers were calculated
as described by Anderson et al. (1993):
k
j ij
i P
PIC
1 2 1
information for the ―JAO‖ primer pairs, including expected fragment size, marker quality
index, number of alleles, and PIC values, can be found in supplementary table 1.
Phenotypic Evaluations
Phenotypic evaluations on the 128 RILs of the Fulghum x Norline population were reported previously in Wooten et al. (2009). Briefly, crown freezing tolerance was evaluated at -10°C using a five replicate incomplete blocks within complete replications design in a controlled environment chamber. After three weeks of re-growth, recovery for each crown was visually measured on a scale of 0-10 (0=complete plant death, 10=no freezing damage). Winter field survival was evaluated using a randomized complete block design with five replications in each of three environments. The experiment was evaluated at the Upper Mountain Research Station (895m elevation) near Laurel Springs, NC in the 2003 and 2004 seasons, and at the Virginia Tech College of Agriculture and Life Sciences Kentland Research Farm (530m approximate elevation), near Blacksburg, VA in the 2004 season. Field survival was estimated for each plot after spring re-growth as the percent survival for the plots corrected for plot variation in germination.
was measured as the distance between the soil surface and the tip of the panicle of an average plant.
Results
SSR markers
Primer pairs derived from oat, included 41 AME SSRs from Becher (2007), one AM SSR from Pal et al. (2002), and 273 JAO primers from Dr. Joseph Anderson, USDA-ARS were selected for evaluation. Two hundred fifty-two of the 315 primers amplified products in oat, and 168 were polymorphic for at least one of the 11 oat lines tested. Among the JAO primers, 106 were co-dominant markers and 11 were dominant makers. JAO primers amplified an average of five alleles, with an average PIC score of 0.64. PIC values for the AME SSR primers were given in Becher (2007). Five primers pairs mapped to multiple loci; AME177, AME184, AME23, JAO233-258, JAO4818.
Of the 522 wheat genomic SSR primer pairs tested, 72 generated reproducible fragments in oat and were selected for additional study with Fulghum and Norline. Thirty primer pairs produced reproducible products in a sub-sample of the Fulghum x Norline population. Thirteen were polymorphic, and 12 produced dominant markers. Four wheat SSRs, xcfd15, xcfd18, xcfd33, and xgwm391, were placed on the Fulghum x Norline map.
One co-dominant set of fragments, amplified with wheat primer xcfd15, contained an (AT)6 repeat. Oat specific primers were designed to generate a cleaner PCR product. This marker mapped to linkage group FN3 and was designated xncs15-3. Xcfd15 mapped to deletion bin C-1DS3-0.48 on the wheat Chinese Spring deletion map. To examine the possibility of transferability of other wheat SSR markers from this region to oat, additional primer pairs from Chinese Spring deletion bin C-1DS3-0.48 were tested for amplification. These primers did not yield any reproducible products.
The sequence of the amplification product generated with xcfd18 primers contained three SNPs. The G/A polymorphism located at 147bp was used to create oat specific SNP primers and single-base extension primers for mapping using Luminex technology. This SNP, designated xncs4-18, mapped to linkage group FN7. A G/T polymorphism at 229bp occurred in a restriction enzyme recognition site. A CAPs marker, xncs5-18C, was produced by digesting PCR products amplified with oat-specific primers with MfeI. The restriction digest yielded two fragments in Fulghum (173bp and 103bp) and three fragments in Norline (121bp, 103bp, and 52bp). This marker mapped to linkage group FN7. The fragments from dominant markers xgwm391 and xcfd33 did not contain any SNPs or SSRs.
Of 18 tall fescue primers, two did not amplify, and nine amplified non-polymorphic fragments. The remaining seven primer pairs amplified fragments that were polymorphic for at least one oat line in the testing panel, but were not useful for mapping in the Fulghum x Norline population.
EST-derived SNP markers for oat
Currently, there are about 7600 oat ESTs in Genbank and two approaches were used for selecting candidate ESTs. The oat SSR marker xncs15-3, derived from the wheat SSR
xcfd15, mapped to linkage group FN3 in the Fulghum x Norline population in a region previously identified as an important QTL for winter hardiness (Wooten et al., 2009).
Xcfd15 is in bin C-1DS3-0.48 on the wheat Chinese Spring deletion map. In the first approach, 53 wheat ESTs from this deletion bin were used to identify oat ESTs for marker development through similarity searches. Nineteen oat ESTs were identified and primers were designed for 12 of them. In the second approach, 156 sequences associated with cold acclimation and sub-zero acclimation in wheat (Herman et al., 2006) were used to select candidate oat ESTs. Thirty-nine oat ESTs were identified and primers were designed for 20 of them.
directly sequenced to look for SNPs. Sequencing products were aligned with the EST from which they were derived to verify amplification of the expected product. A total of 6994bp were sequenced from Norline and 5948bp were sequenced from Fulghum. Sequencing yielded two SNPs and one single base pair deletion polymorphism from three separate PCR products. SNPs were validated in multiple reactions, and have been designated xncs1-CN819400, xncs2-CN815942, and xncs3-CN820496.
The SNP xncs1-CN819400 is a G/T polymorphism and maps on the Fulghum x Norline map to linkage group FN7 (Figure 2.1). This SNP was identified through sequence similarity between the wheat EST BE442851, described as wheat seedling root normalized cDNA from T. aestivum, and the oat EST CN819400. EST BE442851 maps in deletion bin C-1DS3-0.48 on the wheat Chinese Spring deletion map. Xncs2-CN815942 is a 1bp deletion polymorphism at the end of a small poly-C region, where an additional ‗C‘ base is present in Norline. Oat EST CN815942 was identified through similarity searches with the sequence HF17H18r-s-at, described as 2e-20 cyclophilin-A-1 T. aestivum (Herman et al., 2006). This SNP cannot be placed on the Fulghum x Norline map with the markers currently available.
AsVRN1
A portion of intron one from AsVRN1 was amplified using primers from Preston and Kellogg (2008). A large size polymorphism was observed between the parents, with a 393bp fragment being amplified from Norline and a 960bp fragment being amplified from Fulghum. Sequencing confirmed a 567bp insertion in Fulghum. The 960bp fragment was amplified from other lines in the oat panel, including Kanota, Wintok, TAM-301, Rodgers and A. sterilis PI220373. This polymorphism, labeled here as VRN1, mapped in the ‗Fulghum‘ x ‗Norline‘ population to linkage group FN16-23 (Figure 1).
Linkage Map
One hundred and one polymorphic loci were screened on the population. The resulting linkage map contained 73 different loci on 19 linkage groups that were located on up to 17 different chromosomes (Figure 1). Thirty seven loci were unlinked. The total length of the map was 326.94 cM. Comparatively, the Kanota x Ogle map contains 29 linkage groups and has a total length of 1890 cM (Wight et al., 2003), and the TAM-O301 x Ogle linkage map contains 34 linkage groups and covers 2049.2 cM. Linkage groups were assigned in accordance with previously named linkage groups (O‘Donoghue et al., 1995
breakpoint according to the nullisomic line for TC17 (Wooten et al., 2009) was between the
xcfd15 and AM270S_1 loci.
The segregation ratio for 64 markers did not differ significantly from the expected 1:1 ratio. Thirty seven markers, particularly those linked to the translocation breakpoint, showed segregation distortion.
Quantitative Trait Loci
QTL were identified for all 7 traits phenotyped in this population (Table 2.1). Two main effect QTLs, around 17 cM and 30 cM on linkage group FN3, for both winter field survival and crown freezing tolerance, showed very similar R2 values to those reported by Wooten et al. (2009) (Table 1). A reduction in the number of significant QTL for certain traits was observed. The major QTL for Crown Freezing Tolerance, CFT1, on FN3 explained over 46% of the variation. Three minor QTL on linkage groups FN3, FN16_23, and FN22 were also associated with crown freezing tolerance. The combination of three QTL accounted for the 18% of the variation in this trait.
Discussion
The addition of 89 SSR, three SNP, and one CAPS locus significantly increased the size of the Norline x Fulghum genetic linkage map in comparison to Wooten et al. (2009). Wooten et al. (2009) selected RFLP markers based on their proximity to the 7C-17 translocation, or their association with vernalization or photoperiod effects. In this study, markers were chosen based on their ability to show polymorphism between the same two parental cultivars. This resulted in more extensive genome coverage and the addition of linkage groups.
JAO primer pairs amplified one to 15 alleles with a mean allele number of five. PIC scores ranged from 0.15 to 0.98, with a mean score of 0.64. The mean number of alleles and PIC scores compare well with the mean of other studies in other small grain cereals (Peng et al., 2005; Hayden et al., 2006; Becher et al., 2007; Chabane et al., 2008).
of six of these fragments revealed an SSR in only one of them. This suggested that dominant polymorphisms may have been generated by differences in the priming region of one or both primers. Additional fragment sequencing needs to be completed in order to determine if these are true SSR markers. Sequencing these six fragments identified three SNPs, two of which were developed into oat markers. Overall, evaluating SSRs from wheat and tall fescue yielded few markers for the Fulghum x Norline genetic map.
EST databases have been informative for the development of SNP markers for a variety of crop plants including wheat (Somers et al., 2003), barley (Kota et al., 2003), and almond (Prunus dulcis L.) (Wu et al., 2008). Sequence information from PCR-based markers was used to develop SNP markers for the oat crown rust resistance gene Pc94 (Chen et al., 2007). A previous study in sunflower (Helianthus sp.) used ESTs with candidate functions in traits to develop SNP markers (Lai et al., 2005). A similar targeted approach was utilized to develop additional SNP markers for oats, focusing on ESTs with candidate functions in cold and sub-zero acclimation processes.
known oat winter hardiness QTLs. This approach may be more successful as ESTs are added to the oat database and further research yields additional information about the oat genome.
Amplification of AsVRN1 intron one generated a large, unexpected size polymorphism between Fulghum and Norline. Sequencing confirmed a 567bp insertion in Fulghum. This polymorphism was consistent, segregated in the population, and mapped to FN16-23. This differs from previous results of amplification in this region where a 395bp fragment was amplified from both Fulghum and Norline (Preston and Kellogg, 2008), and may represent variation among Fulghum accessions. This polymorphism was associated with a minor QTL for vernalization effect. It should be noted that even though a different sized polymorphism was found, the same trait association was identified.
areas on the distal ends of the linkage group; however xcfd15, xncs15-3, and AME107
mapped to the translocation event.
QTL
height, and heading date traits but the variation explained by the QTL was similar. The decrease in QTL can be attributed to the more densely populated linkage map.
The QTL for vernalization and winter field survival in the area around the translocation event were linked in repulsion. This was consistent with findings from Wooten et al. (2009) and Santos et al. (2006). It was hypothesized by Wooten et al. (2009) that the reason for the larger winter field survival effect caused by the translocation event in the Fulghum x Wintok population, was because the vernalization genes were linked in coupling instead of repulsion, unlike in the Fulghum x Norline population. Wintok and Norline have been used for many years as winter hardy checks in the uniform winter oat nursery. Wintok was a line developed from a cross between ‗Winter Fulghum‘ and ‗Hairy Culberson‘ in the
1940s. Wintok contains T7C-17, as does Norline. It is noteworthy that the QTL associated with AME 184b and AME23a were associated with many of the winter hardiness component trait. This suggests regions of gene clustering located around these marker loci.
References
Anderson, J.A., G. A. Churchill, J. E. Autrique, S. D. Tanksley, and M. E. Sorrells. 1993. Optimizing parental selection for genetic linkage maps. Genome 36:181.
Becher, R. 2007. EST-derived microsatellites as a rich source of molecular markers for oats. Plant Breeding 126:274-278.
Chabane, K., R. K. Varshney, A. Graner and J. Valkoun. 2008. Generation and exploitation of EST-derived SSR markers for assaying molecular diversity in durum wheat populations. Genet. Resour. Crop Evol. 55:869.
Chen, G., J. Chong, S. Prashar and J.D. Procunier. 2007. Discovery and genotyping of high-throughput SNP markers for crown rust resistance gene Pc94 in cultivated oat. Plant
Breeding 126:379-384.
Coffman, F.A. 1977. Oat history, identification and classification. USDA-ARS Tech. Bull. No. 1516. US Gov. Print. Office, Washington DC.
Fu, Y., J. Chong, T. Fetch and M. Wang. 2007. Microsatellite variation in Avena sterilis oat germplasm. TAG Theoretical and Applied Genetics 114:1029-1038.
Gao, L.F., R.L. Jing, N.X. Huo, Y. Li, X.P. Li, R.H. Zhou, X.P. Chang, J.F. Tang, Z.Y. Ma and J.Z. Jia. 2004. One hundred and one new microsatellite loci derived from ESTs (EST-SSRs) in bread wheat. TAG Theoretical and Applied Genetics 108:1392-1400.
Grau Nersting, L., S. Bode Andersen, R. von Bothmer, M. Gullord, and R. Bagger Jørgensen, 2006. Morphological and molecular diversity of nordic oat through one hundred years of breeding. Euphytica 150:327-337.
Ha, B., R.S. Hussey and H.R. Boerma. 2007. Development of SNP assays for marker-assisted selection of two southern root-knot nematode resistance QTL in soybean. Crop Sci. 47:S-73-82.
Herman, E.M., K. Rotter, R. Premakumar, G. Elwinger, R. Bae, L. Ehler-King, S. Chen and D.P. Livingston III. 2006. Additional freeze hardiness in wheat acquired by exposure to− 3◦ C is correlated with changes in physiology, structure, transcriptome and proteome. J. Exp. Bot. 57:3601.
Hoffman, D.L., J. Chong, E.W. Jackson and D.E. Obert. 2006. Characterization and mapping of a crown rust resistance gene complex (Pc58) in TAM O-301. Crop Sci. 46:2630-2635. Hu, G., E.W. Jackson and J.M. Bonman. 2007. Expansion of PCR-based marker resources in oat by surveying genome-derived SSR markers from barley and wheat. Crop Sci. 47:2004-2012.
Jannink, J.L. and S.W. Gardner. 2005. Expanding the pool of PCR-based markers for oat. Crop Sci. 45:2383-2387.
Jellen, E.N. and J. Beard. 2000. Geographical distribution of a chromosome 7C and 17 intergenomic translocation in cultivated oat. Crop Sci. 40:256-263.
Jensen, L.B., P.B. Holm and T. Lübberstedt. 2007. Cross-species amplification of 105
Lolium perenne SSR loci in 23 species within the poaceae. Molecular Ecology Notes 7:1155-1161.
Jin, H., L.L. Domier, X.J. Shen and F.L. Kolb. 2000. Combined AFLP and RFLP mapping in two hexaploid oat recombinant inbred populations. Genome 43:94-101.
Kota, R., S. Rudd, A. Facius, G. Kolesov, T. Thiel, H. Zhang, N. Stein, K. Mayer and A. Graner. 2003. Snipping polymorphisms from large EST collections in barley (Hordeum vulgareL.). Molecular Genetics and Genomics 270:24-33.
Lai, Z., K. Livingstone, Y. Zou, S. A. Church, S. J. Knapp, J. Andrews and L. H. Rieseberg. 2005. Identification and mapping of SNPs from ESTs in sunflower. Theor. Appl. Genet. 111:1532.
Li, C.D., B.G. Rossnagel and G.J. Scoles. 2000. The development of oat microsatellite markers and their use in identifying relationships among avena species and oat cultivars. Theor. Appl. Genet. 101:1259-1268.
Littell, R.C., G.A. Milliken, W.W. Stroup and R.D. Wolfinger. 1996. SAS system for mixed models. SAS Institute, Inc, Cary, N.C.
Marshall, H.G. and M.E. Sorrells. 1992. Oat science and technology. American Society of Agronomy Crop Science Society of America, Madison Wis. USA.
Murphy, J.P. and L.A. Hoffman. 1992. The origin, history, and production of oat. p. 1-28. In
H.G. Marshall and M.E. Sorrells (eds.) Agronomy Monograph 33 ed. American Society of Agronomy Crop Science Society of America, Madison Wis. USA.
Odonoughue, L.S., S.F. Kianian, P.J. Rayapati, G.A. Penner, M.E. Sorrells, S.D. Tanksley, R.L. Phillips, H.W. Rines, M. Lee, G. Fedak, S.J. Molnar, D. Hoffman, C.A. Salas, B. Wu, E. Autrique and A. Vandeynze. 1995. A molecular linkage map of cultivated oat. Genome 38:368-380.
Pal, N., J.S. Sandhu, L.L. Domier and F.L. Kolb. 2002. Development and characterization of microsatellite and RFLP-derived PCR markers in oat. Crop Sci. 42:912-918.
Patterson, F.L. and J.F. Schafer. 1978. Registration of Norline oats. Crop Sci. 18:356. Peng, J.H. and N. L. Lapitan. 2005. Characterization of EST-derived microsatellites in the wheat genome and development of eSSR markers. Functional Integrative Genomics 5:80. Pestsova E., M.W. Ganal and M.S. Roder. 2000. Isolation and mapping of microsatellite markers specific for the D genome of bread wheat. Genome 43:689-697.
Preston, J.C.,and E.A. Kellogg. 2007. Discrete developmental roles for temperate cereal grass VERNALIZATION1/FRUITFULL-like genes in flowering competency and the transition to flowering. Plant Physiol. 146:265.
Rampling, L.R., N. Harker, M. R. Shariflou and M. K. Morell. 2001. Detection and analysis systems for microsatellite markers in wheat. Aust. J. Agric. Res. 52:1131.
Roder, M.S., V. Korzun, K. Wendehake, J. Plaschke, M. Tixier, P. Leroy and M.W. Ganal. 1998. A microsatellite map of wheat. Genetics 149:2007-2023.
Rozen, S. and H.E.-. Skaletsky. 1999. Primer3 on the WWW for general users and for biologist programmers. Bioinformatics Methods and Protocols365-386.
SAS Institute. 2003. The SAS system for Windows. Release 9.0. SAS Inst., Cary, NC Somers, D., R. Kirkpatrick, M. Moniwa and A. Walsh. 2003. Mining single-nucleotide polymorphisms from hexaploid wheat ESTs. Genome 46:431.
Song, Q., J. Shi, S. Singh, E. Fickus, J. Costa, J. Lewis, B. Gill, R. Ward and P. Cregan. 2005. Development and mapping of microsatellite (SSR) markers in wheat. TAG Theoretical and Applied Genetics 110:550-560.
Stein, N., G. Herren and B. Keller. 2001. Short communication A new DNA extraction method for high-throughput marker analysis in a large-genome species such as triticum aestivum. Plant Breeding 120:.
Stephenson, P., G. Bryan, J. Kirby, A. Collins, K. Devos, C. Busso and M. Gale. 1998. Fifty new microsatellite loci for the wheat genetic map. TAG Theoretical and Applied Genetics 97:946-949.
Tanhuanpää, P., R. Kalendar, J. Laurila, A. H. Schulman, O. Manninen and E. Kiviharju. 2006. Generation of SNP markers for short straw in oat (Avena sativa L.). Genome 49:282. Van Ooijen JW and Voorrips RE. 2001. JoinMap®. 3.
Varshney, R., U U. Beier, E. K. Khlestkina, R. Kota, V. Korzun, A. Graner and A. Börner. 2007. Single nucleotide polymorphisms in rye (Secale cereale L.): Discovery, frequency, and applications for genome mapping and diversity studies. TAG Theoretical and Applied
Genetics 114:1105-1116.
Vezzulli, S., M. Troggio, G. Coppola, A. Jermakow, D. Cartwright, M. Stefanini, M.S. Grando, A. Adam-Blondon, M.R. Thomas, P. This and R. Velasco. 2008. A functional integrated map for cultivated grapevine (Vitis vinifera L.) from three pedigrees, based on 283 SSR and 501 SNP markers. Theor. Appl. Genet. 117:499-511.
Wooten, D.R. D. P. Livingston, III, E. N. Jellen, K. J. Boren, D. S. Marshall and J. P.
Murphy 2007. An intergenomic reciprocal translocation associated with oat winter hardiness component traits. Crop Sci. 47:1832.
Wooten, D. R., D. P. Livingston, III, H. J. Lyerly, J. B. Holland, E. N. Jellen, D. S. Marshall, and J. P. Murphy. 2009. Quantitative Trait Loci and Epistasis for Oat Winter Hardiness Component Traits. In Press.
Wu, S.B., M. G. Wirthensohn, P. Hunt, J. P. Gibson and M. Sedgley. 2008. High resolution melting analysis of almond SNPs derived from ESTs. Theor. Appl. Genet. 118:1.
Table 2.1: Component of winter hardiness traits, QTL name, Type of Effect, Linkage Group where QTL is located, associated linkage group, associated marker positions and effects in an oat population of 128RIL developed from a cross of Fulghum and Norline.
Trait QTL Type Linkage Group Marker Position Effect on Fulghum allele R2 (%)
Winter Field Survival
WFS1 A FN3 UMN433 15.1609 -7.1117 18.7
WFS2 A FN3 CDO1319 29.1632 -5.9299 15.6
WFS3 A FN16_23C AME184b 2.01 5.258 7.6 WFS4 A FN22 CDO504 11.6386 -5.1133 6.8
Crown Freezing Tolerance
CFT1 A FN3 AM270s_1 21.5328 -1.2703 46.5
CFT2 A FN3 CDO1319 30.1632 -0.4274 12.3
CFT3 A FN16_23B CDO1326 19.959 -0.3469 1.3
CFT4 A FN22 CDO504 0.01 -0.4616 4.4
Per se Maturity Alone PER1 A FN9/21+46_31+40/42 AME23a 0.01 0.4733 7 PER2 A FN16_23C AME184b 0.01 0.4226 4.6
Vernalization Effect
VERN1 A FN3 JAO4250 4.5658 0.0624 2.9
VERN2 A FN9/21+46_31+40/42 AME23 0.01 0.0989 9.7 VERN3 A FN16_23B VRN_1 0.01 -0.0587 4
VERN4 A UNK_3 JAO4234 0.01 0.077 5.1
Photoperiod effect PHOTO1 A FN9/21+46_31+40/42 AME23a 4.01 0.058 10.4
Heading Date HD1 A FN1 JAO8631 6.029 4.1074 3.9
Table 2.2: Marker designations, number of alleles per locus and PIC Scores generated from a panel of 11 oat cultivars.
Marker n= PIC Marker n= PIC Marker n= PIC
jao_1080 8 0.84 jao_3758 7 0.81 jao_5203 2 0.17
jao_1130-196 8 0.83 jao_3787-245r 5 0.72 jao_5240-158 2 0.39
jao_1130-218 9 0.83 jao_3787 5 0.75 jao_5240-294 4 0.73
jao_1153 13 0.91 jao_3791 13 0.88 jao_5240 12 0.86
jao_131-315 5 0.73 jao_3823 5 0.73 jao_5243-134 4 0.72
jao_131 7 0.81 jao_3903 8 0.83 jao_5243-140 3 0.67
jao_1372 2 0.50 jao_3939 5 0.64 jao_5247-123 6 0.80
jao_138 4 0.75 jao_3963 7 0.84 jao_573-143 4 0.69
jao_1745 2 0.48 jao_3969-186 12 0.87 jao_5841 4 0.52
jao_176 4 0.70 jao_4002 8 0.86 jao_5871-294 3 0.61
jao_1819 3 0.57 jao_4039 2 0.46 jao_6126 1 0.40
jao_2029 3 0.54 jao_4042 8 0.83 jao_6454 3 0.64
jao_2033 3 0.48 jao_4111 4 0.69 jao_654-141 6 0.77
jao_2091 7 0.71 jao_4149 6 0.71 jao_6895-193 6 0.71
jao_2095 2 0.46 jao_4172-254 2 0.15 jao_6895-312 2 0.32
jao_2141 13 0.89 jao_4234 9 0.84 jao_7042 2 0.49
jao_2280-200 3 0.64 jao_4243 10 0.88 jao_713 3 0.57
jao_2292 4 0.66 jao_4249 2 0.50 jao_7286 2 0.22
jao_233-258 7 0.83 jao_4250 9 0.82 jao_734 3 0.44
jao_2400 2 0.18 jao_4259 5 0.76 jao_761-286 5 0.68
jao_2448 4 0.75 jao_4285 8 0.84 jao_7778 1 0.17
jao_2555 3 0.63 jao_4323 9 0.80 jao_7900 11 0.87
jao_2884 11 0.91 jao_4369 5 0.71 jao_7940 9 0.82
jao_3054 2 0.50 jao_4424-153 2 0.34 jao_8093 11 0.89
jao_3404 2 0.46 jao_4434 1 0.46 jao_8351 10 0.84
jao_3516 5 0.70 jao_4636 7 0.98 jao_8357 2 0.49
jao_353 3 0.63 jao_4646 4 0.65 jao_8480 1 0.17
jao_3540 8 0.79 jao_4715 4 0.72 jao_8491 7 0.81
jao_3557 6 0.69 jao_4750 3 0.65 jao_8631 8 0.77
jao_3558 7 0.80 jao_4768-123 1 0.46 jao_8671 2 0.40
jao_3570 3 0.58 jao_4768-199 1 0.28 jao_8717 6 0.78
jao_3589-185r 9 0.80 jao_4818 9 0.83 jao_8780 4 0.73
jao_3657 15 0.89 jao_4877 2 0.30 jao_8951 6 0.76
jao_3676 11 0.86 jao_4979 2 0.49 jao_898-141 3 0.61
jao_3687 2 0.34 jao_5046-110 2 0.41 jao_898-148 1 0.17
Table 2.2 (continued)
jao_3707 10 0.80 jao_5195-195 0.47 jao_968 1 1 0.30
jao_3714 2 0.49 jao_5108-100 0.30 1
jao_3733-299r 5 0.69 jao_5195 0.71 4
Chapter III
Abstract
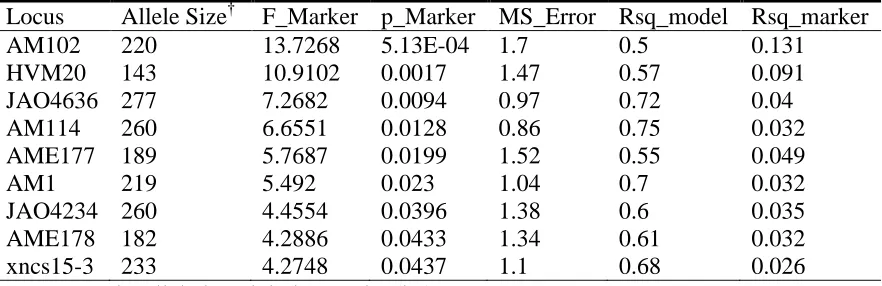
Association mapping is a method used to test the association between molecular markers and quantitative trait loci (QTL). Association mapping uses linkage disequilibrium to detect gene effects. This study utilized association mapping techniques to discover novel genes for crown freezing tolerance using 63 different cultivars of oat. Lines were phenotyped for crown freezing tolerance using an incomplete block design with three replications. Population structure and association analysis was done using 29 simple sequence repeat (SSR) markers. Marker trait association used 135 SSR loci in the mixed linear model (MLM) option in TASSEL 2.1. The subpopulation structure and kinship matrix were used as covariates in the MLM. A total of nine loci were associated with crown freezing tolerance. Some of the associated markers show linkage to winter hardiness component trait QTL in previous studies. These results confirm the existence of the QTL and further strengthen their possible use in marker assisted breeding efforts.
Abbreviations
QTL Quantitative Trait Loci; SSR, Simple Sequence Repeat, CFT, Crown
Freezing tolerance;, PCR, Polymerase chain reaction MAS, Marker Assisted Breeding;
Introduction
Winter hardiness, or the ability of a plant to remain viable and dormant during winter, is a complex trait involving diverse components such as vernalization response, cold stress, and crown freezing tolerances. Oat (Avena sativa L.) is the least winter hardy of the small grains and fall sown production only extends as far north as approximately the 2.8°C isotherm which includes regions of Missouri, Illinois, Indiana, Ohio and Pennsylvania (Marshall and Sorrells, 1992). Progress through selection for winter hardiness is difficult due to the quantitative genetic control and infrequent test winters. Nevertheless, marker assisted selection for winter hardiness traits has become feasible because of developments in QTL mapping, PCR based markers, and advanced computer software (Hu et al., 2007; Tanhuanpää et al., 2008; Tinker et al., 2009; Wooten et al., 2007; Wooten et al., 2008; Wooten et al., 2009; Maloney et al., in review). These recent studies make the testing and location of winter hardiness component trait QTL easier and more applicable for marker assisted selection.
Typical mapping studies in oats have utilized linkage mapping in bi-parental populations of recombinant inbred lines (O‘Donoughue et al., 1995; Hoffman et al.,
several plant species because of the potential advantages gained by sampling unrelated individuals in the population, a higher mapping resolution, and a greater number of possible alleles at marker loci because of the larger portion of the genome sampled (Flint-Garcia et al., 2003; Buckler and Thornsberry, 2002). In addition, association mapping can prove useful for validating QTL previously found in linkage analysis studies (Jefferies et al., 2000; Skøt et al., 2007). This allows for better validation of certain loci that may have application in a marker assisted selection program (Jannink et al., 2001, Breseghello and Sorrells, 2006; Gupta et al., 2005).