Peripheral blood biomarkers coupled with the Apolipoprotein E4 genotypeare strongly associated with semantic and episodic memory impairments in elderly subjects with amnestic mild cognitive impairment and Alzheimer’s dementia.
Short title: Biomarkers of neurocognition
Thitiporn Supasitthumrong (a), Chavit Tunvirachaisakul(a), Daruj Aniwattanapong(a), Sookjaroen
Tangwongchai (a), Phenphichcha Chuchuen (a), Itthipol Tawankanjanachot (a), Thiti Snabboon(a)
Solaphat Hemrungrojn (a), Andre F. Carvalho(b,c),Michael Maes (a,d,e)
a Department of Psychiatry, Faculty of Medicine, Chulalongkorn University, Bangkok, Thailand;
b Department of Psychiatry, University of Toronto, Toronto, ON, Canada;
cCentre for Addiction and Mental Health (CAMH), Toronto, ON, Canada;
dDepartment of Psychiatry, Medical University of Plovdiv, Plovdiv, Bulgaria;
eIMPACT Strategic Research Center, Deakin University, Geelong, Australia
Corresponding author:
Prof. Dr. Michael Maes, M.D., Ph.D.
IMPACT Strategic Research Center Barwon Health
Deakin University Geelong, Vic Australia
dr.michaelmaes@hotmail.com
https://scholar.google.co.th/citations?user=1wzMZ7UAAAAJ&hl=th&oi=ao
Thitiporn.s@chula.ac.th Chavit.t@chula.ac.th Daruj.A@chula.ac.th Sookjaroen.T@chula.ac.th Praewpsyche@gmail.com dritthipol@gmail.com Thiti.S@chula.ac.th Solaphat@hotmail.com Andre.Carvalho@camh.ca
Abstract
Background: The Apolipoprotein E4 (ApoE4) genotypeis strongly associated with Alzheimer’s
disease (AD), although the presence of the ApoE4 allele alone is not sufficient to explain AD. The
pathophysiology of amnestic mild cognitive impairment (aMCI) remains unclear. This study aims
to examine associations between peripheral blood biomarkers coupled with ApoE4 and episodic
and semantic memory.
Methods:The CERADbattery was completed and various biomarkers were assayedin 60 subjects
with aMCI, 60 with ADand 62 healthy controls.
Results:Deficits in semantic and episodic memory weresignificantly predicted by anion gap and
bicarbonate, albumin and glucose coupled with Apo E4. Furthermore, these peripheral biomarkers
interacted with ApoE to predictgreater memory impairments.
Conclusions: Peripheral blood biomarkers may interact with pathways related to ApoE4 to predict
greater semantic and episodic memory impairments, thus contributing to the pathophysiologyof
aMCI and AD. Our data suggest that the transition from aMCI to AD could at least in some cases
be associated with significant interactions between ApoE4 and those peripheral blood biomarkers.
Highlights
Common peripheral blood biomarkers, including anion gap, bicarbonate, albumin and
glucose coupled with ApoE4 hada significant effect on cognitive functions
Those peripheral blood biomarkers may interact with the pathways associated with ApoE4
to predictgreater memory impairments as compared toApoE4 alone
The transition from aMCI to AD may, in some cases, be explained by significant
interactions between ApoE4 and those peripheral blood biomarkers.
Introduction
Alzheimer’s disease (AD) is a progressive neurodegenerative and neuroinflammatory brain
disorder, (1, 2)which is characterized by a gradual declinein various cognitive domains including
learning and memory,attention, executive functions, language, perceptual-motor function and
social cognitionleading to meaningful impairments in functional status. (3) Moreover, AD patients
experience difficulties in carrying out activities of daily living (ADL) and upholding social
interactions, while a substantial subset of patients may develop behavioral and psychological
symptoms. (4, 5) This progressiveneurocognitive deteriorationappears to beassociated with the
accumulation of amyloid plaques and tau protein in the brain, which are well known
neurobiological correlatesof AD. (6, 7)
The apolipoprotein epsilon 4 (ApoE4) allele is the most widely replicatedgenetic risk factor
for AD. (8-10) Genome-wide association studies (GWASs) revealed that up to 40% of AD patients
carry the ApoE4 allele, and that the risk forAD further increases among carriers of the E4/E4
genotype (odds ratio = 14.9). (11) In Thai patients with AD, ApoE4 carriers show lower scoreson
both the Thai version of the Consortium to Establish a Registry for Alzheimer’s Disease (CERAD
-Th) and the Thai version of the short Boston Naming Test (T-BNT), (12, 13) while ApoE3 carriers
exhibitbetter performance on ADL and social skills. (12) Nevertheless, the ApoE genotype in
isolationis insufficient to explain all cases ofAD, thus suggesting that interactions with other
biomarkers could play a role in the pathophysiology of this neurodegenerative disorder.
Amnestic mild cognitive impairment (aMCI) is characterized by milder neurocognitive
impairments includingpoor learning ability, deficits in episodic and semantic memory, as wellas
language difficulties,but without an associated decline in ADL. (14-18) Conversion rates to AD is
greater in people with aMCI (14%) compared to the the general population (1-2%). (14) The
underlying pathophysiology of aMCI remains unclear and an association between aMCI and
ApoE4 has not been replicated across studies. (19) Furthermore, the risk of progression from aMCI
to AD seems to occurindependently ofthe ApoE genotype and amyloid neuropathology. (20)
However, recent findings suggestthat not only brain processes, but also peripheral immune
-inflammatory responses may play a role in the pathophysiology of AD. (21-23) For example, an
alternative neurobiologicalmodel of AD proposes that the ApoE4 allele, along with analtered
microRNA expression of TREM2 (triggering receptor expressed on myeloid cells-2) and an
increased transcription of TNFA (tumor necrosis factor alpha), could underpin peripheral and
central immune-inflammatory responses implicated in the pathophysiology of AD. (23, 24) There
is now evidence that peripheral blood pro-inflammatory biomarkers are increased in AD, including
pro-inflammatory cytokines, homocysteine, C-reactive protein, chemokines, epidermal growth
factor, adhesion molecules, and α1-antichymotrypsin. (22, 25, 26) Moreover, significant
associations between impairments in neuropsychiatric test results and peripheral blood biomarkers
in patients with aMCI and AD have been reported. (13, 27) For example, hypercholesterolemia, low
serum high-density lipoprotein (HDL) and high serum low-density lipoprotein, low serum B12, low
homocysteine levels, altered serum metabolomics as well as adecreased level of red blood cell
folate,are thought to promoteneurotoxicity and cognitive dysfunctionseen in patients with aMCI
neurocognitive impairments in AD are glucose, (31-33) and anion GAP (AGAP) and bicarbonate
(HCO3-) levels. (34) Furthermore, impairments in naming as measured with the T-BNT were
significantly associated with ApoE4 coupled with lower folic acid levels along withan increased
plasma triglyceride / HDL-cholesterol ratio, i.e. the atherogenic index of plasma (AIP). (13) We
reported that ApoE4 significantly predicted impairments in episodic and semantic memory in
patients with aMCI and AD. (12) However, there are no data to indicate whether peripheral
biomarkers such as glucose, AGAP, bicarbonate, folic acid, AIP, as well as lower albumin
(inflammatory biomarkers) couldinteract with ApoE4 to enhancethe prediction of episodic and
semantic memory impairmentsin elderly with aMCI and AD.
Thus, this study aimsto determine whether peripheral blood biomarkers and ApoE4 have
cumulative or moderator effects on CERAD test scores including verbal fluency test (VFT), world
list memory (WLM), WLRecall and WL Recognition tests. The specific hypothesis was that a
combination of ApoE4 and some of those biomarkers could enhance the prediction ofmemory
deficitsin aMCI and AD.
Subjects and Methods Subjects
Data for this study were drawn from a cross sectional database registry study for dementia funded by the Thai Government, which recruited 182 Thai participants of both sexes and ages
ranging from 55 to 90 years. (12, 35) Participants with memory impairment were enrolled from the
Dementia clinic, King Chulalongkorn Memorial Hospital, Bangkok, Thailand. Healthycontrol
participants were recruited from senior Red Cross volunteers at King Chulalongkorn Memorial Hospital and community healthy aging senior club members, in Pathumwan District area,
Bangkok, Thailand. Patients and HCswere recruited from the same catchment area (Pathumwan
district, Bangkok province). All participants were allocated in three groups, namely 60 with
amnestic mild cognitive impairment (aMCI), 60 with Alzheimer’s disease (AD) and 62normal
control (NC).
aMCI was diagnosed according to Petersen’s Criteria. (14) Additional inclusion criteria
were: (a) MMSE-Thai score higherthan 23 and (b) a CDR score of 0.5. Adiagnosis of AD was made
using criteria of the National Institute of Neurological and Communication Disorders and
Stroke/AD and Related Disorders association (NINCDS-ADRDA). (36) Additional inclusion criteria
for AD were: (a) Thai version of the Mini-Mental State Examination 2002 (MMSE-Thai) (37) score
between 10 and 23; (b) Thai version of Clinical Dementia Rating Scale (CDR) score between 1 and
2; and (c) impaired ADL, as assessed using the Blessed Dementia Scale for ADL. Controls did not
report any subjective memory complaints and had a CDR score of 0 and a MMSE score more than
23. Exclusion criteria for patients and HCs were: (a) neurologic diseases: Parkinson’s disease,
multiple sclerosis, meningitis, encephalitis, epilepsy, traumaticbrain injury; (b) medical diseases
includingsevere heart disease (functional class II or more), chronic obstructive pulmonarydisease
(exacerbation more than 3 times/month), uncontrolled hypothyroidism, vitaminB12 deficiency,
chronic kidney disease and cancer; (c) other dementiasyndromes, including vascular dementia and
frontotemporal lobe dementia, (d) axis 1 psychiatric disorders, including schizophrenia, substance
Depression Scale (TGDS) > 12; and (e) abnormal laboratory tests such as thyroid function tests,
vitaminB12 levels, VDRL and anti-HIV.
All participants and all guardians of patients with MCI and AD provided written informed
consent prior to participation in this study. The study was conducted according to Thai and
international ethics and privacy laws. Approval for the studywas obtained from the Institutional
Review Board of the Faculty of Medicine,Chulalongkorn University, Bangkok, Thailand (No
359/56), which is in compliancewith the International Guideline for Human Research protection
as required by the Declaration of Helsinki, The Belmont Report, CIOMS Guideline and
International Conference on Harmonization in Good Clinical Practice (ICH-GCP).
Methods
A senior psychiatrist and neurologistwith expertise in dementia assessed each participant
based on clinical history, physical and neurological examination and the Clinical Dementia Rating
(CDR). (38) A registered clinical psychologist who was blinded from the clinical diagnosis and CDR
scores assessed all participants using the CERAD-NP. We a priori selected 4 out of 8
neuropsychological subtests from the CERAD-NP namely the Word List Memory (WLM) to probe
verbal episodic memory or immediate working memory, Word List Recall (WLRecall) to probe the
ability to recall (delayed recall) and verbal episodic memory recall, and Word List Recognition
(WLRecognition) to probe verbal learning recall recognition or verbal episodic memory
-discriminability. (39)
MRI brain scans and blood sampling were performed following a protocol for all
participants in the CERAD-Th project including 1.5T MRI scans, basic blood tests, biochemical
parameters, and biomarkers including complete blood count, fasting blood sugar, serum
electrolytes, liver function test (ALT, AST), lipid profile (total cholesterol, high density lipoprotein,
low density lipoprotein), serum uric acid, kidney function test (blood urea nitrogen, creatinine
kinase and glomerular function rate), thyroid function test (free T3 and T4, TSH), serum B12 level,
serum folate, serum calcium and apolipoprotein phenotype. All blood assays were performed in
the Central Laboratory at the King Chulalongkorn Memorial Hospital, which is accredited
conforming to ISO 15189 standards.
LaboratoryAssays
Fasting blood was collected forall participants between 8.00 and 8.30 a.m. All biochemical parameters mentioned above were assayed by the Central Laboratory, Department of Laboratory Medicine, King Chulalongkorn Memorial Hospital, Bangkok, Thailand. This study used 3mL
clotted blood (serum), centrifuged at 1,000 g during 5 minutes and measured using Architect C8000
(Abbott Laboratories, Abbott Park, Illinois, USA) for the following parameters. Plasma glucose was
measured by Hexakinase/ G-6-PDH technique with inter-assay coefficients of variability (CV) of
2.0%. Blood electrolytes (Sodium, Potassium and Chloride) were measured by indirect ion selective
electrode (CV 1.3%, 1.4% and 1.2%, respectively). Blood carbon dioxide was measured by PEP
carboxylase method (CV 5.9%). Total cholesterol was measured by enzymatic assay (CV 1.6%).
measured by accelerator selective detergent (CV 4.0%), and LDL-cholesterol was measured by
liquid selective detergent (CV 7.4%). Folate levelswere measured using electrochemiluminescence
immunoassay (ECLIA) as analyzed by the Cobas 6.000 Analyzer (Roche, Germany). The inter-assay
CV values are < 9.8%.
Genomic DNA was extracted from peripheralblood leukocytes by standard procedures
with a DNAMini Kit (QIAGEN GmbH, Hilden, Germany). DNA wasamplified by using two
primers, 50-ACAGAATTCGCCCCGGCCTGGTACACAC-30 and 50
-TAAGCTTGGCACGGCTGAAGGA-30. Each amplification reaction contained 1:g ofleukocyte
DNA, 1 pmol/:l of each primer, 10% dimethyl sulfoxide,and 0.025 units/pl of Taq polymerase in a
final volumeof 30 :l. Each reaction mixture was heated at 95C for5 min followed by 40 cycles of
95 _C for 60 s, 65 _C for 80 sand 72 _C for 80 s with a final extension at 72 _C for 7 min. The
PCR products were treated with ExoSAP-IT (USPCorporation, Cleveland, USA) according to the
protocolssupplied by the manufacturer, and sent for direct sequencingto Macrogen Inc., Seoul,
South Korea. In the currentstudy, we used the ApoE4 genotype group (any E4 allele) comprising
participants carrying E4/E4 (n=6), E3/E4 (n=32) and E2/E4 (n=5). Indeed, one E4 copy (especially
E3/E4) increases risk for AD, while two E4 copies (E4/E4) increase risk considerably. (40, 41)
Statistics
Analysis of variance (ANOVA) was employed to assess differences in scale variables
among study groups (divided according to the median-split method applied on the total CERAD
score). Analysis of contingence tables (Χ2-tests) was used to assess associations between categorical
variables among the study groups. Correlations between scale variables were computed using
Pearson’s product moment correlation coefficients or Spearman’s rank order correlation
coefficients. Hierarchical binary logistic regression analysis was used to assess the significant
explanatory variables (biomarkers, age, sex and education) which predict the study sample with
lowered total CERAD scores. Odds ratios and upper-lower 95% confidence intervals were
computed and we employed Nagelkerke values as an estimate ofthe effect size. Hierarchical
multiple regression analysis was employed to delineate the most significant predictors (biomarkers
combined with age, sex and education) of the total CERAD score and VFT, WLM, WLRecall and
WLRecognition scores. All regression analyses were checked for multicollinearity. The results of
the statistical analyses were bootstrapped (1000 bootstraps) and bootstrapped results are reported
in case they show a different outcome. Principal component analysis (PCA) was used to extract the
first PC from memory tests and the PC score was used in subsequent analyses. Tests were two
-tailed and a p-value of 0.05 was used for statistical significance.
We used multilayer perceptron (MLP) Neural Network (NN) analyses (SPSS 25) to
investigate the complex (non-linear) associations between the CERAD tests scores (output
variables) and peripheral blood biomarkers, APOE4, age, sex and education (input variables) in
automated feedforward architecture models. We trained the network employing one or two hidden
layers with a variable number of nodes (up to 10) and used batch and minibatch (gradient descent
estimate the network parameters), 20.0% to the testing set (to prevent overtraining) and 33.33% to the
holdout set (to evaluate the final network). As stopping rule, we used one consecutive step with no
further decrease in the error term. We also computed error, relative error and importance of each
of the input variables in sensitivity analyses. All statistical analyses were performed using IBM
SPSS windows version 25.
Results
Socio-demographic and clinical data
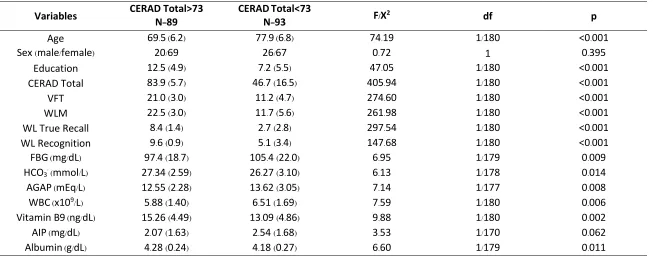
Table 1 shows the socio-demographic data in both subjects with lower versus higher
CERAD scores (divided according to the median split method). Subjects with lower CERAD scores
hadhigher age, less education, and lower scores on the total CERAD, VFT, WLM, WL Recall and
WL recognition than those with a CERAD score > 73. Subjects with a CERAD score < 73 had
higher glucose, WBC numbers, AGAP, and AIP index than those with a higher CERAD score,
while HCO3- and folic acid were significantly lowered.
Inspection of the intercorrelation matrices shows that age is associated with CERAD
subdomain scores and with most biomarker data, namely VFT (r=-0.462, p<0.001, n=182), WLM
(r=-0.520, p<0.001, n=182), WLRecall (r=-0.511, p<0.001, n=182) and WLrecognition (r=--0.406, p<0.001, n=182), glucose (r=194, p=0.009, n=182), albumin (r=0.359, p<0.001, n=181), HCO3- (r =-0.159, p=0.033, n=180), AIP (r=0.186, p=0.015, n=172), folic acid (r=-0.269, p<0.001, n=182) and WBC count (r=0.207, p=0.005, n=182), but not AGAP (r=0.123, p=0.101, n=179).
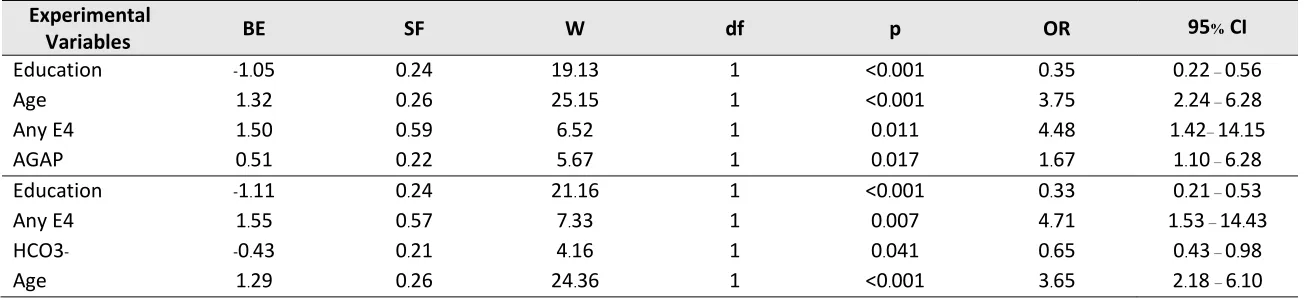
Results of logistic regression analysis
Table 2 shows the results of logistic regression analysis with the group with a CERAD
score <73 as dependent variables (and those with higher levels as reference group). The first
regression shows that education (inversely) and age, any E4 and AGAP significantly predict
membership to the lower CERAD group (ꭓ2=89.76, df=4, p<0.001, Nagelkerke=0.557); 83.1% of all
cases were correctly classified with a sensitivity of 79.3% and a specificity of 86.9%. The second
regression shows that education and HCO3- (both inversely) and any E4 and age (both positively)
predict membership to the lower CERAD group (ꭓ2=93.65, df=4, p<0.001, Nagelkerke=0.562);81.3%
of all cases were correctly classified with a sensitivity of 78.2% and a specificity of 84.5%.
Predicting neurocognitive test results in the whole sample
Table 3 shows the prediction of the total CERAD score and the different subdomains using
the biomarkers in addition to ApoE4, age, education and sex. Firstly (results shown in table 3), we
will describe the results of multiple regression analyses with the CERAD tests as dependent variables and AopE4 and the biomarkers as primary explanatory variables, while adjusting for sex
and education. Age was not entered as a covariate in order to allow age-dependent biomarkers
(including glucose, folic acid, AIP, glucose) to predict the cognitive test results without interference
with age. Subsequently, we will describe the results of a second regression analysis with age as an
Table 1. Demographic and clinical data of patients with a low total CERAD (<73) versus a higher CERAD score.
CERAD: The Consortium to Establish a Registry for Alzheimer’s Disease VFT: Verbal Fluency Test
WLM: Word List Memory FBG: Fasting blood glucose HCO3-: Bicarbonate AGAP: Anion GAP WBC: White blood cells
AIP: Atherogenic index of plasma
Variables CERAD Total>73 N=89 CERADN=Total<73 93 F/X2 df p
Age 69.5 (6.2) 77.9 (6.8) 74.19 1/180 <0.001
Sex (male/female) 20/69 26/67 0.72 1 0.395
Education 12.5 (4.9) 7.2 (5.5) 47.05 1/180 <0.001
CERAD Total 83.9 (5.7) 46.7 (16.5) 405.94 1/180 <0.001
VFT 21.0 (3.0) 11.2 (4.7) 274.60 1/180 <0.001
WLM 22.5 (3.0) 11.7 (5.6) 261.98 1/180 <0.001
WL True Recall 8.4 (1.4) 2.7 (2.8) 297.54 1/180 <0.001 WL Recognition 9.6 (0.9) 5.1 (3.4) 147.68 1/180 <0.001 FBG (mg/dL) 97.4 (18.7) 105.4 (22.0) 6.95 1/179 0.009 HCO3- (mmol/L) 27.34 (2.59) 26.27 (3.10) 6.13 1/178 0.014
AGAP (mEq/L) 12.55 (2.28) 13.62 (3.05) 7.14 1/177 0.008 WBC (x109/L) 5.88 (1.40) 6.51 (1.69) 7.59 1/180 0.006
Table 2 Results of binary logistic regressionanalysis with the study sample characterized by a low total CERAD score (<73) as dependent variable.
Experimental
Variables BE SF W df p OR 95% CI
Education -1.05 0.24 19.13 1 <0.001 0.35 0.22 – 0.56
Age 1.32 0.26 25.15 1 <0.001 3.75 2.24 – 6.28
Any E4 1.50 0.59 6.52 1 0.011 4.48 1.42– 14.15
AGAP 0.51 0.22 5.67 1 0.017 1.67 1.10 – 6.28
Education -1.11 0.24 21.16 1 <0.001 0.33 0.21 – 0.53
Any E4 1.55 0.57 7.33 1 0.007 4.71 1.53 – 14.43
HCO3- -0.43 0.21 4.16 1 0.041 0.65 0.43 – 0.98
Age 1.29 0.26 24.36 1 <0.001 3.65 2.18 – 6.10
AGAP: Anion gap HCO3-: bicarbonate
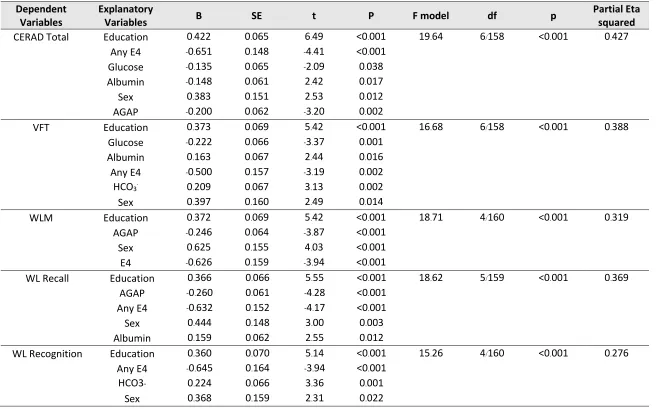
Table 3 Results of multiple regression analyseswith the total CERAD score, the Verbal Fluency Test (VFT) score,Wordlist memory (WLM) score and scores on the WL Recall and WL Recognition as dependent variables.
Dependent
Variables Explanatory Variables B SE t P F model df p Partial Eta squared
CERAD Total Education 0.422 0.065 6.49 <0.001 19.64 6/158 <0.001 0.427 Any E4 -0.651 0.148 -4.41 <0.001
Glucose -0.135 0.065 -2.09 0.038 Albumin -0.148 0.061 2.42 0.017 Sex 0.383 0.151 2.53 0.012 AGAP -0.200 0.062 -3.20 0.002
VFT Education 0.373 0.069 5.42 <0.001 16.68 6/158 <0.001 0.388 Glucose -0.222 0.066 -3.37 0.001
Albumin 0.163 0.067 2.44 0.016 Any E4 -0.500 0.157 -3.19 0.002 HCO3- 0.209 0.067 3.13 0.002
Sex 0.397 0.160 2.49 0.014
WLM Education 0.372 0.069 5.42 <0.001 18.71 4/160 <0.001 0.319 AGAP -0.246 0.064 -3.87 <0.001
Sex 0.625 0.155 4.03 <0.001 E4 -0.626 0.159 -3.94 <0.001
WL Recall Education 0.366 0.066 5.55 <0.001 18.62 5/159 <0.001 0.369 AGAP -0.260 0.061 -4.28 <0.001
Any E4 -0.632 0.152 -4.17 <0.001 Sex 0.444 0.148 3.00 0.003 Albumin 0.159 0.062 2.55 0.012
WL Recognition Education 0.360 0.070 5.14 <0.001 15.26 4/160 <0.001 0.276 Any E4 -0.645 0.164 -3.94 <0.001
HCO3- 0.224 0.066 3.36 0.001 Sex 0.368 0.159 2.31 0.022 AGAP: anion gap
The first regression in Table 3 shows that 42.7% of the variance in the total CERAD score
was explained by the regression on ApoE4, glucose and AGAP (all inversely) and education and
sex (positively). Introduction of age shows that glucose and albumin were no longer significant and
that age, education, ApoE4, AGAP and sex significantly predicted 46.8% of the variance in the total
CERAD score (F=32.27, df=5/173, p<0.001). AGAP remained highly significant (t=-3.43, p=0.001).
The second regression shows that 38.8% of the variance in VFT scores was explained by
education, albumin, HCO3- and sex (all positively) and glucose and any E4 (inversely). Introduction
of age shows that albumin was no longer significant and that 40.3% of the variance in VFT was
explained by the regression on age, education, AopE4, sex, glucose and AGAP (F=19.34, df=6/172,
p<0.001) and that HCO3- (t=2.79, p=0.006) and glucose (t=-2.69, p=0.008) remained significant.
We found that 31.9% of the variance in the WLM score was predicted by education and sex
(both positively) and AGAP and ApoE4 (both negatively). Entry of age shows that age, education,
ApoE4, sex and AGAP together explain 42.0% of the variance in WLM and that the effect of AGAP
remained significant (t=-3.22, p=0.002).
Up to 36.9% of the variance in WLRecall was explained by the regression on education, sex
and albumin (all positively) and AGAP and ApoE4 (both inversely). After introducing the effects of
age,we found that age, education, ApoE4, sex and AGAP explained a large part of the variance in
WLRecall (43.2%, F=26.34, df=5/173, p<0.001) and that AGAP remained significant (t=-3.68,
p<0.001).
The last regression in table 3 shows that 27.6% of the variance in WLRecognition was
explained by education, HCO3- and sex (all positively) and ApoE4 (inversely). After introducing
age in this regression, we found that sex was no longer significant and that 30.9% of the variance
in WLRecognition was explained by the regression on age, education, ApoE4 and HCO3- (F=19.56,
df=4/175, p<0.001) and that HCO3- had a significant effect (t=2.65, p=0.009).
Are there any moderator effects of ApoE4?
Consequently, we have examined whether ApoE4 yields significant moderator effects in
predicting the different CERAD tests. Towards this end we used univariate regression analyses to
examine the interaction effects EpoE4 with the most important biomarkers established in table 3,
namely AGAP (or HCO3-), glucose and albumin. We could not find any moderator effects of
ApoE4 with these biomarkers on total CERAD score and VFT. The first regression in Table 4
shows that an interaction between ApoE4 and glucose was a significant predictor of WLMshowing
that, in the presence of ApoE4, glucose has a significant negative effect on WLM. The second
regression in Table 4 shows that WLRecall is significantly predicted by the interaction between
no-APOE4 X albumin, indicating that when ApoE4 is not present, lowered levels of albumin are
associated with lower WLRecall. The last regression in Table 4 shows that an interaction between
AopE4 X AGAP significantly predicted WLRecognition, indicating that in the presence of ApoE4,
Table 4. Results of univariate GLM analysis with Wordlist memory (WLM) score and scores on the WL Recall and WL Recognition as dependent variables.
Dependent Variables
Explanatory
Variables B SE t p
F
model df p
Partial Eta squared WLM Age -0.331 0.064 -5.14 <0.001 17.99 7/165 <0.001 0.433
Education 0.248 0.065 3.80 <0.001 Any E4 0.490 0.143 3.42 0.001
Sex -0.435 0.152 -2.86 0.005 Glucose -0.11 0.072 -0.15 0.877 E4 * glucose -0.306 0.142 -2.15 0.033 AGAP -0.179 0.062 -2.87 0.005
WLRecall Age -0.293 0.067 -4.39 <0.001 18.51 7/195 <0.001 0.440 Education 0.288 0.065 4.46 <0.001
Any E4 -0.553 0.141 -3.91 <0.001 Sex -0.300 0.144 -2.08 0.039 Albumin 0.142 0.071 1.99 0.048
NoE4 *
Albumin 0.324 0.139 2.33 0.021 AGAP -0.212 0.059 -3.59 <0.001 WL
Recogntion Age -0.261 0.067 -3.91 <0.001 17.90 5/169 <0.001 0.346 Education 0.219 0.065 3.35 0.001
Any E4 -0.608 0.150 -4.05 <0.001 AGAP -0.085 0.072 -1.18 0.239 E4 * AGAP -0.392 0.144 -2.72 0.007 AGAP: anion GAP
E4: any ApoE4
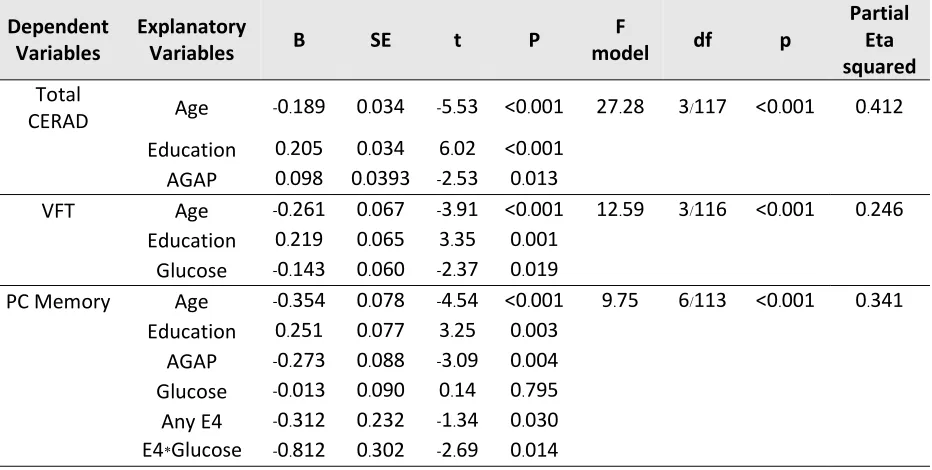
Associations between neurocognitive tests in aMCI
In order to examine the associations between neurocognitive tests and biomarkers in aMCI
we have carried out extra analyses in the subgroup of aMCI patients and controls. The first
regression in Table 5 shows that 41.2% of the variance in the total CERAD score was explained by
age, education and AGAP. Also, 24.6% of the variance in VFT was predicted by age, education and
glucose levels. In order to examine the association with episodic memory we have used the first
principal component (PC) extracted from the three episodic memory tests (namely WLM,
WLRecall and WLRecognition). This first PC explained 90.7% of the variance and all three test
values loaded highly on this first PC (all > 0.938). Table 3 shows that 34.1% of the variance in this
first PC extracted from the three memory tests was predicted by education (positively) and age,
AGAP, glucose and the interaction ApoE4 X glucose. This interaction shows that when ApoE4 is
Table 5. Results of multiple regression analysis performed in the study groups of amnestic mild cognitive impairment and healthy controls with the total CERAD score, the Verbal Fluency Test (VFT) score and the first principal component extracted from the memory test scores (PC Memory) as dependent variables.
Dependent
Variables Explanatory Variables B SE t P model F df p
Partial Eta squared Total
CERAD Age -0.189 0.034 -5.53 <0.001 27.28 3/117 <0.001 0.412 Education 0.205 0.034 6.02 <0.001
AGAP 0.098 0.0393 -2.53 0.013
VFT Age -0.261 0.067 -3.91 <0.001 12.59 3/116 <0.001 0.246 Education 0.219 0.065 3.35 0.001
Glucose -0.143 0.060 -2.37 0.019
PC Memory Age -0.354 0.078 -4.54 <0.001 9.75 6/113 <0.001 0.341 Education 0.251 0.077 3.25 0.003
AGAP -0.273 0.088 -3.09 0.004 Glucose -0.013 0.090 0.14 0.795 Any E4 -0.312 0.232 -1.34 0.030 E4*Glucose -0.812 0.302 -2.69 0.014
AGAP: anion gap.
E4 * Glucose: interaction between ApoE4 and glucose levels
PC memory: first principal component extracted from Word List Memory, Word List True Recall and Word List Recognition
Results of neural networks
Neural Network models were used to predict the total CERAD score (model 1), VFT score
(model 2) and the first PC extracted from the 3 episodic memory tests (model 3) (output variables)
using all biomarkers (including any ApoE4) and age, sex and education as input variables.
Automatic architecture training of the network delineated the best models. Table 6 shows the
model summary of the trained Neural Networks. The three models were trained with 1-2 hidden
layers with a variable number units in layer 1 (5-6) and layer 2 (4-5). The first layer used hyperbolic
tangent as activation function and the output layer either identity or hyperbolic tangent as
activation factor. In the three models, the sum of squares error term was minimized during the
training, indicating that the three models learnt to generalize from the trend. The relative error
terms in the training, testing and holdout samples were fairly constant, suggesting that the models
are not overtrained (overfitted). The Spearman correlation coefficientbetween the CERAD, VFT
Table 6. Results of neural networks showing network information, the model summary and the correlation coefficient between the CERAD test score and the model predicted values.
Network information Layers / errors Model 1: CERAD Model 2: VFT Model 3: Episodic
memory PC
Number units - 13 13 13
Hidden layers Number hidden layers 2 2 2
Number units in layer 1 6 5 5
Number units in layer 2 5 4 4
Activation function Hyperbolic tangent Hyperbolic tangent Hyperbolic tangent
Output layer Activation function Identity Identity Hyperbolic tangent
Model summaries
Training sample Sum of squares error 19.123 18.724 6.763
Relative error 0.425 0.499 0.525
Testing sample Sum of squares error 5.418 7.895 3.341
Relative error 0.361 0.545 0.516
Hold-out sample Relative error 0.589 0.609 0.776
Correlations With predicted value 0.739 (p<0.001) 0.679 (p<0.001) 0.641 (<0.001)
Model 1, 2 and 3: output variables were the total CERAD score, verbal fluence test (VFT) score and the first principal component extracted from the memory test scores (Word List Memory, Word List True Recall and Word List Recognition), respectively. All biomarkers, age, sex and
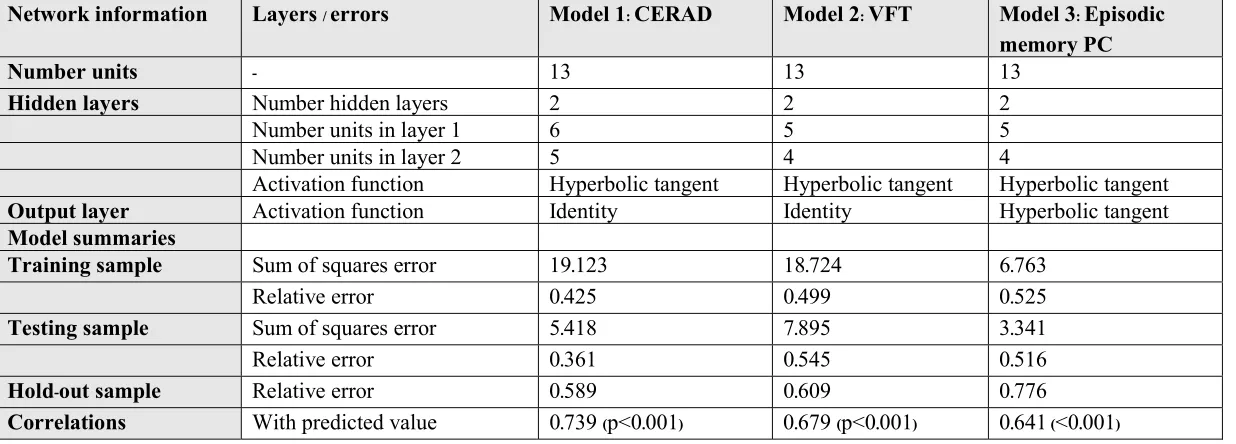
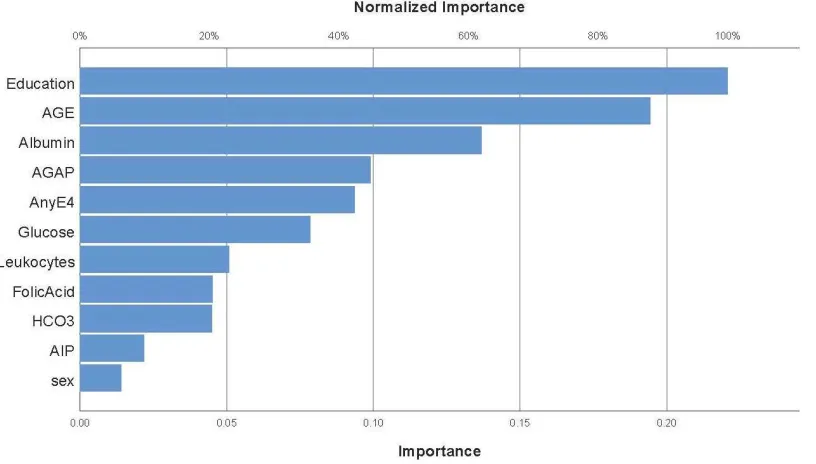
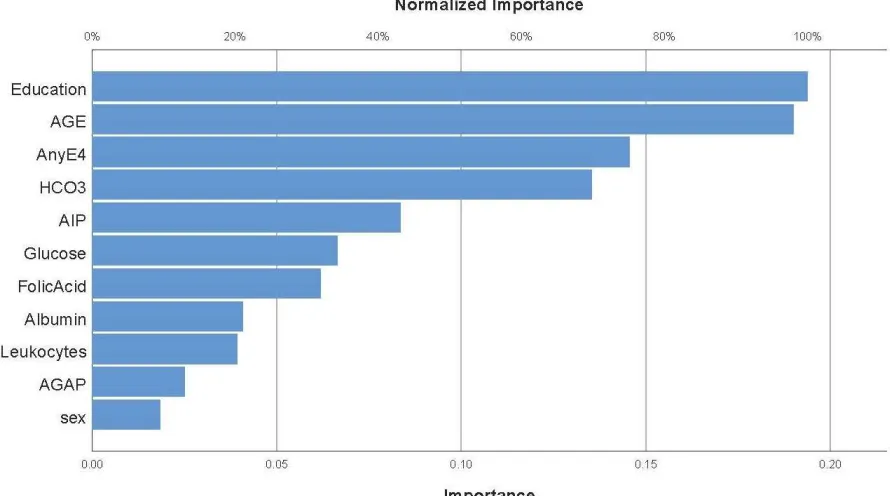
Figures1, 2 and 3 show the relevance chart displaying the importance and normalized
importances of the 11 input variables. Figure 1 shows that education and age were the most
important determinants of the predictive power of model 1 (prediction of total CERAD score),
followed at a distance by albumin, AGAP, AnyE4 and glucose. Figure 2 shows that education and
age were the most important determinants of the predictive power of model2 (prediction of the
VFT score), followed at a distance by AnyE4, HCO3-, and again at a distance by AIP, glucose and
folic acid. Figure 3 shows that education, AnyE4, AGAP and age were the most important
determinants of the predictive power of model 3 (prediction of the memory PC score), followed at
a distance by albumin and glucose.
Figure 1. Results of neural network (relevance chart) with the total CERAD score as output variable.
Education and age were the most important determinants of the predictive power of this model
(prediction of total CERAD score), followed at a distance by albumin, anion GAP (AGAP), anyE4
and glucose. Number of leukocytes, folic acid levels, bicarbonate (HCO3), atherogenic index of
Figures2.Results of neural network (relevance chart) with Verbal Fluency score as output variable. Education and age were the most important determinants of the predictive power of this model,
followed at a distance by anyE4 andbicarbonate (HCO3) and again at a distance by the atherogenic
index of plasma (AIP), glucose and folic acid, while albumin, number of leukocytes, anion GAP
(AGAP) and sex were not significant.
Figure 3. Results of neural network (relevance chart) with the first principal component extracted
Education, anyE4, anion GAP (AGAP) and age were the most important determinants of the
predictive power of this model, followed at a distance by albumin and glucose. Number of
leukocytes, folic acid, sex, the atherogenic index of plasma and bicorbonate (HCO3) were not
important.
Discussion
The major finding of the study is that impairmentsin semantic and episodic memory (as
measured with the CERAD-NP battery) are significantly predicted by blood biomarkers including
anion gap and bicarbonate, albumin,glucose levels and Apo E4. There is now evidence that ApoE4
interferes with cognitive functions, including executive abilities and episodic memory. (42) For
example, ApoE4 carriers and especially E4/E4 homozygotes show lowered levels on total CERAD
score, VFT, WLM, WL recall and WL Reognition, indicating that ApoE4 has a strong impact on
semantic and episodic memory scores. (12) During the normal ageing process, the presence of
ApoE4 is associated with neurocognitive declines in episodic, working, and semantic memory. (43
-46) Moreover, ApoE4 carriers show a higher risk to develop AD because ApoE4 promotes memory
deficits through effects on brain neural networks. (47) The latter effects are probably related to
increasedcerebral amyloid angiopathy, lower clearance of amyloid-β (Aβ) peptide thereby causing
Aβ excess, higher lipid levels, increased oxidative stress as well asa pro-inflammatory state. (48,
49) (50-52)
However, not all people who carry ApoE4 alleles and not all E4/E4 homozygotes develop
AD, (53) indicating that ApoE4 mayinteractwith other biomarkers or pathways to increase the risk
forAD. In this respect, we found that combiningApoE4 withanion gap or bicarbonate levels,
glucose or albumin levels (indicating peripheral inflammation) improved the prediction of CERAD,
VFT and episodic memory scores. Our findings suggest that these peripheral biomarkers could
interact with ApoE4-relatedpathways to promotegreater deficits in semantic and episodic memory,
and that those interaction enhanced the prediction of those cognitive deficits in our sample
compared to ApoE4 alone.
Our results extend those of previous papers reporting that lowered bicarbonate levelsmay
be associated with lower performance on cognitive tests including cognitive or executive
impairments. (54, 55) For example, in a large cohort of individuals with hypertension, higher serum
bicarbonate levels were associated with better global cognitive and executive functioning, but not
with memory.(54) The latter authors computed that a decrease of 1 mEq/L in bicarbonatehadthe
same impact on global cognitive functioning as being 4.3 months older. Lowered bicarbonate levels
are also associated with confusion, cognitive impairment and delirium. (56) Recent preclinical data
show that increasing bicarbonate concentrations stimulate the excitability of pyramidal neurons in
therodenthippocampus (57) providing further support for a putative role of acid-base homeostasis
as a regulator of central nervous system activity. (57) While increases in pH may increase neuronal
activity, a lowered pH may be accompanied by lowered neuronal activity and important mediators
of synaptic function and memory including glutamate receptors appear to bepH-dependent. (58) It
disease, multiple sclerosis and epilepsy. (59) An acidic environment may activate acid-sensing ion channels which may promote neuroinflammation, demyelination, axonal degeneration, endoplasmatic reticulum stress and oxidative pathways along with a diminishment of glutamate
uptake. (59) Those mechanisms in conjunction provide further support to the findings herein
reported. In this respect, our analysis not only showed cumulative effects of anion gap coupled
with ApoE4 inpredicting a decrease incognitive functions, but also a specific interaction pattern
between ApoE4 and anion gap in predicting lowered WL recognition test scores. In keeping with
this view, among ApoE4 carriers, a higher anion gap wasaccompanied by lowered recognition test
scores. These cumulative and interactive effects of ApoE4 and increased anion gap or lowered
bicarbonate levels may be mechanistically explained byan increased impact on, for example,pro
-inflammatory responses and oxidative stress pathways.
Previous research foundlowered plasma albumin together with increased IL-6 levels in AD
indicatinga peripheral immune-inflammatory response in those patients. (60, 61) IL-6 plays a role
in acute and chronic inflammatory responses and in the pathogenesis of neuroinflammatory
disorders including AD. (62) There is also some evidence that lowered albumin levels are associated
with cognitive impairments. For example, people with very low baseline albumin levelsexperience
an accelerated decline in MMSE scores over a 13-year follow-upcompared to those with higher
albumin levels. (63) Glucose plays a pivotal role as an energy source to the brain by enhancing
ATP biosynthesis (64) and many studies reported that glucose is associated with better outcomes
on neurocognitivetasks. (65, 66) On the other hand, in elderly people, glucose dysregulation is
associated with memory impairments, especially in episodic memory. (67, 68) Moreover, poorly
controlled diabetes is accompanied by memory impairments and executive dysfunctions, (31)
whilst in diabeticpatients, increased glucose peaks may be a risk factor for cognitive decline and
even dementia. (69) Other studies reported that blood glucose, insulin resistance and type 2 diabetes
mellitusare major factors contributing to an increased risk of AD. (64, 70) Blood glucose crosses
the blood-brain-barrier and may bedetrimental to brain function through several mechanisms,
includingimpaired radical scavengingand glutathione cycle dysfunctions, free radical generation,
aberrant osmolality in brain cells and increased synthesis of advanced glycation end-products. (71)
Moreover, glucose fluctuations induce glial toxicity with the generation of glutamatergic oxidative
products and may also lead to inflammation, neurotoxicity and neuronal cell death (72, 73).
Importantly, we found that ApoE4 and glucose yielded cumulative effects in deteriorating semantic and episodic memory scores and that there was a specific interaction between both factors
in predicting episodic memory, indicating that amongApoE4 carriers, glucose appears to worsen
episodic memory scores. These cumulative and interactingeffects of both glucose and ApoE4 may
be explained by the impact of glucose in activating oxidative and inflammatory pathways
associated with ApoE4. Moreover, our findings suggestthat increased glucose and AGAP could
play a role in cognitive disorders, extending the research of Djelti et al., who found that fasting
blood glucose was closely linked tospatial memory performance as wellhippocampus or septum
volumes in grey mouse lemur. (74)
It is interesting to note that we found that ApoE4, increasing ageand disorders in anion
gap, albumin and glucose have cumulative effects thereby affecting semantic and episodic
by an interplay among Apo E4, anion gap, glucose and lower albumin. Firstly, this indicates that
an age-related mechanism other than that related to glucose and inflammation may be associated
with the development of cognitive deficits. One possibility is that age-associated increased levels
of eotaxin (CCL-11), which is an endogenous cognition deteriorating chemokine produced by
eosinophils, induce neurocognitive deficits in memory through lowered neurogenesis. (75)
Secondly, it is probable that in ApoE4 carriers, the central effects of glucose, anion gap and
inflammation interact with each other and additionally with the detrimental effects of ApoE4
thereby deteriorating the immune and oxidative stress pathophysiology underpinning cognitive
disorders.
In the present study we could not detect significant effects of folic acid on semantic and
episodic memory. Neverthless, in some studies, lower levels of folate were associated with
cognitive impairments, (76) while intake of folate in MCI and AD patients may improveWLM,
MMSE and Constructional Recall test scores, (77) Folate functions as a coenzyme in metabolic
pathways in DNA and S-adenosylmethionine (SAM) synthesis (78) and supports neuronal integrity.
(79) Chen et al. proposed that supplementing folic acid may improve AD by reducing inflammatory
reactions as measured with plasma amyloid beta (Aβ) and mRNA levels of presenilin-1 and tumor
necrosis factor α (TNFα). (80) Aprevious study found a significant association between AIP and
10T-BNT scores in the low frequency words category, (13) while in the current study no significant
associations between AIP and episodic or semantic memory scores could be established.
Cholesterol and lipids modulate amyloid precursor protein (APP) metabolism, whereby higher
cholesterol levels may attenuate APP levels. This reduction in APP metabolism may play a role in
nerve cell death and decreased resilience to injuries following attenuated neuroprotective activities
(81). It is not clear why lipid metabolism may affect naming but not fluency and recall.
Another major finding of this study is that in aMCIthe cumulative effects of AGAP,
glucose and ApoE4 were significantly associated with a decline in semantic and episodic memory
and that the latter was additionally associated with aninteraction between ApoE4 and glucose,
indicating that in ApoE4 carriers, glucose further deteriorates episodic memory. Thus, the memory
impairments of both AD and aMCI are associated with the same set of biomarkers and similar
interaction patterns. Therefore, we may hypothesize that these biomarkers in aMCI may perhaps
play a role in the transition from aMCI to AD and/or in shortening the time lag between the
diagnosis of aMCI and the onset of dementia. In this respect, Furney et al. reported that the
combination of pro-inflammatory cytokines and brain magnetic resonance imaging (MRI) measures
is more predictive of the transition from MCI to AD than the ApoE status or clinical data (82).
Therefore, future research should examine whether the peripheral biomarkers measured here may
predict the conversion from aMCI to AD. Some papers concluded that this conversion occurs
independently from the ApoE genotype and amyloid pathology (20) and that injury markers (CSF
t-tau and p-tau), but not amyloid biomarkers, are associated with rapid progression from MCI to
AD (83).
The results of the current study should be interpreted considering its limitations. First,
this study has a cross-sectional design, which does not allow the firm establishment of causal
inferences. Second, our statistical prediction of cognitive dysfunction could be incrementedby the
inclusion of other genes and pathways in the model. Third, confounding variables other than
age, sex and education, could have influenced our findings including life-style variables (e.g.
physical activity) and nutritional status. Fourth, in our study, biomarkers were assayed only once
andone-time increase in those biomarkers wouldnot likely explain the cognitive impairments
measured in our study. Nevertheless, given the magnitude of the effects herein described and the
knowledge that these biomarkers deteriorate with age (e.g. glucose, inflammation and serum
bicarbonate) (84-86) and have known pathophysiological effects (reviewed above), we may argue
that our findings could reflect (sub)chronicaberrations in these biomarkers. However, prospective
studies are needed with repeated measurements of those biomarkers to further elucidate the
relevance of our findings to theprogression of neurocognitive impairmentsand the conversion of
aMCI to AD.
Conclusions
The current study found that peripheral blood biomarkers, including anion gap, bicarbonate, albumin and glucose levels, coupled with ApoE4 significantly affected cognitive
functions including episodic and semantic memory among elderly with aMCI and AD.
Furthermore, these peripheral biomarkers interact with ApoE4 to promote greater memory
impairments, suggesting that those biomarkers could interact with the ApoE4-related pathways
thereby contributing to the pathophysiologyaMCI and AD. Our findings suggest that the transition
from aMCI to AD could at least in some cases be associated with significant interactions between
ApoE4 and those peripheral blood biomarkers. However, prospective studies are needed to
confirm/refute our findings.
Funding
The study was supported by Thai Government Fund GRB_APS_10_57_30_08
Acknowledgements
The authors would like to thank all participants and caregivers for their cooperation.
Disclosure Statement
The authors have no conflict of interest with any commercial or other association in connection
with the submitted article.
Author’s contributions
All the contributing authors have participated in the manuscript. TS, CT, ST and MM designed the
study. TS, CT, ST, DA, IT, SH and PC recruited patients and completed diagnostic interviews and
rating scale measurements. MM carried out the statistical analyses. All authors contributed to
interpretation of the data and writing of the manuscript. All authors approved the final version of
References
1. Burns A, Iliffe S. Alzheimer's disease. BMJ (Clinical research ed). 2009;338:b158.
2. World Health Organization: Dementia fact sheet World Health Organization; 2017
[Available from: http://www.who.int/en/news-room/fact-sheets/detail/dementia.
3. Diagnostic and statistical manual of mental disorders : DSM-5. American Psychiatric A,
American Psychiatric Association DSMTF, editors. Arlington, VA: American Psychiatric
Association; 2013.
4. Cerejeira J, Lagarto L, Mukaetova-Ladinska EB. Behavioral and psychological symptoms
of dementia. Frontiers in neurology. 2012;3:73.
5. Pérez Romero A, González Garrido S. The importance of behavioural and pyschological
symptoms in Alzheimer disease. Neurología (English Edition). 2018;33(6):378-84.
6. Selkoe DJ, Hardy J. The amyloid hypothesis of Alzheimer's disease at 25 years. EMBO
molecular medicine. 2016;8(6):595-608.
7. Takahashi RH, Nagao T, Gouras GK. Plaque formation and the intraneuronal accumulation
of beta-amyloid in Alzheimer's disease. Pathology international. 2017;67(4):185-93.
8. Kim J, Basak JM, Holtzman DM. The role of apolipoprotein E in Alzheimer's disease.
Neuron. 2009;63(3):287-303.
9. Kanekiyo T, Xu H, Bu G. ApoE and Aβ in Alzheimer's disease: accidental encounters or
partners? Neuron. 2014;81(4):740-54.
10. Brandon JA, Farmer BC, Williams HC, Johnson LA. APOE and Alzheimer’s Disease:
Neuroimaging of Metabolic and Cerebrovascular Dysfunction. 2018;10(180).
11. Farrer LA, Cupples LA, Haines JL, Hyman B, Kukull WA, Mayeux R, et al. Effects of age,
sex, and ethnicity on the association between apolipoprotein E genotype and Alzheimer disease. A
meta-analysis. APOE and Alzheimer Disease Meta Analysis Consortium. Jama. 1997;278(16):1349
-56.
12. Tangwongchai S, Supasitthumrong T, Hemrunroj S, Tunvirachaisakul C, Chuchuen P,
Houngngam N, et al. In Thai Nationals, the ApoE4 Allele Affects Multiple Domains of
Neuropsychological, Biobehavioral, and Social Functioning Thereby Contributing to Alzheimer's Disorder, while the ApoE3 Allele Protects Against Neuropsychiatric Symptoms and Psychosocial
Deficits. Molecular neurobiology. 2018;55(8):6449-62.
13. Aniwattanapong D, Tangwongchai S, Supasitthumrong T, Hemrunroj S, Tunvirachaisakul
C, Tawankanjanachot I, et al. Validation of the Thai version of the short Boston Naming Test (T
-BNT) in patients with Alzheimer's dementia and mild cognitive impairment: clinical and biomarker
correlates. Aging Ment Health. 2018:1-11.
14. Petersen RC. Mild cognitive impairment as a diagnostic entity. Journal of internal medicine.
2004;256(3):183-94.
15. Petersen RC, Caracciolo B, Brayne C, Gauthier S, Jelic V, Fratiglioni L. Mild cognitive
16. Neugroschl J, Wang S. Alzheimer’s Disease: Diagnosis and Treatment Across the Spectrum
of Disease Severity. The Mount Sinai Journal of Medicine, New York. 2011;78(4):596-612.
17. Tarawneh R, Holtzman DM. The clinical problem of symptomatic Alzheimer disease and
mild cognitive impairment. Cold Spring Harbor perspectives in medicine. 2012;2(5):a006148.
18. Jahn H. Memory loss in Alzheimer's disease. Dialogues in clinical neuroscience.
2013;15(4):445-54.
19. Jefferson AL, Beiser AS, Seshadri S, Wolf PA, Au R. APOE and mild cognitive
impairment: the Framingham Heart Study. Age and ageing. 2015;44(2):307-11.
20. Falahati F, Ferreira D, Muehlboeck JS, Eriksdotter M, Simmons A, Wahlund LO, et al.
Monitoring disease progression in mild cognitive impairment: Associations between atrophy
patterns, cognition, APOE and amyloid. NeuroImage : Clinical. 2017;16:418-28.
21. Morris GP, Clark IA, Vissel B. Inconsistencies and controversies surrounding the amyloid
hypothesis of Alzheimer's disease. Acta neuropathologica communications. 2014;2:135.
22. Lai KSP, Liu CS, Rau A, Lanctot KL, Kohler CA, Pakosh M, et al. Peripheral inflammatory
markers in Alzheimer's disease: a systematic review and meta-analysis of 175 studies. Journal of
neurology, neurosurgery, and psychiatry. 2017;88(10):876-82.
23. Morris G, Berk M, Maes M, Puri BK. Could Alzheimer's Disease Originate in the Periphery
and If So How So? Molecular neurobiology. 2018.
24. Neumann H, Daly MJ. Variant TREM2 as risk factor for Alzheimer's disease. The New
England journal of medicine. 2013;368(2):182-4.
25. Holmes C, Cunningham C, Zotova E, Woolford J, Dean C, Kerr S, et al. Systemic
inflammation and disease progression in Alzheimer disease. Neurology. 2009;73(10):768-74.
26. Holmes C, Cunningham C, Zotova E, Culliford D, Perry VH. Proinflammatory cytokines,
sickness behavior, and Alzheimer disease. Neurology. 2011;77(3):212-8.
27. Vasantharekha R, Priyanka HP, Swarnalingam T, Srinivasan AV, ThyagaRajan S.
Interrelationship between Mini-Mental State Examination scores and biochemical parameters in
patients with mild cognitive impairment and Alzheimer's disease. Geriatrics & gerontology
international. 2017;17(10):1737-45.
28. Tangney CC, Aggarwal NT, Li H, Wilson RS, Decarli C, Evans DA, et al. Vitamin B12,
cognition, and brain MRI measures: a cross-sectional examination. Neurology. 2011;77(13):1276
-82.
29. Faux NG, Ellis KA, Porter L, Fowler CJ, Laws SM, Martins RN, et al. Homocysteine,
vitamin B12, and folic acid levels in Alzheimer's disease, mild cognitive impairment, and healthy
elderly: baseline characteristics in subjects of the Australian Imaging Biomarker Lifestyle study.
Journal of Alzheimer's disease : JAD. 2011;27(4):909-22.
30. Mousavi M, Jonsson P, Antti H, Adolfsson R, Nordin A, Bergdahl J, et al. Serum
Metabolomic Biomarkers of Dementia. Dementia and Geriatric Cognitive Disorders Extra.