2343
THE IMPACT OF TRADITIONAL SOCIAL STRATIFICATION ON SELF ESTEEM OF STUDENTS
Nadir Jamil1 Zarqa Azhar2 Muhammad Nisar Bhatti3 Malik Muhammad Sohail4
ABSTRACT
The type and pattern of social stratification in a society greatly influences individual and group behavior. Most modern societies have class based stratification. However many features of traditional stratification may be observed in modem societies such as elements of caste system and feudalism. Self esteem is how we value ourselves it is how we perceive our value to the world and how valuable we think we are to others. Self esteem affects our trust in others, our relationships, our work nearly every part of our lives. Different researches show that most of the students experience low self esteem due to traditional background and low status. This research explores the impacts of traditional social stratification on self esteem on students of University of Sargodha. Quantitative approach has been used to find out the answer of questions and convenient sampling used to collect data.150 respondents had been taken in which 75 males and 75 female students. The data collection is thus analyzed using Statistical Package of Social Sciences (SPSS). Findings of this research indicate that the students who belong to low caste often feel lack of confidence and low level of self esteem.
Key Words: Social Stratifications, Self-Esteem, Students, Caste System. INTRODUCTION
Man has always preferred an unrestricted society where the entire human beings have equality but this noble ideal has never been fully achieved in recorded history and surely not in modern societies which are more worried about equality than any other societies (Varghese, 1993). Caste is
1 Scholar, Department of sociology, University of Sargodha, Sargodha, Pakistan.
2 Lecturer, Department of sociology, University of Sargodha, Sargodha, Pakistan.
3
Assistant Professor & Chairman, Department of Humanities and social sciences, National Textile University, Faisalabad,
Pakistan.
4
Lecturer, Department of Humanities and social sciences, National Textile University, Faisalabad, Pakistan.
International Journal of Asian Social Science
2344
one set of role cards and maybe the most important one. One’s caste is ascribed that is children inherit the status and purposes of their parents. This is strange to what many people in the United States judge about the good society. Our parents, relatives, teachers, and friends tell us in a thousand ways that what we make of our lives depends on our attempts and many of us assume all societies should play by the same rules or at least struggle to do so. But it is important to keep in mind that there is no society where individual effort is the single determine for status (Johnson, 2012). The largest part of modern societies has class based stratification. Other than with economic development class based stratification is becoming progressively more important. Social stratification has been revealed to cause much social harm. A comprehensive study of major world economies exposed that homicide, infant mortality, obesity, teenage pregnancies, emotional sadness, teen suicide, and prison population all associate with high social inequality (Varghese, 1993).
Talcott Parsons asserted that stability and social order are regulated, in part, by universal value although universal values were not identical with "consensus" but could as well be the movement for passionate conflict as it had been multiple times through history. The so-called conflict theories, such as Marxism, point to the inaccessibility of resources and lack of social mobility found in stratified societies (Saunders, 1990). Max Weber developed the three component theory of stratification and the concept of life chances. Weber supposed there were more class divisions than Marx suggested taking different concepts from both functionalist and Marxist theories to create his own system. He emphasized the difference between class, status, and power, and treated these as separate but related sources of power each with different effects on social action. Working at half a century later than Marx, Weber claimed there to be in fact four main classes the upper class, the white collar workers, the petite bourgeoisie, and the manual working class. Weber's theory more closely resembles modern Western class structures although economic status does not seem to depend strictly on earnings in the way Weber envisioned. Weber derived many of his key concepts on social stratification by examining the social structure of Germany. He noted that contrary to Marx's theories stratification was based on more than simply ownership of capital. Weber examined how many members of the aristocracy lacked economic wealth yet had strong political power. Many wealthy families lacked prestige and power, for example, because they were Jewish. Weber introduced three independent factors that form his theory of stratification hierarchy, which are; class, status, and power (Soviet Society, 2009).
2345
have high level of self esteem whereas people belong to low strata; class, caste and socioeconomic status often experience low level of self esteem. The traditional social stratification really influences student’s self esteem throughout their academic period (Johnson, 2012).
Studies reveal that deprived-caste students have unrealistic motivation, external locus for success, personal inadequacies for failures, harsh and rigid self-evaluation, and extreme anxiety for the outcome of personal performance. They exhibit avoidance behavior, lack the decision-making capacity, tend to have negative memories of past experiences, carry a very low self-concept, and need social approval. Success is not that reinforcing as it should be, and failure is extremely discouraging. They experience the fear of failure because of internalization of personal inadequacies, negative memories, and low perception of self, and heightened social anxiety. The entire mechanism is motivationally damaging and that is why deprived caste students account for the largest population of failures in examinations and drop outs from educational institutions. Students are growing trees of country’s meadows and self esteem is to fertilize them. However, exploitation by traditional social stratification is to spark zigzag growth. Therefore, a study is to elaborate the pros and cons of this ongoing system were necessary. So that study would meet the need of research purposes that the impact of social stratification on self esteem of students.
Objectives of the study
To check the impact of traditional social stratification on social needs of students.
To explore that how traditional social stratification demising the capabilities of students.
To see influence of power on self esteem of students.
METHODOLOGY
2346
Conceptual framework
Data analysis
Table-1. Indexation
Variable No. of items in Matrix Question
No. of categories in Index variable
Min. Score Max. Score
Mean Score
SD Alpha
value
Self esteem 8 5 23 39 31.21 3.38 .7471
Caste 11 5 22 53 39.13 5.28 .7041
Power 10 5 30 39 39.30 4.15 .7560
Independent variables
Social stratification Caste
Power
Gender Age Education
Income Family structure
Self esteem of students
Background
variables
2347
Results and Discussions
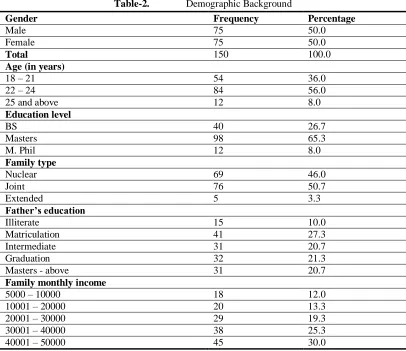
Table-2. Demographic Background
Gender Frequency Percentage
Male 75 50.0
Female 75 50.0
Total 150 100.0
Age (in years)
18 – 21 54 36.0
22 – 24 84 56.0
25 and above 12 8.0
Education level
BS 40 26.7
Masters 98 65.3
M. Phil 12 8.0
Family type
Nuclear 69 46.0
Joint 76 50.7
Extended 5 3.3
Father’s education
Illiterate 15 10.0
Matriculation 41 27.3
Intermediate 31 20.7
Graduation 32 21.3
Masters - above 31 20.7
Family monthly income
5000 – 10000 18 12.0
10001 – 20000 20 13.3
20001 – 30000 29 19.3
30001 – 40000 38 25.3
40001 – 50000 45 30.0
2348
presents the monthly income for the respondents from all sources. Only 12.0 percent of the respondents had Rs. 5000-10000 monthly income, 13.3 percent of them had Rs. 10001-20000 and 19.3 percent of them had Rs. 20001-30000 monthly income from all sources. About one-fourth i.e. 25.3 percent of the respondents had 30001-40000 and most of them i.e. 30.0 percent had Rs. 40001-50000 monthly income from all sources. These findings shows that majority of the respondents had sound economic status.
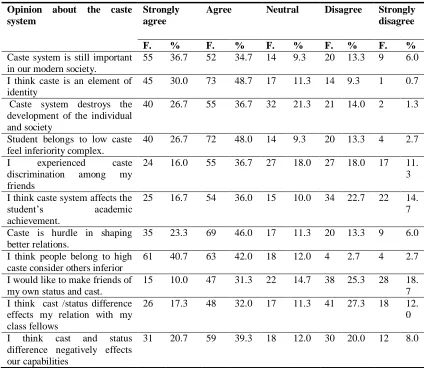
Table-3. Distribution of the respondents according to their opinion about the caste system
Opinion about the caste system
Strongly agree
Agree Neutral Disagree Strongly
disagree
F. % F. % F. % F. % F. %
Caste system is still important in our modern society.
55 36.7 52 34.7 14 9.3 20 13.3 9 6.0
I think caste is an element of identity
45 30.0 73 48.7 17 11.3 14 9.3 1 0.7
Caste system destroys the development of the individual and society
40 26.7 55 36.7 32 21.3 21 14.0 2 1.3
Student belongs to low caste feel inferiority complex.
40 26.7 72 48.0 14 9.3 20 13.3 4 2.7
I experienced caste
discrimination among my friends
24 16.0 55 36.7 27 18.0 27 18.0 17 11.
3 I think caste system affects the
student’s academic
achievement.
25 16.7 54 36.0 15 10.0 34 22.7 22 14.
7 Caste is hurdle in shaping
better relations.
35 23.3 69 46.0 17 11.3 20 13.3 9 6.0
I think people belong to high caste consider others inferior
61 40.7 63 42.0 18 12.0 4 2.7 4 2.7
I would like to make friends of my own status and cast.
15 10.0 47 31.3 22 14.7 38 25.3 28 18.
7 I think cast /status difference
effects my relation with my class fellows
26 17.3 48 32.0 17 11.3 41 27.3 18 12.
0 I think cast and status
difference negatively effects our capabilities
31 20.7 59 39.3 18 12.0 30 20.0 12 8.0
2349
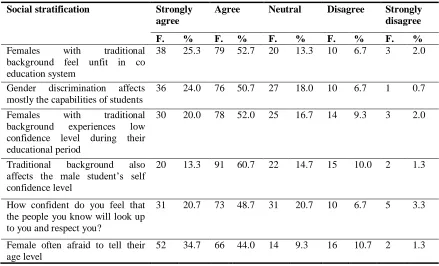
2350 Table-4. Distribution of the respondents according to their opinion about the social stratification
Social stratification Strongly
agree
Agree Neutral Disagree Strongly
disagree
F. % F. % F. % F. % F. %
Females with traditional
background feel unfit in co education system
38 25.3 79 52.7 20 13.3 10 6.7 3 2.0
Gender discrimination affects mostly the capabilities of students
36 24.0 76 50.7 27 18.0 10 6.7 1 0.7
Females with traditional
background experiences low confidence level during their educational period
30 20.0 78 52.0 25 16.7 14 9.3 3 2.0
Traditional background also affects the male student’s self confidence level
20 13.3 91 60.7 22 14.7 15 10.0 2 1.3
How confident do you feel that the people you know will look up to you and respect you?
31 20.7 73 48.7 31 20.7 10 6.7 5 3.3
Female often afraid to tell their age level
52 34.7 66 44.0 14 9.3 16 10.7 2 1.3
2351
with the statement “female often afraid to tell their age level”. It’s clear from the above discussion majority of the respondents had thinking that the female often afraid to tell their age level.
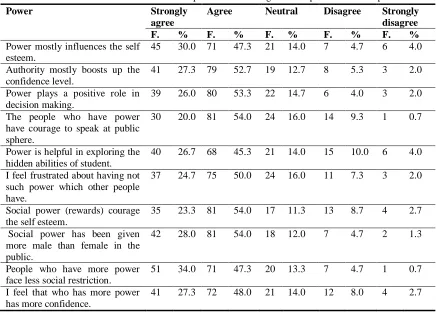
Table-5. Distribution of the respondents according to their opinion about the power
Power Strongly
agree
Agree Neutral Disagree Strongly
disagree
F. % F. % F. % F. % F. %
Power mostly influences the self esteem.
45 30.0 71 47.3 21 14.0 7 4.7 6 4.0
Authority mostly boosts up the confidence level.
41 27.3 79 52.7 19 12.7 8 5.3 3 2.0
Power plays a positive role in decision making.
39 26.0 80 53.3 22 14.7 6 4.0 3 2.0
The people who have power have courage to speak at public sphere.
30 20.0 81 54.0 24 16.0 14 9.3 1 0.7
Power is helpful in exploring the hidden abilities of student.
40 26.7 68 45.3 21 14.0 15 10.0 6 4.0
I feel frustrated about having not such power which other people have.
37 24.7 75 50.0 24 16.0 11 7.3 3 2.0
Social power (rewards) courage the self esteem.
35 23.3 81 54.0 17 11.3 13 8.7 4 2.7
Social power has been given more male than female in the public.
42 28.0 81 54.0 18 12.0 7 4.7 2 1.3
People who have more power face less social restriction.
51 34.0 71 47.3 20 13.3 7 4.7 1 0.7
I feel that who has more power has more confidence.
41 27.3 72 48.0 21 14.0 12 8.0 4 2.7
2352
respondents were strongly agreed and a major proportion i.e. 45.3 percent of them were agreed with the statement “Power is helpful in exploring the hidden abilities of student”, while 14.0 percent of them were neutral, 10.0 percent of them were disagreed and only 4.0 percent of them were strongly disagreed with this statement. So power is helpful in exploring the hidden abilities of students. Little less than one-fourth i.e. 23.3 percent of the respondents were strongly agreed and a majority i.e. 54.0 percent of them were agreed with the statement “Social power (rewards) courage the self esteem”, while 11.3 percent of them were neutral, 8.7 percent of them were disagreed and just 2.7 percent of them were strongly disagreed with this statement. So these findings depicts that a vast majority of the respondents had opinion that the social power (rewards) courage the self esteem. Gray’s (1994) study supported that the approach system involves appetitive processes associated with goal attainment, positive effect, and increased sensitivity to rewards. Decreased power means lack of resources and subjection to social constraints, thereby activating a general inhibition system. The inhibition system involves avoidance or response inhibition tendencies associated with negative effect, as well as heightened vigilance and inspection of punishments. About 28.0 percent of the respondents were strongly agreed and a majority i.e. 54.0 percent of them was agreed with the statement “Social power has been given more male than female in the public”. About one-third i.e. 34.0 percent of the respondents were strongly agreed and a major proportion i.e. 47.3 percent of them were agreed with the statement “People who have more power face less social restriction”, while 13.3 percent of them were neutral, 4.7 percent of them were disagreed and 0.7 percent of them were strongly disagreed with this statement. Gray (1994) supports these findings and says that hypothesis can be derived from the approach inhibition theory of power which assumes that high power means access to resources (both material and psychological) as well as lack of social and normative constraints, and thereby activates a general approach system. More than one-fourth i.e. 27.3 percent of the respondents were strongly agreed and little less than a half i.e. 48.0 percent of them were agreed with the statement “I feel that who has more power has more confidence”, while 14.0 percent of them were neutral, 8.0 percent of them were disagreed and 2.7 percent of them were strongly disagreed with this statement. Gray (1994) also supported these results that power increases self esteem, while lowered power leads to decreases in self esteem.
Table-6. Distribution of the respondents according to their opinion about self esteem
Self esteem Strongly
agree
Agree Neutral Disagree Strongly
disagree
F. % F. % F. % F. % F. %
Self confident student present their presentation very well.
59 39.3 69 46.0 16 10.7 4 2.7 2 1.3
Self motivated people mostly succeed in their life
42 28.0 78 52.0 21 14.0 9 6.0 0 0.0
Self confident student interact with their peer group/teachers comfortably
54 36.0 63 42.0 24 16.0 8 5.3 1 0.7
Low self esteem caused mostly the low academic achievement.
39 26.0 68 45.3 24 16.0 13 8.7 6 4.0
2353
phenomenon
Self esteemed students mostly take part in debates.
32 21.3 77 51.3 27 18.0 11 7.3 3 2.0
Social restrictions disturbed the self esteem of students
31 20.7 78 52.0 24 16.0 14 9.3 3 2.0
I feel confident when somebody look up to me and respect me
31 20.7 75 50.0 23 15.3 17 11.
3
4 2.7
Table 6 present the respondents’ opinion about the self esteem. About 39.3 percent of the respondents were strongly agreed and a major proportion i.e. 46.0 percent of them were agreed with the statement “Self confident student present their presentation very well”, while 16.0 percent of them were neutral, 2.7 percent of them were disagreed and only 1.3 percent of them were strongly disagreed with this statement. So majority of them felt that the power mostly influences the self esteem. So self-confident student present their presentation very well. Eccles et al. (1984) consistently support the present notion and further say that self efficacy beliefs are a necessary component of an individual’s achievement and success in learning skills; improving skills and competing at higher skill levels. About 28.0 percent of the respondents were strongly agreed and a majority i.e. 52.0 percent of them was agreed with the statement “Self motivated people mostly succeed in their life. More than one-third i.e. 36.0 percent of the respondents were strongly agreed and a major proportion i.e. 42.0 percent of them were agreed with the statement “Self confident student interact with their peer group/teachers comfortably. More than one-fourth i.e. 26.0 percent of the respondents were strongly agreed and a major proportion i.e. 45.3 percent of them were agreed with the statement “Low self esteem caused mostly the low academic achievement. About 19.3 percent of the respondents were strongly agreed and more than a half i.e. 52.0 percent of them were agreed with the statement “I think self esteem is a natural phenomenon”, while 17.3 percent of them were neutral, 6.7 percent of them were disagreed and 2.0 percent of them were strongly disagreed with this statement. It is clear from the above results a large majority of the respondents had thinking that the self esteem is a natural phenomenon.
2354
About one-fifth i.e. 20.7 percent of the respondents were strongly agreed and about a half i.e. 50.0 percent of them were agreed with the statement “I feel confident when somebody look up to me and respect me”, while 15.3 percent of them were neutral, 11.3 percent of them were disagreed and 2.7 percent of them were strongly disagreed with this statement. So a vast majority of the respondents felt that they confident when somebody looks up to them and respect them.
Testing Of Hypotheses
Hypothesis 1: Low caste negatively affects the self esteem of students.
Table-7. Association between believe on caste system of the respondents and their self esteem
Believe on caste system Self Esteem Total
Low Medium High
Low 4 10 6 20
20.0% 50.0% 30.0% 100.0%
Medium 29 46 15 90
32.2% 51.1% 16.7% 100.0%
High 3 18 19 40
7.5% 45.0% 47.5% 100.0%
Total 36 74 40 150
24.0% 49.3% 26.7% 100.0%
Chi-square = 17.38 d.f. = 4 Significance = .002** Gamma = .330
** = Highly Significant
Table 7 presents the association between believe on caste system of the respondents and their self esteem. Chi-square value shows a highly-significant association between believe of caste system of the respondents and self esteem. Gamma value shows a positive relationship between the variables. It means if the respondents had more believe on caste system then they have more self esteem. Above table also shows that if the respondents had low believe on caste system then they had low (20.0%), medium (50.0%) and high (30.0%) self esteem, on the other hand if the respondents had high believe on caste system then they had low (7.5%), medium (45.0%) and high (47.5%) self esteem. So the hypothesis “Low caste negatively affects the self esteem of students” is accepted.
Hypothesis 2: Social class influence the self esteem of students
Table-8. Association between social class of the respondents and their self esteem
Social class Self Esteem Total
Low Medium High
Low 9 11 5 25
36.0% 44.0% 20.0% 100.0%
Medium 24 57 19 100
24.0% 57.0% 19.0% 100.0%
High 3 6 16 25
12.0% 24.0% 64.0% 100.0%
Total 36 74 40 150
24.0% 49.3% 26.7% 100.0%
Chi-square = 25.48 d.f. = 4 Significance = .000** Gamma = .537
2355
Table 8 presents the association between social class of the respondents and their self esteem. Chi-square value shows a highly-significant association between social class of the respondents and self esteem. Gamma value shows a strong positive relationship between the variables. It means if the respondents had high social class then they have more self esteem. Above table also shows that majority of the respondents of low social class category had low to medium level self esteem, on the other hand if the respondents had high social class then majority (64.0%) of them had high social class. So the hypothesis “Social class influence the self esteem of students” is accepted
Hypothesis 3: It is more likely that self esteem of students affected by power.
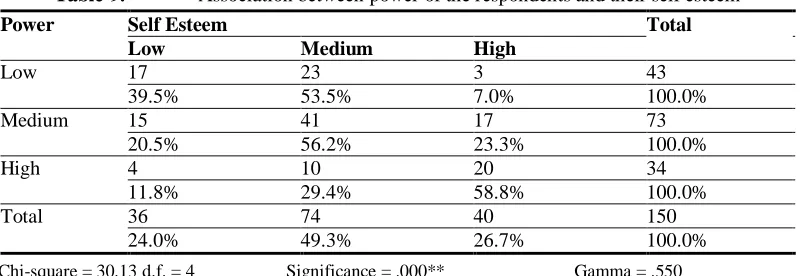
Table-9. Association between power of the respondents and their self esteem
Power Self Esteem Total
Low Medium High
Low 17 23 3 43
39.5% 53.5% 7.0% 100.0%
Medium 15 41 17 73
20.5% 56.2% 23.3% 100.0%
High 4 10 20 34
11.8% 29.4% 58.8% 100.0%
Total 36 74 40 150
24.0% 49.3% 26.7% 100.0%
Chi-square = 30.13 d.f. = 4 Significance = .000** Gamma = .550
** = Highly Significant
Table 9 presents the association between power of the respondents and their self esteem. Chi-square value shows a highly-significant association between power of the respondents and self esteem. Gamma value shows a strong positive relationship between the variables. It means if the respondents had more power than they have also high self esteem. Above table also shows that majority of the low power respondents had low to medium level self esteem, on the other hand if the respondents had high power respondents (58.8%) had high self esteem. So the hypothesis “It is more likely that self esteem of students affected by power” is accepted.
CONCLUSION
2356
mentioned factors. I gathered a significant interest from the respondents who responded towards my research hypothesis.
REFERENCES
Burke, P.J., & Cast, A. D. (2003) A theory of Self Esteem. Ames: Lowa State University.
Castillo, J.J. (2009). Random Sampling. Retrieved 13 Nov. 2012 from
Explorable: http://explorable.com/simple-random-sampling.html
Dr. Jackson, J. E. “Policing America: The African American Executive.” Published in the American Criminal Justice Association (LAE) Journal, 1998 Vol. 58-59, No.1-4, pp.33-41.
Eccles, J.S., Midgley, C., & Adler, T. (1984) Grade-related changes in school environment: Effects on achievement motivation. In J.G. Nicholls (Ed.), The development of achievement motivation (Vol. 13, pp.283-331). Greenwich, CT: JAI.
Gray, J.A. (1994) Three fundamental emotion systems. In P. Ekman & R. J. Davidson (Eds.), The nature of emotion: Fundamental questions (pp. 243–247). New York: Oxford University Press.
Jayaram V, (2012) The Hindu Caste System. New Dheli: Oxford press.
Jiloha, R.C. (1995) Culture, Mental Health and India’s Deprived Castes. Indian Journal of Social Psychiatry, Vol.11, pp.60–4.
Johnson, D., & Johnson, J. (2012). Social Stratification in India. New hope for India-Pakistan Relation. India: Sole responsibility of the authors.
Keltner, D., Gruenfeld, D. H., & Anderson, C. (2003) Power, approach, and inhibition. Psychological Review, Vol.110, pp.265–284.
Saunders, P. (1990) Social Class and Stratification. London & New York: Taylor & Francis e-Library.
Soviet Society (2009) Social stratification in Lithuania. A Post-Soviet society - True Lithuania website.