Autophagic inhibition via lysosomal integrity dysfunction leads to antitumor
activity in glioma treatment
Hui-Yun Hwang1, ¶, Yoon Sun Cho1, ¶, Jin Young Kim2, Ki Na Yun2, Jong Shin Yoo2, Eunhyeong Lee3, Injune Kim3
, and Ho Jeong Kwon1,*
1Chemical Genomics Global Research Laboratory, Department of Biotechnology, College of Life Science and Biotechnology, Yonsei University, Seoul 03722, Republic of Korea
2Biomedical Omics Group, Korea Basic Science Institute, Ochang, Chungbuk 28119, Republic of Korea
3Biomedical Science and Engineering Interdisciplinary Program, Korea Advanced Institute of Science and Technology, Daejeon 34141, Republic of Korea
¶These authors contributed equally to this work.
*Correspondence: kwonhj@yonsei.ac.kr (H.J.K); Tel.: +82-2-2123-5883 (H.J.K.)
Ho Jeong Kwon, Ph.D.
Professor, Department of Biotechnology, College of Life Science and Biotechnology, Yonsei University, Engineering Hall B, B410, 50 Yonsei-ro, Seodaemun-gu,
Seoul 03722, Republic of Korea Phone: 82-2-2123-5883
Fax: 82-2-362-7265
E-mail: kwonhj@yonsei.ac.kr. Tel: +82-2-2123-5883
Supplementary information
Materials and Methods
LC−MS/MS sample preparation
Sephadex G-100 (Sigma-Aldrich) was used to filter whole proteins over a fractionation range of
4000–150,000 by gel filtration, and the protein concentrations of 100-μg samples were measured.
DTT was then added to a final concentration of 25 mM in each sample, and the samples were
incubated for 30 min at 25 °C with agitation. Next, IAA was added to each sample at a final
concentration of 25 mM, and each sample was placed in the dark for 30 min at 25 °C.
Subsequently, the protein samples were digested into peptides with 5 μg trypsin; these peptides
were incubated with end-over-end rotation at 37 °C for 4 h. The final solutions were dried using
a SpeedVac (Thermo Fisher Scientific), and the dried peptides were dissolved in an aqueous
solution of 0.1% formic acid prior to quantification.
1D-LC-MS/MS
Peptides were analyzed by one-dimensional liquid chromatography/tandem mass spectrometry
(1DLC-MS/MS). Peptides were identified using MS/MS with a nano-LC-MS system consisting
of a nanoACQUITY UltraPerformance LC System (Waters, Milford, MA, USA) and LTQ
Orbitrap Elite mass spectrometer (Thermo Fisher Scientific) equipped with a nano-electrospray
source. An autosampler was used to load 5-µL aliquots of the peptide solutions into a C18
trap-column (i.d. 180 μm, length 20 mm, and particle size 5 μm; Waters). The peptides were desalted
and concentrated on the column at a flow rate of 4 µL/min for 10 min. The trapped peptides were
back-flushed and separated on a 150-mm home-made microcapillary column consisting of C18
i.d. of 5 µm. The mobile phases A and B were composed of 0 and 80% acetonitrile, respectively,
and each contained 0.02% formic acid and 0.5% acetic acid. The LC gradient began with 5% B
for 15 min and was increased to 15% B over 5 min, 50% B over 70 min, 95% B over 5 min, and
remained at 95% B for 5 min and 5% B for another 5 min. The column was re-equilibrated with
5% B for 15 min before the next run. The voltage applied to produce an electrospray was 2.2 kV.
In each duty cycle of mass analysis, one high-mass resolution (100,000) MS spectrum was
acquired using the FT-ICR analyzer, followed by five data-dependent MS/MS scans using the
linear ion trap analyzer. For MS/MS analysis, normalized collision energy (35%) was used
throughout the collision-induced dissociation phase. Previously fragmented ions were excluded
for 60 s.
Protein identification
MS/MS spectra were analyzed using the following software analysis protocols with the Uniprot
human database. Reversed sequences of all proteins were appended into the database to calculate
the false discovery rate. ProLucid was used to identify the peptides [23] with a precursor mass
error of 25 ppm and fragment ion mass error of 600 ppm. Trypsin was selected as the enzyme
with one potential missed cleavage. Carbamidomethylation at cysteine was chosen as a static
modification. Oxidation at methionine was chosen as a variable modification. The output data
files were filtered and sorted to compose the protein list using DTASelect [24] (The Scripps
Research Institute, La Jolla, CA, USA) with two or more peptide assignments for protein
identification and a false-positive rate less than 0.01.
Peptide quantification
Identified peptides were quantified by the combined intensity of three isotope peaks of M, M+1
and M+2 at the highest MS spectral point of each peptide. This method showed a correlation of
R2 = 0.91 against the conventional extracted ion chromatogram method [45]. Total combined intensity of each peptide group was calculated as average value.
Statistical analysis
All data are expressed as the means ± SEM with GraphPad Prism (ver. 5.00 for Windows;
GraphPad Software, Inc., San Diego, CA, USA). Data were obtained from at least three
independent experiments. Statistical analyses were performed using an unpaired, two-tailed
Student’s t-test. P-values less than 0.05 were considered statistically significant (* indicates p <
0.05, ** indicates p < 0.01, *** indicates p < 0.001).
Figure 1. APZ may not induce autophagy continuously, but rather trigger incomplete autophagy
resulting from autophagic flux inhibition. Immunoblot of Atg5, p62, Atg16L1, and LC3 levels
after 24 h of APZ treatment in HeLa cells. 1
2 3 4 5 6 7 8 9
Figure 2. Effects of APZ on U87MG tumor growth in vivo. (A) Mice bearing glioblastomas
consisting of U87MG cells were treated with vehicle and APZ (10 mg/kg) every other day.
Tumor volume and body weight of the mice in each group (n = 4) were measured over 18 days.
*p < 0.05. (B) Acridine orange staining of sectioned tumors used in a. Sections were treated with
acridine orange (5 μg/mL) for 5 min before fixation. After fixation, each sample was examined
by confocal microscopy. Scale bar, 20 μm. Graph of fluorescence in b. Values are means ± SEM;
n = 30 cells. ***p < 0.001.
5 1
2 3 4 5 6 7 8
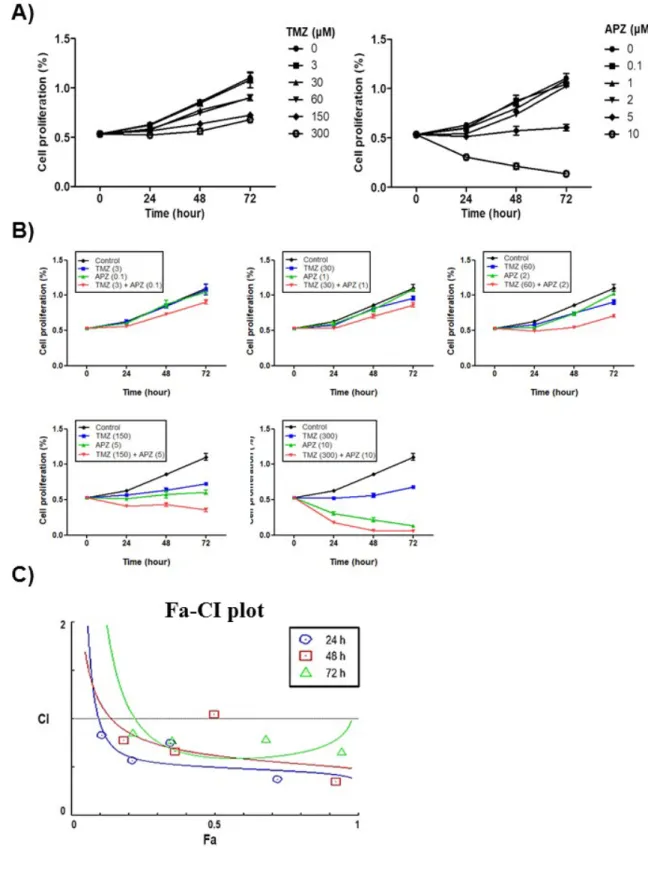
Figure 3. Synergistic effect of TMZ with APZ in U87MG. (A) Effect on TMZ or APZ on the 1
proliferation of U87MG cells. All cells were treated with TMZ or APZ for 48 h as indicated and
cell growth was measured using an MTT calorimetric assay. N=3 means ± SE. (B) All cells were
co-treated of TMZ with APZ as indicated and cell growth was measured using an MTT
calorimetric assay. N=3 means ± SE. (C) Combination index plot for TMZ with APZ in U87MG.
Combination index (CI) plotted against fractions affected (Fa) analyzed using COMPUSYN.
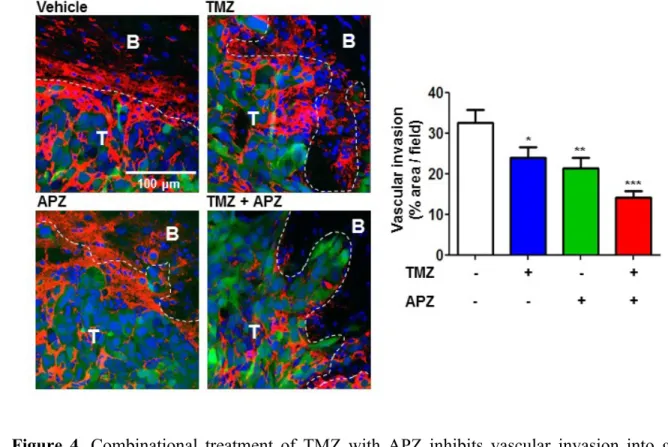
Figure 4. Combinational treatment of TMZ with APZ inhibits vascular invasion into glioma
region. CD31-positive GFP-GL261 vessels in vehicles, TMZ, APZ, and combinational treatment
of TMZ with APZ. Vessel abnormality with vehicle-treated mouse was significantly decreased
by combinational treatment of TMZ with APZ. Vascular invasion into glioma region was
quantified by red fluorescence % area in green fluorescence area using Image J.
7 1
2 3 4 5
6 7 8 9 10 11
Figure 5. Peptide analysis to quantify volume of protein target candidates. (A) CBB staining
with gel filtration using Sephadex G-100 before LC-MS/MS analysis. APZ (100 μM) treatment
increased some proteins stability from pronase compared to pronase alone treatment. (B)
peptides quantification of Hsp70 using the combined intensity of three isotope peaks in samples
of control and pronase with/without APZ treatment. (C-D) In silico docking model of ATP and
VER-155008 as shown in 5C and 5D interacting with Hsp70 (human Hsp70 NBD, RCSB PDB
ID: 3ATV) respectively. In the upper panel, APZ binds to the Hsp70 NBD pocket in the most
stable pose and binding motifs are depicted with several high-affinity interactions between these
ligands and the Hsp70 NBD pocket. Ligands are shown as gray sticks in displayed charge
receptor surfaces. Bonds are shown as dashed lines color-coded as follows: hydrophobic
interactions in orange, electrostatic interaction in purple, and hydrogen bonds in green and sky
blue.
9 1
2 3 4 5 6 7 8 9 10 11 12
Fig
ure 6. RNA interference and recombinant Hsp70 transfection analysis. (A) Hsp70 RNA levels
measured using RT-PCR in HeLa cells following siRNA-mediated Hsp70 knockdown. Cells
were transfected for 24 h with vectors including 5 nM or 10 nM siRNA targeted against Hsp70
mRNA, as indicated. (B) Measurement of protein levels of recombinant Hsp70 after transfecting
WT rHsp70 or mutant Hsp70 (K71E) constructs using western analysis. Cells were transfected
for 4 h, and treated as indicated. (C) Genetic Hsp70 overexpression reduced anti-proliferative
activity of APZ. Values represent means ± SE; n = 4. Wild-type Hsp70 or K71E
EGFP-Hsp70 vectors (200 nM) were transfected into Chang cells for 4 h. APZ was administered at the
indicated concentrations for 48 h. 1