University of South Carolina
Scholar Commons
Theses and Dissertations
2016
Mechanical Characterization of SICF-SICM
Nuclear Fuel Cladding by a Novel Hydraulic
Internal Pressurization Method
Kirill Shapovalov
University of South Carolina
Follow this and additional works at:https://scholarcommons.sc.edu/etd
Part of theMechanical Engineering Commons
Recommended Citation
M
ECHANICALC
HARACTERIZATION OFS
ICF-S
ICM
N
UCLEARF
UELC
LADDING BY AN
OVELH
YDRAULICI
NTERNALP
RESSURIZATIONM
ETHODby
Kirill Shapovalov
Bachelor of Science
University of South Carolina, 2014
Submitted in Partial Fulfillment of the Requirements
For the Degree of Master of Science in
Mechanical Engineering
College of Engineering and Computing
University of South Carolina
2016
Accepted by:
Xinyu Huang, Director of Thesis
George Jacobsen, Reader
DEDICATION
This work is dedicated to the people who devote their lives and work to the
common good for the humanity, to the science and technology industries and those who
support education and creativity in other people. This work is dedicated to those who
ACKNOWLEDGEMENTS
I would like to express my appreciation to Dr. Xinyu Huang, who provided me
with the opportunity to conduct this research and for all the mentoring along the way. I
am thankful to Dr. George Jacobsen for the valuable feedback on the research progress. I
would like to show my appreciation to my family and friends who supported me during
times when it mattered most and for all the joyful times in between.
This work was performed at the University of South Carolina, Mechanical
Engineering Department, in collaboration with General Atomics. Funding was provided
by the Department of Energy Office of Nuclear Energy under the Accident Tolerant Fuel
Program, DE-NE0000566 and DE-NE0008222. This report was prepared as an account
of work partially sponsored by an agency of the United States Government. Neither the
United States Government nor any agency thereof nor any of their employees make any
warranty, express or implied, or assumes any legal liability or responsibility for the
accuracy, completeness, or usefulness of any information, apparatus, product, or process
disclosed, or represents that its use would not infringe privately owned rights. Reference
herein to any specific commercial product, process, or service by trade name, trade mark,
ABSTRACT
Ceramic Matrix Composites (CMC) have been actively researched for
applications requiring high temperature strength and damage tolerance. Examples are
turbine engine hot section components, leading edges for hypersonic vehicles, nuclear
fusion reactor first wall and blanket, and recently nuclear fuel claddings. Predictable
material damage behavior is desirable for these applications so early damage
accumulation can be detected before a catastrophic failure occurs. Many ceramic
materials can withstand high temperature environments, but due to inherent brittleness of
ceramics the high damage tolerance and the predictable damage behavior are difficult to
achieve. Ceramic fiber reinforced ceramic composites (CFCC) have demonstrated the
above properties through properly designed fiber architecture, carefully engineered
fiber-matrix interphase layer, and the advanced manufacturing processes. Because of the
number of unknowns associated with the design and manufacturing of CFCCs,
mechanical experiments are relied upon to obtain necessary material property data sets
for component and system design analysis.
This work focuses on: (1) development and validation of novel mechanical
characterization techniques for tubular samples; and (2) characterization of a nuclear
grade silicon carbide fiber reinforced silicon carbide matrix (SiCf-SiCm) composite
nuclear fuel cladding. A bladder type internal pressure fixture was designed to load the
open and tubular sample with one closed-end. The test methods were first validated by
testing tubular surrogate samples made out of well-known materials, and comparing the
test results with finite element (FE) simulation and analytical calculations. The pressure
profile measured by Digital Image Correlation (DIC) along sample axis is in good
correlation with previously reported analytical solution. Away from the edge, the
measured strains were found to be within 3% of calculated values at loading levels of
interest. A closed-end validation experiments showed that the novel bladder method can
generate a hydrostatic pressure state which closely imitates the operating conditions for
nuclear fuel claddings.
Using the above methods, nuclear grade SiCf-SiCm composite tubes had been
tested in both configurations to obtain critical stress and strain values at proportional limit
and at failure. One group of samples, with only 1.25 mm wall thickness, was able to
sustain internal pressures averaging at 99.8 MPa before the final rupture. These samples
also demonstrated pronounced progressive damage behavior starting around 33.2 MPa.
At the rupture pressure, all samples showed graceful failure modes without excess
fragmentation. The surface strain maps measured by DIC revealed highly heterogeneous
strain state during loading; the spatial frequency of the strain patterns correlate to the
fiber tow braiding architecture. At final failure, the local peak strain was found to range
between 115% and 185% of the average failure strain observed on sample surfaces.
Acoustic emission (AE) monitoring method was used to obtain additional
commonly observed Kaiser and Felicity effects, an interesting new phenomenon of AE
signal bursts during unloading process was observed for some SiCf-SiCm composite
tubes. It is hypothesized that it is related to the forced closure of mismatched crack
surfaces. Frequency content of some AE signals was shown to decrease with the
increased amount of damage. Unsupervised Pattern Recognition (UPR) technique was
applied to identify and group similar AE signals. Four classes were identified with the
clustering algorithms showing consistency with other works. It is believed that the
classes are associated with microscopic composite damage mechanisms such as matrix
cracking, fiber breaking, fiber-matrix debonding and sliding. Such correlation, with
TABLE OF CONTENTS
Dedication ... iii
Acknowledgements ... iv
Abstract ... v
List of Figures ... xi
List of Abbreviations ... xiv
CHAPTER 1. Introduction... 1
1.1 Motivation and Background ... 1
1.2 Open-end Burst Testing ... 7
1.3 Closed-end Burst Testing ... 9
1.4 Mechanical Characterization of Nuclear Grade SiCf-SiCm Composites ... 10
1.5 Digital Image Correlation on CMC ... 12
1.6 Acoustic Emission Monitoring of SiCf-SiCm... 13
CHAPTER 2. Experimental setup ... 19
2.1 Open-end Burst Rig ... 19
2.2 Closed-end Burst Rig ... 21
2.6 Lip Effect Study ... 31
2.7 Testing of SiCf-SiCm Composites ... 33
2.8 Acoustic Emission Analysis ... 34
CHAPTER 3. Result and Discussion ... 36
3.1 Open-end Burst Rig Validation ... 36
3.2 Bladder Compressibility Effect... 41
3.3 Closed-end Burst Rig Validation ... 44
3.4 Lip Study ... 46
3.5 Mechanical Testing of SiCf-SiCm Composites ... 50
3.6 Acoustic Emission Analysis ... 57
3.7 Unsupervised Pattern Recognition ... 63
CHAPTER 4. Conclusions... 74
References ... 77
APPENDIX A – Internal Bladder Burst Test Operation Procedure ... 81
A. 1 Purpose ... 81
A. 2 Safety and Training ... 81
A. 3 Major Equipment and Components ... 81
A. 4 Procedure ... 82
A. 5 Calibration and Controls ... 86
APPENDIX B – DIC Calibration Procedure ... 87
B. 1 Purpose ... 87
B. 2 Procedure ... 87
C. 1 Purpose ... 90
LIST OF FIGURES
Figure 1.1 Matrix crack redirected paralell to the loading by a weak fiber-matrix bond
[12]. ... 3
Figure 1.2 Typical stress-strain curve for CMC during cycling loading [12]. ... 7
Figure 1.3 Representation of an AE signal showing major features [30]. ... 14
Figure 1.4 Representative graph of Kaiser and Felicity effects [30]. ... 15
Figure 1.5 AE classification for polymer matrix composites provided by Mistras. ... 17
Figure 2.1 Open-end burst rig setup schematic. ... 20
Figure 2.2 Internal pressure burst rig setup: (a) overall setup, (b) close-up of the sample, (c) computer rendering of a sample, bladder and alignment bars. ... 21
Figure 2.3 Closed-end burst rig schematic. ... 22
Figure 2.4 One end closed burst rig setup: (a) overall setup, (b) computer rendering of the sample connections, (c) typical bladder polymer plug, (d) close-up of the sample setup. ... 23
Figure 2.5 Aluminum validation sample with two sets of strain gauges bonded to the surface. ... 28
Figure 2.6 Aluminum validation sample with three strain gauges bonded in hoop direction and one strain gauge in an axial direction (away from the camera)... 29
Figure 2.7 Dimensions of the end plug FE model. ... 31
Figure 2.8 Boundary conditions for the end plug FE model... 31
Figure 2.9 Mesh of the closed-end FE model. ... 31
Figure 2.10 A 3D model of for the lip study with the boundary conditions. ... 33
Figure 3.1 Photoelasticity test showing a specimen at (a) 0 MPa, (b) 0.9 MPa psi, (c) at
4.1 MPa and (d) at 4.1 MPa with the bladder covered. ... 37
Figure 3.2 Mosley's analytical solution of the stress distribution where βm represents a non-dimensional length with the βm=0 representing the beginning of the pressurized zone [12]. ... 38
Figure 3.3 Strain values from 2 strain gauge readings and the calculated values for 28 mm long sample are plotted here. ... 39
Figure 3.4 Percent error between measured pressure and the calculated pressure received by the 28 mm long sample. ... 40
Figure 3.5 Percent error between measured pressure and the calculated pressure received by the 304 mm long sample. ... 41
Figure 3.6 (a) Material constrained by all sides except top surface with a pressure force acting on the top surface; (b) Schematic of the bladder inside of a sample. ... 42
Figure 3.7 Representative forces on the bladder in x directions. ... 43
Figure 3.8 Poisson's ratio calculated from 304 mm long aluminum sample test. ... 44
Figure 3.9 Comparison between measured and modeled strains in a closed-end sample. Zero inches indicates the edge of the plug in the sample. ... 45
Figure 3.10 Typical results of a lip study showing exagerated deformation for (a) hoop direction strains and for (b) axial direction strains. An adapter lip is not shown but it would be present on the left side of the sample. ... 46
Figure 3.11 Comparison between calculated and measured strains for a 2.5 mm lip. ... 48
Figure 3.12 Comparison between calculated and measured strains for a 5.1 mm lip. ... 48
Figure 3.13 Comparison between calculated and measured strains for a 7.6 mm lip. ... 49
Figure 3.14 Typical DIC strain map showing three regions with their corresponding average hoop strain values and some uncorrelated areas. ... 52
Figure 3.18 Acoustic Emission activity and intensity compared to sample strain for
B-A-4 specimen. ... 58
Figure 3.19 Acoustic Emission activity and intensity compared to sample strain for E-A-1 specimen. ... 58
Figure 3.20 Normalized AE parameter change with respect to composite damage. ... 59
Figure 3.21 Peak frequencies for E-A-1 sample showing drifting of AE signals towards lower frequencies as damage progresses. ... 61
Figure 3.22 Typical AE signal associated with matrix crack surface-to-surface contact upon unloading. ... 62
Figure 3.23 Strain and absolute energy for E-B-3 sample. ... 63
Figure 3.24 Badly detected AE waveforms: (a) a precursor had triggered the waveform recording, (b) several waves recorded simultaneously. ... 65
Figure 3.25 Normalized clustering performance indices plot. ... 66
Figure 3.26 AE intensity versus time. ... 67
Figure 3.27 AE activity versus time. ... 68
Figure 3.28 AE clusters on stress-strain curve... 69
Figure 3.29 Map of all clusters on duration vs amplitude plot. ... 72
Figure A.1 Cured bladder end plug... 84
LIST OF ABBREVIATIONS
AE ... Acoustic Emission
AOI ... Area of Interest
CFCC ... Ceramic Fiber Ceramic Composite
CMC ... Ceramic Matrix Composite
CVI ... Chemical Vapor Infiltration
DIC ... Digital Image Correlation
EPD ... Electrophoretic Deposition
FE ... Finite Element
HDT ...Hit Definition Time
HLT ... Hit Lockout Time
ID ... Inside Diameter
LWR ... Light Water Reactor
NITE ... Nano-Infiltration and Transient Eutectic
OD ... Outside Diameter
PCMI ... Pellet Cladding Mechanical Interaction
UPR ... Unsupervised Pattern Recognition
CHAPTER 1. INTRODUCTION
1.1 Motivation and Background
Silicon carbide fiber reinforced silicon carbide matrix (SiCf-SiCm) composites are
being actively pursued by a scientific community for an accident tolerant nuclear fuels
cladding applications. The SiCf-SiCm composite cladding have being considered as a
replacement for a zirconium cladding tube and it has shown to have many desirable
attributes including high strength at high temperatures, stability under irradiation, low
reactivity with the hot coolant, and low hydrogen production [1-3]. However, while the
material itself has the desired properties, the nature of the ceramic composites makes
designing it to be a challenging problem. The fiber architecture, interphase deposition
and manufacturing processes are difficult to predict accurately, therefore composite
characterization still heavily relies on material testing.
Two examples of highly important mechanical tests are the internal pressure burst
test and the end plug push out test. Both tests evaluate the composite strength in a LOCA
(loss-of-coolant accident) scenario when the internal pressure of the cladding rises
beyond normal operating conditions. The end plug test evaluates a joint strength between
geometrical shape had recently being submitted to ASTM but there still exists a lack of
proven methods [1, 2]. In this work, an alternative method was developed for pressure
testing silicon carbide nuclear grade composites in both tubular and closed-end
configurations using a novel polymer bladder apparatus.
The potentials of Ceramic Matrix Composites (CMC) as a structural material in
high temperature applications had been first recognized in mid-1970s and it has been
actively studied for several decades [8]. The main advantages that these composites offer
over metal parts are the ability to retain strength under continuously high operating
temperatures and a weight reduction of the components. In turbine engines these
advantages provides higher engine efficiency which translates to fuel savings. In
addition, ceramic composites provide much improved toughness and damage tolerance
over the equivalent monolithic materials. The key to improved toughness is a properly
engineered fiber matrix interphase. By depositing a weak interphase material on the fiber
surface with a relatively low shear modulus, a matrix crack tip can be diverted away from
the load carrying fibers as shown in Figure 1.1 [9]. Another significant challenge
associated specifically with non-oxide composites was to prevent oxidation. When the
fibers are exposed to oxidizing environments, the composites can lose their toughness
due to interphase degradation. However, a novel self-healing interphase and matrix
structures had been designed [8], once again qualifying these materials for high
Figure 1.1 Matrix crack redirected paralell to the loading by a weak fiber-matrix bond [12].
As Naslain [8] reports, practical applications of these composites had been exploit
in the stationary parts of jet engines and power generators such as combustor chamber
liners and exhaust nozzles. Replacing heavy superalloy components with these ceramics
had provided higher engine efficiencies, lower emissions and greater fuel economy by
increasing operating temperatures, eliminating the need of cooling these parts and
through a weight reduction. However, the durability, corrosion resistance and
economical aspects remain to be questionable for these materials. In the nuclear industry,
highly radioactive with neutrons and alpha particles. The SiCf-SiCm composites are the
most promising for such application due to its low residual radioactivity after being
irradiated and a high stability under irradiation [8]. However, there are several issues that
need to be addressed before an implementation stage. Under irradiation and high
temperatures, some of the issues include the geometrical changes of the matrix and the
fibers, instability of the interphase material after prolong exposure, lowered fiber
strength, decreased thermal conductivity, especially through thickness direction, and
SiCf-SiCm may react with the gases present in a reactor (oxygen, helium and hydrogen).
Nevertheless, SiCf-SiCm is the most promising material choice from the CMC family.
Manufacturing of these CMC composites had evolved into several basic routes:
(1) when the matrix precursor is in liquid phase, (2) in gaseous phase, (3) a slurry type,
and (4) a combination route [8]. A few other methods are under development including
electrophoretic deposition (EPD) [11]. Liquid phase route splits into a polymer
impregnation/pyrolysis (PIP) method and a liquid silicon infiltration (LSI). PIP process
works on impregnating a fiber preform with a Si-C precursor in a liquid state. The
precursor flows through the fiber network wetting the fibers. However, this method
produces a matrix structure with high porosity. To improve densification, several cycles
of PIP process could be used. Repeating of the cycles makes it less economical and slow.
To improve densification while reducing the number of impregnation cycles, fillers, such
as fine powder of silicon carbide, can be added to the precursor. Yet, fillers make it more
difficult to impregnate the preform. The other method, liquid silicon infiltration, often
referred as LSI, starts by depositing carbon with PIP or a chemical vapor infiltration
silicon based alloy which occupies the remaining pores providing a highly dense
composite. However, the process is performed at high enough temperatures (1400°C
-1600°C) when some types of fibers can be weakened. Liquid silicon is also corrosive to
fibers and to some interface materials unless a specially prepared hex-BN/SiC interphase
is used. Lastly, additional treatments must be performed in order to reduce an amount of
free silicon which lowers creep resistance.
Matrix, interphase and additional coatings can also be deposited onto a preform in
a gaseous state, which is the second approach called chemical vapor infiltration (CVI)
[8]. This method could be done at lower temperatures, compared to the liquid phase
approach, and at low or atmospheric pressures. The fiber preform must contain and
maintain a pore network for the gases to flow until the densification process is completed.
Several variations of the method had evolved in order to maintain the pore channels
opened and to increase the speed of infiltration. These variation including
isothermal/isobaric process (I-CVI), pressure gradient (PG-CVI), inverse temperature
gradient (TG-CVI), combination of the pressure gradient and inverse temperature
gradient techniques called forced (F-CVI) and a pressure-pulse process (P-CVI). The CVI
approach offers a high degree of control of the composite microstructure. The main
drawback to CVI method, regardless of the process variation, is the significant residual
porosity which can cause lower strengths and thermal conductivity.
The third process route, slurry method, had been disregarded for some time
The composite is then sintered at high temperature and pressures. Previously, it is this
step that caused damage to the fibers. However, it was discovered that adding sintering
agents, especially oxide type, permits lower temperatures. When thermally stable
quasi-stoichiometric fibers are combined with these oxide type additives, the process yields
composites with low porosity, high mechanical properties and high thermal conductivity.
This process is known as NITE, nano-infiltration and transient eutectic phase. However,
the fiber volume fraction remains small and the interphase layer is still relatively thick.
Composites go through several damage mechanisms when loaded in tension.
Significant contributions in understanding CMC failure behavior were made by
Veggagini and Evans. A typical stress-strain curve for a non-oxide CMC is shown in
Figure 1.2 [9]. When a composite is loaded, it goes through three main damage states.
During initial loading, the material behaves elastically as no significant damage had
occurred yet. Once the stress reaches the matrix crack stress, 𝜎𝑚𝑐, or a Proportional
Limit Stress (PLS), the material starts to accumulate irreversible damage in a form of
matrix cracking, fiber breaking, and fiber-matrix debonding. Further loading increases
the matrix crack density up to a saturation state, 𝜎𝑠. After this point, any additional
increase in stress is carried by the fibers only. Some composites, however, fail before
reaching matrix crack saturation. Particularly, Veggagini studied hysteresis loops and
some of the damage mechanisms during loading-unloading cycles between the PLS and
the crack saturation states. The amount of hysteresis provides information on the
fiber-matrix interface bond. Larger hysteresis loop width indicates smaller debond energy
between the fiber and the matrix. This condition is also accompanied by a quadratic path
energy, as identified by Vagaggini, the hysteresis loop has a narrower loop width and a
linear portion right before unloading to zero stress. A hysteresis loop is observed in
combination with the permanent strain when fully unloaded. This strain includes the
contributions from the misfit strain and the matrix crack opening produced during the
fiber-matrix debonding, Figure 1.2. This analysis brings better understanding of the
constituent properties of the CMC composites and aids in interpreting test results.
Figure 1.2 Typical stress-strain curve for CMC during cycling loading [12].
1.2 Open-end Burst Testing
An internal pressure burst test is a common test method for tubular structures that
polymer insert to expand in a radial direction, therefore inducing pressure on the inner
walls of a sample. It was noticed that the elastomer insert behaves like a hydraulic fluid
up to 5% of axial compression. Through an analytical solution, stress profiles on the
inside and the outside walls were derived. These stress profiles were compared to
experimental results of mild steel tubes and matched within 5%. Mosley also showed
that applying lubricant between the insert and the sample, between the insert and the
actuating rods reduces friction and hence brings the experimental results closer to the
theoretical values. The insert material has to be carefully chosen since some elastomers
might be difficult to machine to a desired outside diameter and they can be dimensionally
unstable under cycling loadings. Nevertheless, the method is relatively simple to
implement on traditional mechanical testing machines, requires little time to set up and
does not require a mechanical bonding to the test samples. These advantages make it a
popular choice for an internal pressure generation and it has evolved into an
ASTM C1819-15 [13] standard. Byun [5] had utilized the plug test to show size effects
in miniature alumina tubes. Ross [14] had compared experimental results from
monolithic and composite ceramic tubes using the polymer insert method. It is worth to
note, however, that buckling of these polymer plugs can occur when the ratio of length
over diameter of the plug gets large. This factor limits the length of a sample that can be
tested with this method.
A segmented cone method had been proposed by Nilsson [15] to produce radial
forces onto a cylindrical sample by pushing in a cone through matching contact surface
segments. The method provides a good control of radial displacement and is relatively
and a sample are hard to control. Also, mechanical contact pressure is not continuously
distributed on the internal surface of the samples, consequently introducing undesired
stress concentration at segments edges.
Another way of generating internal pressure is by pressurizing liquid inside of a
tubular sample. This method often times required some sort of seal between an
experimental fixture and a test specimen. In works reported by Cain [16] and Cohen [17],
two similar fixtures were developed to test composite samples using pressurized oil. Two
parallel plates were spaced just far enough for a test sample to fit in between. A soft
material was placed on the inside wall of the sample to act as an oil seal. When the oil is
pressurized, the seal pressed against a specimen inducing stresses in a radial direction. A
small amount of pressure was lost due to seal compression. Both authors reported that
their methods produced a uniform pressure on the samples. Brown [18] utilized a similar
fixture setup for testing bone specimens, but instead of oil an inert nitrogen gas was used.
For most applications though, gas should be avoided as a pressurized medium due to a
significantly higher danger levels associated with a rapid gas release when a specimen
fails. It is worth noting that in all of these tests the sample edges were loaded to the same
pressure as the rest of the material creating a significant edge effect.
1.3 Closed-end Burst Testing
Light Water Reactor (LRW) nuclear fuel cladding is a fully sealed tube, typically
through a use of end plug seals. Creating a strong bond between the end plug and the
test methods had been developed to measure shear strength of ceramic composite joints
such as four point bend, single lap offset shear, double-notched shear, torsion shear and
etc. [10, 19-21]. However, Khalifa and Katoh [1, 10] had stressed out the need to
develop a more representative test method where structural geometries are included in
joint strength testing. Khalifa had evaluated silicon carbide monolithic and composite
tubes with end plugs using a newly developed push out test. A push rod was used to pass
through the tubular part of the sample and to push the plug out. Samples were supported
by a bonded conical shape collet resting on a rigid structure of the fixture. Custom made
parts can be easily integrated with a standard mechanical testing machine which makes it
a convenient testing method. The author demonstrated that the more traditional planar
flexural testing for joint strength alone is not enough to predict structure strength of a
more complicated geometrical shape. Khalifa had successfully compared several
different end plug/sample bonding configurations.
At the moment of writing, no other work testing a composite material with a
geometry similar to cladding end plug is known to the author. As reported by Katoh [10],
there exists a lack of testing methods capable of producing more relevant loading
conditions for a pressurized tube with an end plug. For that reason a novel method was
developed using a common hydrostatic bladder method but for tubular samples with an
end plug. The hydrostatic pressurization method is believed to be more stress state
representative than traditional planer shear strength test methods.
1.4 Mechanical Characterization of Nuclear Grade SiCf-SiCm Composites
In the last two decades a great amount of research effort was directed towards the
had tested unidirectional composites produced by NITE method and plain-wave
composites produce by CVI and NITE methods in tension, compression and shear with
ranging fiber angles [22]. Resulting properties at PLS and at final fracture were reported.
The results showed that CVI composites have a significantly greater tensile and shear
strengths than the other two composites with the same fiber angles. Nozawa also pointed
out that the failure stresses could be predicted with the Tsai-Wu criterion fairly
accurately. Rohmer et al. had performed axial and hoop loading tests at ambient
temperatures on braided SiCf-SiCm cladding produced by CVI method [4]. Mechanical
properties obtained by Rohmer were significantly lower than the ones obtained by
Nozawa, however, the fiber type and sample geometries were different these works. A
3D simulation model for an axial test of the composite had revealed stress concentration
points where the fiber tows overlap each other. While the composites were braided and
do not have laminate layers, it was reported that the delamination can happen through a
fiber tow. Rohmer also suggested that because of the stress concentration produced by
the contacting tows of fiber, those locations could be the initiation cites for the
delamination cracks. Jacobsen et al. had investigated application of C-ring test on
nuclear grade claddings [7]. By cutting a slot out from a ring and compressing the
resulting C shaped samples, material mechanical properties from hoop stresses were
measured and compared to results obtained from the expending plug method. Khalifa, as
mentioned above, had tested SiCf-SiCm composites in an end plug configuration
1.5 Digital Image Correlation on CMC
Digital Image Correlation (DIC) is a powerful strain measurement technique. It is
a non-contact full-field strain measurement method with a broad range of applications
[24]. Three-dimensional DIC method enabled by two or more cameras has been widely
used to capture strain distributions on curved surfaces. A speckle pattern is first applied
onto a specimen. Image sets acquired during loading are analyzed by a stereo projection
and image correlation algorithms that provide displacement and strain maps on the
sample surface.
This systems have been shown to be a useful tool in characterizing CMC’s and
SiCf-SiCm claddings in particular [4, 25]. The main advantage DIC has over strain
gauges and extensometers is the strain field measurement type which is important for
nonhomogeneous brittle materials. Rajan et al. tested 2D woven SiCf-SiCm dog-bone
specimens loaded in tension [25]. The author used displacement fields to accurately
detect matrix cracks and estimate crack opening displacement. Stress concentration
regions were located where fiber tows overlapped one another. At higher stress levels,
those stress concentration regions served as crack initiation sites. Rohmer et al. used DIC
for strain measurement and crack density estimation [4]. The author pointed out that
while DIC and strain gauges provided similar results, DIC could provide strain
measurements in both hoop and axial directions for the same location. Also, during axial
1.6 Acoustic Emission Monitoring of SiCf-SiCm
Acoustic emission (AE) method has been gaining popularity in the scientific
community expending its application range rapidly. One such area is damage
characterization and early crack detection in ceramic matrix composites [3, 26-29].
AE sensors can pick up elastic waves generated by damage events in a specimen
and convert it into an electrical signal, as a waveform, shown in Figure 1.3 [30]. Terms
such as AE signal, AE event, and AE hit are equivalent terms referring to one signal
recorded by AE acquisition system. When AE signal is detected, its parameters are
calculated and a waveform is recorded. Standard parameters of a hit include duration,
counts of threshold crossings (often referred as counts), rise time, counts to peak,
amplitude, absolute energy, frequency centroid, peak frequency and others not used in
this document. Parameters such as rise time and counts to peak have a near linear
correlation. Such correlation also exists between duration and counts, and to a lesser
degree between amplitude and absolute energy. A signal amplitude threshold parameter
is set before running a test to eliminate AE signals of low importance and background
noise. Higher threshold values decrease a number of AE hits recorded per test. AE
activity refers to a number of AE hits recorded per unit time. AE intensity refers to the
amplitude or absolute energy of an AE signal. Terms clusters and classes are also
Figure 1.3 Representation of an AE signal showing major features [30].
When AE data is combined with load information, Kaiser and Felicity effects can
be observed. A generic representation of such effects are found in Figure 1.4 [30]. As a
material is loaded, either homogeneous or heterogeneous, from point A to point B on the
graph, it continuously emits AE signals. When a specimen is unloaded, from point B to
point C, the material produces no emission (AE signals from noise or an apparatus could
be detected though). When the material is loaded again from point C to point B, it
produces no AE signals until the previous peak load has been reached. This phenomenon
is called Kaiser effect. In some cases, a deviation from Kaiser effect can be observed.
For example, when the material is reloaded for the second time, from point E, AE
emission starts at point F before the previous load is reached (D). This type of behavior
anticipated that it has to do with unstable defects produced by substantial previous
loading. Felicity ratio is a measure of the Felicity effect and is calculated by dividing the
load at which the emission started during reloading by a previously reached load value.
Felicity ratio had been linked to residual strength of fiber reinforced composites, but its
value is dependent on the particular type of a composite [31].
Figure 1.4 Representative graph of Kaiser and Felicity effects [30].
A typical test of a CMC can produce, depending on system setup, tens of
thousands of events. Clustering algorithms can be utilized to group events with similar
parameters (such as amplitude, duration, rise time etc.). These clusters can then be
correlated to the physical damage mechanisms in a material. Two types of clustering Kaiser Effect
about the AE data set and the associated damage mechanisms. In this method clustering
algorithms are relied upon to group similar events. SPR is used when the physical source
is known about the AE events, which can be assigned to a group, for example, AE events
generated by lead break tests. Then, SPR algorithms are applied to learn the
characteristics of these groups. Once the SPR clustering algorithm is trained with known
data, it is then used to identifying the same groups in a new AE data set. The SPR
method is preferred over UPR since it offers the most predictable results, however, it is
not always practical or possible to do. For composite materials, complex damage events
occur simultaneously, and it is particularly difficult to generate a single type of damage
mechanism for training SPR. Tests or materials can be designed to induce a specific
damage mechanism (such as a fiber pull out) for generating a AE training data set.
However, in a real composite, attenuation and reflections can significantly distort the AE
signal [26, 32]. Because of these issues, UPR method is used in this study.
There are several widely accepted clustering algorithms available for UPR
analysis. Different algorithms require different amount of user input before running an
algorithm to generate the clusters. Once the clusters are obtained, assigning each cluster
to a specific source is a challenging task. This is particularly the case for composite
materials, which undergo multiple damage mechanisms that may occur simultaneously,
such as matrix cracking, crack propagation, delamination, single fiber break, fiber bundle
break, fiber pullout and friction. Some mechanisms may produce similar AE signals.
Also, AE signals can be altered by the distance between the source and the sensor.
Despite these challenges, AE clustering had been successfully utilized [31, 33]. Figure
Mistras training materials. It maps out AE from fiber break, matrix crack, delamination,
etc., based on AE signal intensity (amplitude) and duration. Such mechanistic map is
highly desired for the ceramic matrix composites as well.
Figure 1.5 AE classification for polymer matrix composites provided by Mistras.
One of the big advantages of an AE system is the easy to incorporate AE
sensor(s) to many mechanical test setups. Maillet tested SiCf-SiCm composites
containing a single tow under tension and used UPR to analyze the AE hits [3]. After
testing one of the samples and running a generic algorithm based on Davies-Buildin and
strain values of the composite. Nozawa had suggested that signals with peak frequencies
of around 260 kHz might be coming from matrix cracking based on tension tests [20].
Also, based on AE analysis, matrix cracking starts around 80% of PLS stress. Morscher
studied AE signal attenuation and wave velocity change with increased damage state of
the SiCf-SiCm composites [26]. It was noticed that a composite with a lower interphase
shear strength shows near 85% decrease in recorded energy when the measurements are
made at peak stresses.
The AE results and observations reported by other research groups serve as
CHAPTER 2. EXPERIMENTAL SETUP
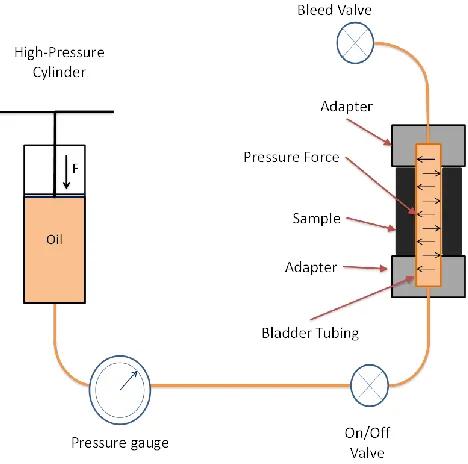
2.1 Open-end Burst Rig
An internal pressure burst rig was developed and first described in detail in [23],
however, some further improvements have been made. The overall system setup is
shown in Figure 2.1. An oil pressure is generated by a manually operated hydraulic
cylinder (Model 37-6-30) from High Pressure Equipment Company. The pump is then
connected to an analog pressure gauge, to aid an operator during testing. It is then
connected to the burst rig. In the rig, the oil passes to a flexible polymer bladder tube
(part number 5006K66 from McMaster-Carr) that deforms under oil pressure to the
internal surfaces of the supporting parts and a test specimen. In this configuration, the
internal pressure produces primarily hoop stresses. Axial strains are also experienced by
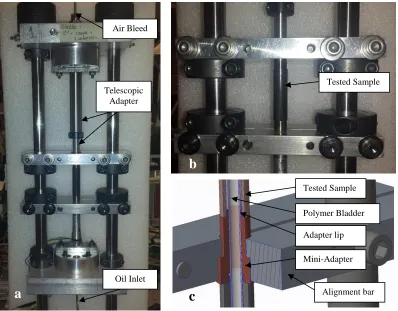
samples due to Poisson’s effect. In the original rig setup, during an assembly process, the
bladder tube had to be cut longer than the supporting components (such as the sample and
the adapters) to allow bladder installation. It often times caused the bladder to crumple
up in the sample area which can cause non-uniform stress distribution. For that reason a
telescopic adapter had been designed to be able to contract when the bladder is installed
the whole sample-adapters assembly to “buckle” to one side which could load the sample
asymmetrically. A step in the alignment bars and the mini-adapters provide a way to
redirect the axial loads away for the sample to the structure of the rig, Figure 2.2 (c).
Because the pressure rig consists of several components interconnected with each other,
any cross-sectional change produces an axial force by the pressurized oil. The telescopic
adapter has the largest cross-sectional area change such that at 70 MPa of internal
pressure it would produce an axial force of nearly 4450 N which is now transmitted to the
alignment bars bypassing the sample. A detailed procedure used to test samples in an
open-end configuration can be found in Appendix A.
Figure 2.2 Internal pressure burst rig setup: (a) overall setup, (b) close-up of the sample, (c) computer rendering of a sample, bladder and alignment bars.
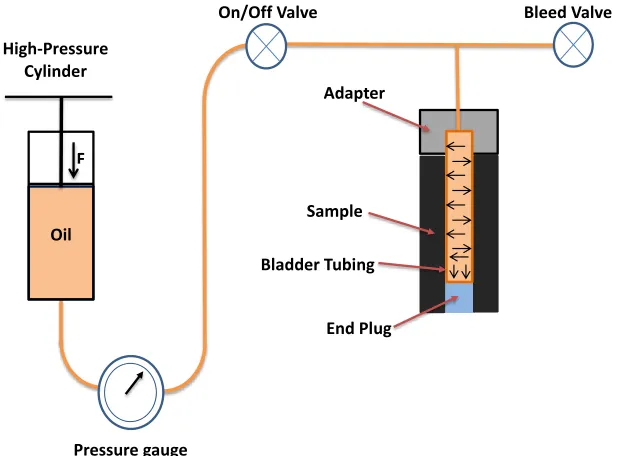
2.2 Closed-end Burst Rig
In light water reactors (LWR), the nuclear fuel cladding tubes are sealed with an
end plug at both ends of the tube. A method to form a strong and a durable plug at the
end of a SiCf-SiCm composite tube has been a challenging problem. To mechanically
evaluate the strength of that connection, a novel method was developed to test SiCf-SiCm
cladding tubes with an end plug using the internal bladder pressurization method. For the
test purposes, only one end of the cladding tube is sealed with an end plug so the other Adapter lip
Polymer Bladder
Alignment bar Tested Sample
a
b
c
Mini-Adapter Tested Sample Telescopic
Adapter
the open-end burst rig as shown in Figure 2.4. The main difference is that the bladder
tube has a polymer plug at one end produced by depositing a Liquid Stitch fabric
adhesive, Figure 2.4 (c). To securely support a sample in a desired position, a metal cone
is bonded to it using high shear strength epoxy, Figure 2.4 (b). Similar to the alignment
bars, a sample support bar is added with a cone cutout in the middle to constrain a test
sample in the axial direction. Due to an asymmetric setup, a mixed mode stress state is
produced in the sample near the plug. Hoop stresses are still dominant as they are in the
open-end burst rig, but the oil also produces stresses in the axial direction as shown in
Figure 2.3. Because the bladder tube has only one opening, that means that the same oil
line is used to fill the system up with the oil and to breed the air out. A detailed procedure
used with this setup is outlined in Appendix A.
Figure 2.3 Closed-end burst rig schematic.
High-Pressure
Cylinder
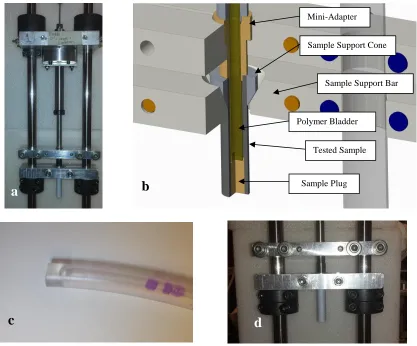
Figure 2.4 One end closed burst rig setup: (a) overall setup, (b) computer rendering of the sample connections, (c) typical bladder polymer plug, (d) close-up of the sample setup.
To make one-end closed bladder tube, two types of fabric adhesives (Liquid
Stitch) were used to produce the polymer plug: a quick curing and a slow curing. The
Liquid Stitch forms an elastomeric plug that bonds to the bladder tube. The slow curing
type showed a significantly stronger bond to the polymer bladder therefore it was used
for all of the closed-end burst tests. Once fully cured, the plug can undergo large
a
c
d
b
Mini-Adapter
Tested Sample
Sample Plug Polymer Bladder
Sample Support Cone
2.3 Instrumentation
During a burst test, the applied pressure, the strain state, and the acoustic
emissions are monitored continuously until sample rupture. The applied hydraulic oil
pressure is recorded with an Omega PX01S-20KGI pressure sensor. The sensor is
connected to a National Instruments module NI 9203 which is installed in a
NI c-DAQ-9172 chassis. Some tests samples are also equipped with 2 sets of
CEA-06-125UT-350 strain gauges measuring strains in the axial and hoop directions.
The strain gauges are connected to a NI 9237 module in the same chassis. A LabView
program is written to record data from the pressure sensor and the strain gauges along
with a time stamp for each record.
Digital Image Correlation system (DIC) from Correlated Solutions is used to
record strain maps on the outer surface of a sample. Two monochromatic CCD type
cameras (GRAS-30S5M) from Point Gray equipped with high resolution 35 mm lenses
(part number 85868 from Edmund Optics) are set up with in-plain angle of about 20°.
Due to such camera-lens combination and to fill the camera sensor area with an image of
a sample, the cameras are placed in a close proximity of the specimen (around 150 mm
away). To decrease the chance of lens damage by the burst sample fragments and oil
contamination an optical glass is placed between the samples and the cameras. From
simple testing, it was determined that the glass did not appear to affect DIC results.
Plastic mounts originally installed on the cameras were found to be excessively flexible
and they had only one screw hole for mounting to a structure. This condition would
cause one camera to move and rotate independently from the other camera which
were fabricated with two mounting holes. Both cameras are rigidly mounted to a single
bar which together with the new camera mounts showed a significant improvement in
retaining cameras’ calibration. For cylindrical samples, the two DIC cameras are
oriented in the plane of sample’s axis so both cameras can see the same surface. This
orientation provides a strain map for approximately 90° of the sample’s outer surface.
To produce a speckle pattern required for DIC measurement, the specimens are
first coated with flat black paint and then sprayed with a flat white paint. The paint is
sprayed manually in a way so the finer paint mist deposits on a specimen but the larger
paint drops misses a specimen. The speckle pattern quality varied some due to the
method but a typical speckle size was on an order of 0.05 mm across. Vic3D (by
Correlated Solutions) is used for camera calibrations and to analyze captured images.
During cameras calibrations, a maximum distortion order of 3 is chosen because most
SiCf-SiCm samples have a very rough outer surface and there is a large curvature in the
viewing area. A calibration target was printed and glued to a rigid thick plastic plate.
Appendix B outlines the procedure used for the DIC calibration. A subset size of a
computational element is automatically determined by the software. For the SiCf-SiCm
composites, the subset step size is often times adjusted to a smaller value than
recommended by the vendor of the system. This is done to decrease the amount of
uncorrelated areas inside of an area of interest (AOI) that are often found on samples with
rough outer surfaces. For these analyses, an optimized 8-tap interpolation option is
size is between 40 and 60 pixels, step size is between 5 and 7 pixels and the strain filter is
between 15 and 19 data points.
Acoustic Emission data is collected on a Micro II system from Mistras (Physical
Acoustics). A resonant Nano30 sensor with a natural frequency of 300 kHz is connected
to a 2/4/6 pre-amplifier which is set to 20 dB for the SiCf-SiCm. A petroleum based gel is
used as a couplant between the AE sensor and the specimens. The sensor is enclosed in a
soft polymer cover to increase its resilience to damage during sample bursts. For
SiCf-SiCm composites, the system is set to record in a high hit rate mode which prevents
it from getting oversaturated with signals. Hardware settings were determined from a
pencil lead break tests (without a Neilsen Shoe) and are set at 50 PDT, 150 HDT and 350
HLT and a threshold of 55 dB. The reference gain energy is set to 20 dB by default. An
analog filter boundaries are set to 100 kHz and 1 MHz. Waveform are recorded at a
sampling rate of 5 million samples per second, pre-trigger of 100 μs and a signal length
of 3 kilobits which corresponds to a total waveform duration of 614 μs. To reduce the
number of irrelevant signals, a hit pre-filter is set to exclude signals with counts of 3 or
less. For additional information on AE system setup refer to Appendix C.
2.4 Open-end Burst Rig Validation
Pressurization of a fluid is a desired way to produce hydrostatic pressure since it
is the closest to imitating internal pressurization from Helium and fission gas in the
nuclear fuel claddings. Pellet cladding mechanical interaction (PCMI) is not considered
in this study. Sealing the oil inside of an apparatus and a sample becomes increasingly
challenging with a higher number of parts in a device and with increasing maximum
between the many components of the burst rig. The bladder tube was found to be flexible
enough to largely deform inside of the apparatus. Yet, it was desired to understand
whether the bladder tube produces a uniform pressure application along the sample’s
internal surface. For that reason validation tests had been performed.
Two photoelasticity experiments on a transparent polycarbonate surrogate sample
were conducted. The sample was placed between two polarizing glass pieces illuminated
by a monochromatic white light. The polarizing glass produces isochromatic fringes in
some transparent materials. When load is increased on a material, the fringe patterns
change based on the amount of stress received. Because the sample and the bladder were
both transparent, the fringes could be seen in both materials. In one test, the fringes were
observed in the sample and in the bladder simultaneously. In a second test, a piece of
paper was placed between the bladder and the sample to reveal the fringes developed in
the sample only. A CCD camera, one of the DIC cameras, was used to record the
changes in fringe patterns.
To quantitatively map the uniform pressure application, validations tests were
performed on aluminum tubes. In the first test it was desired to know whether the
pressure was applied uniformly around the sample. A 28 mm long 6061 aluminum tube
was equipped with two sets of strain gauges which were installed on the outside wall,
Figure 2.5. Two of the gauges were measuring strains in hoop direction and the other
two gauges were measuring axial strains. The gauges were installed in the middle section
Figure 2.5 Aluminum validation sample with two sets of strain gauges bonded to the surface.
Using the bladder tube as an oil seal offers no limitations in regards to the length
of a sample that can be tested (other than practical restrains). To verify that the length of
a sample has no impact on uniformity of the pressure application, a 304 mm long 2024
aluminum tube was tested. It had three strain gauges installed in the hoop direction at
locations 50.8 mm, 152.4 mm, and 254 mm along the axis of the tube as shown in Figure
2.6. One stain gauge was glued in an axial direction placed at 152.4 mm. Axial forces
were minimized by positioning the alignment bars so the samples could be rotated freely
by hand before the start of the tests. Both samples had 12.73 mm OD and 7.92 mm ID.
Figure 2.6 Aluminum validation sample with three strain gauges bonded in hoop direction and one strain gauge in an axial direction (away from the camera).
For all the tests done on the open-end and the closed-end burst rigs a thick-walled
pressure vessel equation was used to calculate sample stresses on the outer (Equation 2.1)
and inner surfaces (Equation 2.2):
𝜎𝑜= 2 ∙ 𝑟𝑖 2∙ 𝑃
(𝑟𝑜2− 𝑟𝑖2) Equation 2.1
𝜎𝑖 = 𝑃𝑟𝑜2+ 𝑟𝑖2 𝑟𝑜2− 𝑟
𝑖2 Equation 2.2
where 𝜎𝑜 is the stress on the outer surface, 𝜎𝑖 is the stress on the inside surface, 𝑟𝑖 and 𝑟𝑜
are the internal and the external radii and 𝑃 is the internal pressure. The outside wall
stress was used to produce the stress-strain plots since the strains were all measured on
the outer wall of the samples. The inside wall stress is import to consider since the
maximum stress experienced by the samples is on the inside wall.
plugged end. The plug shape matched the end of the drill which has a standard point
angle of 135°. A metal cone was bonded to the open end of the tube to provide the
necessary axial support. Because of the mixed stress state in the material near the plug,
the DIC system was used to measure the strain map along the axial direction of the
sample.
To validate the experimental results, a 2D Finite Element (FE) model was
generated in Abaqus 6.13. For this study a 2D axisymmetric model was created with
isotropic and homogeneous material properties. Small strain approximation was used for
these models as the stains in this material were measured below 1%. The Young’s
modulus and the Poisson’s ratio were assumed to be 2.20 GPA and 0.31, based on
literature data. The dimensions of the sample used for the model are shown in Figure 2.7
where the dashed line represents the axis of symmetry. The boundary conditions are
shown in Figure 2.8. Horizontal line in the plugged section, which is 1 inch long, was
restricted to move in Y direction only. On the other end of the sample a vertical line was
restricted to move in X direction only representing the supporting force of the sample
support cone. A pressure load of 6.9 MPa was applied on all of the internal surfaces of
the sample. The finite element mesh was adjusted to minimize element distortion and is
shown in Figure 2.9. An eight node, biquadratic axisymmetric quadrilateral element
(CAX8R) was used with a reduced integration. The approximate element size was 0.51
Figure 2.7 Dimensions of the end plug FE model.
Figure 2.8 Boundary conditions for the end plug FE model.
Figure 2.9 Mesh of the closed-end FE model.
2.6 Lip Effect Study
In the burst rigs described previously, a tested sample is supported and aligned in
the rig with an adapter lip, Figure 2.2 (c), which is a thin wall extrusion located between
the sample and the bladder. The lip also serves as a stress relief for the sample edges,
breakoff. The DIC system was used to measure the strain variations along the axis of the
samples. Polycarbonate plastic was chosen as the specimen material due to its high
ductility and low elastic modulus producing high strain values. Large deformations can
be measured more accurately with the DIC system. The samples had 12.9 mm outside
diameter, 9.7 mm inside diameter and a length of 63.5 mm. After correlating the stress
generated by the internal pressure to the strains measured by the DIC, a typical
stress-strain curve was plotted to estimate the Young’s modulus for the FE model.
A 3D finite element model was produced in Abaqus to simulate strains generated
by the pressure. A quarter of a sample was modeled to reduce the computational time.
The specimen dimensions in the model matched exactly the dimensions of the samples.
The left, right and top sides of the sample were constrained to move in their perspective
plains only, as shown in Figure 2.10. The internal surface of the sample was set to be
pressurized to 6.8 MPa except the area that is protected by the lip. The sample mesh was
generated using a 20 node quadratic brick type hexahedra elements (C3D20R) with a
reduced integration. The approximate size of an element was 0.2 mm as shown in Figure
2.11. The resulting strain values were plotted along the middle of the model as shown in
Figure 2.10 A 3D model of for the lip study with the boundary conditions.
Figure 2.11 FE model showing path, in red, along which hoop strain values are plotted and the quadratic order elements.
2.7 Testing of SiCf-SiCm Composites
The SiCf-SiCm composite tubes were fabricated by General Atomics (GA). The
samples were produced from Tyranno SA3 silicon carbide fibers coated with pyrolytic
Right side
Top Side
Lip Zone Left Side
Pressurized Zone
architecture A was slightly hoop reinforced with axial tow reinforcement and architecture
B was strongly hoop reinforced. The samples of A architecture were tested in both the
open-end (32 mm long) and the closed-end (63 mm long) burst tests. Architecture B
samples were tested in the closed-end burst test (63mm long) only. All samples had been
speckled for the DIC measurement and one sample for each of the test-architecture
configurations had been equipped with 2 sets of strain gauges in the middle of the
pressurized zone. In some tests, the samples were loaded straight to failure while most of
the tests were loaded in several loading-unloading cycles gradually increasing the peak
pressure. The end plugs for the closed-end burst tests were produced by depositing a
30 MPa shear stress J-B Weld epoxy. The cylindrical shape of the plug had a flat surface
on the inside of the samples, similar to the plug shown in Figure 2.4 (b). Stress-strain
curves were plotted for each of the samples. The stress was calculated using a thick wall
pressure vessel equation. When using DIC, strain values were measured in the middle
portion of the pressurized zone which was away from adapter lips and the support cone
for the end plug samples. A typical surface area monitored by DIC was approximate
30% of the outside surface area.
2.8 Acoustic Emission Analysis
When analyzing AE, it has been noticed that with increased amount of damage in
SiCf-SiCm, some AE parameters tend to change throughout a test, especially amplitude.
To study the amount of change of these parameters, a 152 mm long SiCf-SiCm sample
was tested in an open-end burst rig to a pressure above PLS with several
loading-unloading cycles. As a part of another concurring test, after each cycle the sample was
contact with the sample. Two Nano30 sensors were placed on either end of the sample
after each cycle with an average distance between the sensors of 85.6 mm. Four or more
pencil lead break tests were performed on the sample before the first loading and between
each of the loading cycles. An average of each of the AE parameters collected from the
CHAPTER 3. RESULT AND DISCUSSION
3.1 Open-end Burst Rig Validation
Images captured during the photoelasticity tests are shown in Figure 3.1. The
photoelasticity is based on a birefringence phenomenon observed in some transparent
materials. When light rays pass through a material it exhibits two refractive indices. It is
these two refractive indices that have a direct relationship to the two principal stresses
and to the fringes observed in the material. At a constant thickness, the isochromatic
fringes represent contours of maximum shear stress. The higher the fringe density, the
higher maximum shear stress level a test material experiences. The fringe pattern and
fringe order observed in these tests showed two stress peaks and a stress relief profile
near adapter lips. Mosley [12] analytically derived the stress profile of the pressurized
area along the axis of a sample, as shown in Figure 3.2. Images from the photoelasticity
tests show that the hydraulic oil produces a very similar stress profile as the one derived
by Mosley. There was a small stress overshoot near the ends of the pressurized area
before leveling off at a constant value. Images (a), (b), and (c) show the stress in the
bladder and in the sample when image (d) shows the stress just in the sample when the
Figure 3.1 Photoelasticity test showing a specimen at (a) 0 MPa, (b) 0.9 MPa psi, (c) at 4.1 MPa and (d) at 4.1 MPa with the bladder covered.
The bladder behavior in the initial stages of a pressure loading was observed
through the sample. Figure 3.1 (b) shows the bladder tube starting to deform during an
initial contact with the internal surfaces of the specimen. This is indicated by a darkened
surface on the sample. At this point there was still a large radius between the adapter lip
and the sample. However, further increase in pressure deformed the bladder more
a b c
d
isochromatic fringe
Figure 3.2 Mosley's analytical solution of the stress distribution where βm represents a non-dimensional length with the βm=0 representing the beginning of the pressurized zone [12].
To further evaluate the pressure uniformity, aluminum samples instrumented with
strain gauges were tested. For the short, 28 mm long, sample the strains measured around
the circumference and the calculated strains came very close together. Hoop strain values
for one of the loading cycles are shown in Figure 3.3. An averaged difference between
the two hoop gauges was 18.6 με and the two axial gauges was 8.0 με. Calculated
Young’s modulus and the averaged Poisson’s ratio for this material measured at 71.55
GPa and 0.33 respectively, or 3.85% and 0% away from the published values. The
percent error between the measured pressure and the pressure calculated from the sample
strains is shown in Figure 3.4 and it is superpositioned against the oil pressure. At low
pressures, the error values were large due to low strain values of aluminum. However,
when the pressure was increased, the error values decreased. The graph shows that the
majority of the error is within ±5%. When the pressure was increased to 62 MPa, the
error value decreased to be between -1% and +4%. Similar calculation for the strains
showed the percent error between the calculated and measured strain was within ±3% for
the higher pressures. The errors were primarily attributed to the combined noise level
from the strain gauges, and the acquisition system. Despite this noise, the results showed
a uniform pressure loading around the sample and with a good agreement with the
analytical solution.
Figure 3.4 Percent error between measured pressure and the calculated pressure received by the 28 mm long sample.
For the longer, 304 mm long, aluminum tube, the same analysis was performed.
The Young’s modulus and the Poisson’s ratio calculated to be 73.49 GPa and 0.32, which
are 0.55% and 3% away from the published values. The percent error values for the last
two high pressure loadings are shown in Figure 3.5. Similar to the 28 mm long sample,
for the majority of the high pressure loading, the errors were within ±3%. Most
importantly, the strain differences between the 3 hoop strain gauges were only 3 με at 62
MPa. The percent error between the calculated and measured strain values was within
±3%. These results proved that the bladder method can hydrostatically load a sample
Figure 3.5 Percent error between measured pressure and the calculated pressure received by the 304 mm long sample.
3.2 Bladder Compressibility Effect
Pressurized oil naturally produces a uniform pressure on all the contacted
surfaces. However, the addition of a bladder may affect the uniformity. It is important to
consider the compressibility impact of the polymer bladder that may alter the amount of
stress transferred to a sample.
Consider a solid block of material that is rigidly constrained from all sides except
the top surface which has a pressure force with a resultant force P, Figure 3.6 (a). This
approximation is meant to mimic and simplify actual loading condition experienced by
![Figure 1.1 Matrix crack redirected paralell to the loading by a weak fiber-matrix bond [12]](https://thumb-us.123doks.com/thumbv2/123dok_us/8419379.1387107/19.612.178.434.72.336/figure-matrix-crack-redirected-paralell-loading-fiber-matrix.webp)
![Figure 1.2 Typical stress-strain curve for CMC during cycling loading [12].](https://thumb-us.123doks.com/thumbv2/123dok_us/8419379.1387107/23.612.189.430.247.460/figure-typical-stress-strain-curve-cmc-cycling-loading.webp)
![Figure 1.3 Representation of an AE signal showing major features [30].](https://thumb-us.123doks.com/thumbv2/123dok_us/8419379.1387107/30.612.183.427.75.330/figure-representation-ae-signal-showing-major-features.webp)
![Figure 1.4 Representative graph of Kaiser and Felicity effects [30].](https://thumb-us.123doks.com/thumbv2/123dok_us/8419379.1387107/31.612.193.421.219.474/figure-representative-graph-kaiser-felicity-effects.webp)