Article Paper
1
Corrosion Susceptibility of Surface Etched Ultrafine
2
Grained Titanium and its Alloys under Physiological
3
Environment
4
Daniel Fernandes1,2,*, Egor Prokofiev3, Ruslan Valiev3,4, Ana Almeida1, Emilia Monteiro1 and
5
Carlos Elias1
6
1Biomaterials Laboratory, Instituto Militar de Engenharia, Rio de Janeiro, RJ 22290-270, Brazil.
7
2School of Engineering, University of South Australia, Mawson Lakes, SA 5095, Australia.
8
3Saint Petersburg State University, St. Petersburg 199034, Russia.
9
4Institute of Physics of Advanced Materials, Ufa State Aviation Technical University, Ufa 450000, Russia
10
*Correspondence: djfernandes@ime.eb.br; Tel.: +55-21-2546-7080 (ext. 6848)
11
12
Abstract: 1)Background: The objective was to evaluate the corrosion resistance of different
13
commercially pure ultrafine-grained (UFG) titanium and its alloys with acid etched surface
14
processed by equal-channel angular pressing (ECAP); 2) Methods: Coarse-grained and UFG
15
titanium samples were investigated using polarization resistance technique. Surface characteristics
16
of the native oxidized layer were evaluated by TEM and XRD. Electrochemical tests were under
17
physiological electrolyte at a rate of 1 and 10 mV/s. Weight loss tests were performed after
18
immersion into HCl solution for up to 3 years; 3) Results: UFG titanium was less susceptible to
19
corrosion which was identified under lower rates and at higher polarization resistance than its
20
coarse grain counterparts. Titanium Grade 2 and Grade 4 demonstrated similar corrosion
21
susceptibility. Titanium Grade 5 revealed a thin and tightly adhered native oxide layer with
22
adequate corrosion resistance; 4) Conclusions: ECAP process imposed a more compact and adhered
23
oxidized layer. Surface etching techniques delivered a thicker native TiO2 layer, being both grain
24
refinement and surface etching techniques responsible for the improved corrosion resistance of
25
Titanium samples under physiological environment after 3 years of observation. Keywords:
26
corrosion 1; plastic deformation 2; titanium 3; titanium alloys 4; surface treatment 5.
27
28
1. Introduction
29
The outstanding corrosion resistance of titanium, as well as its adequate biocompatibility, made
30
it one of the most widely used biomaterial for biomedical osseointegrated implants [1]. Beyond that,
31
other highlighted properties include Young’s modulus closer that of the bone, low density, good
32
ductility, and a positive effect on skeletal cell agents imposed by the microenvironment provided by
33
titanium oxide layer. Surfaced oxide layer is also responsible for improvements in corrosion
34
resistance and thus in the reduction of metallic ions release [2,3].
35
The main concern of titanium under biomedical service is its high friction coefficient and severe
36
abrasive wear, with great susceptibility to fretting wear and substantial amounts of titanium debris
37
production [4]. The metallic debris release comes from the fracture and surface abrasion, which is
38
able to break down the passive layer, leading to metallic deposition in local tissue and toxic ions
39
release. This potential toxicity may conduct to neurological pathologies, particle induced
40
inflammation and hypersensitivity in human body, and therefore it should be avoided [2].
41
With the purpose to prevent ions release using of commercially pure (CP) titanium are preferred
42
instead of titanium alloys. Although titanium ASTM Grade 5 (G5) has excellent mechanical strength
43
due to the presence of alloying elements like Al and V, these elements are designed as toxic. Their
44
release is currently expected as a consequence of corrosion degradation and is considered hazardous
45
due to cumulative effects into biological environments [5]. In that framework, different processing
46
techniques have been developed to improve the mechanical performance of CP titanium ASTM
47
Grade 4 (G4), which are absented of the toxic alloying elements. Development of severe plastic
48
deformation (SPD) techniques [6] has made it possible to form ultrafine-grained (UFG)
49
microstructure in CP titanium, which resulted in enhancement of its mechanical strength, fatigue
50
properties and promote improvements into passive oxidized layer features. [5,7-12]. Equal-channel
51
angular pressing (ECAP) and continuous ECAP-Conform (ECAP-C) impose grain refinement for
52
each pass of sample through the die, whereas a higher shear strain state is gradually achieved, i.e.
53
equiaxial grain/subgrain sizes between 150-300 ηm with high-angle boundaries were identified after
54
4-6 passes [6].
55
Innumerous experiments have been performed to analyze the corrosion resistance of the
Ti-56
based alloys [13]. Different methods included surface treatments by anodic oxidation, acid immersion
57
or any other procedure that can modify surface energy and its interactions with environment. Surface
58
etching is employed to promote improvements into surface energy, with ability to boost
59
characteristics of surface roughness and its wettability, which are both relevant during attempts to
60
enhance biocompatibility [3,10,12]. Even processing techniques mainly aimed for grain refinement of
61
titanium materials can induce changes in corrosion resistance due to alterations of the characteristics
62
of the passive oxidized layer [3]. The objective of this work was to evaluate the corrosion resistance
63
of distinct types of UFG titanium samples processed by ECAP technique and compare them with its
64
coarse-grained state with and without surface etching treatment.
65
2. Materials and Methods
66
Different commercially pure titanium and its alloys in shape of 3 mm in height cylinders were
67
prepared for the study. Table 1 presents sample conditions used for investigation including
68
composition, processing condition, grain size and surface features. The details of ECAP and
ECAP-69
Conform processing and optimal regimes of UFG structure formation have been described in
70
previous studies [6,8].
71
Three millimeters in height cylinders were metallographically prepared. Etching was performed
72
by HCl and H2SO4 solution with the same concentration, temperature and time interval. Specimens
73
were ultrasonically cleaned in acetone and dried at room temperature. An additional sample of each
74
group with 100 μm in thickness was prepared for TEM analysis under electropolishing preparation
75
in an electropolisher TenuPol-5 (Struers, Denmark) with perchloric acid, ethanol and butanol solution
76
under a current of 1A. The process was electronically halted when the smallest possible hole was
77
achieved. Surface etched specimens could not be analyzed by TEM since electropolishing preparation
78
interferes into characteristics of the morphology and topography of its surfaces.
79
Phases identification of the passive oxidized layer was performed by an X-ray diffractometer
80
X´Pert 2 (Panalytical, Netherlands) with a Cu-Kα (λ= 1.5405 Å) at 40 KV and 40 mA at grazing
81
incidence set up at θ=0.5o, in the 2θ range 20-70o with a step size of 0.05o.
82
Electrochemical analysis was performed by a potentiostat instrument (PGSTAT302N, Autolab)
83
using a three-electrode flat cell with saturated calomel electrodes as reference and platinum as
84
counter one. Samples were inlayed in Teflon with a standardized exposed surface of 1 mm², at a
85
distance of 1 cm from the reference electrode and 10 cm from the counter electrode. Specimens were
86
immersed into a cell filled with 100 mL of physiological solution (pH=7.4) of NaCl (0.9 mol L-1) as
87
electrolyte at 37°C for 2 hours. Polarization curves were acquired under an open circuit potential at
88
a scan rate of 1 and 10 mVs-1 for all specimens evaluated and merged for further comparison and
89
calculations.
90
Weight loss analysis was performed at cylinder shape specimens with diameter of 6 mm and 4
91
mm in height, which were weighted before and after immersion into 1M HCl solution for 1440 hours
92
(2 months). Samples were reweighted 3 years after the first measurement.
93
3. Results
94
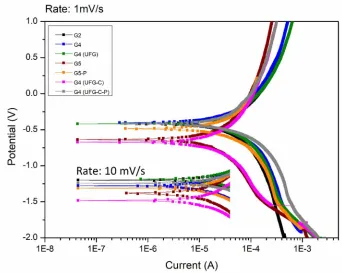
The corrosion potential identified in figure 1 revealed that UFG-C samples have the lowest
95
size 25 μm (G4) to 0.3-0.15μm after refinement (table 1). Open circuit potential (table 2) was read as
97
0.174V from G2, 0.166V from UFGCP, 0.152V from G4, 0.151V from UFG, 0.128V from G5,
-98
0.110V from G5P and 0.098V from UFGC. Tafel intersections, based on polarization curves, βc=
-99
0.042 Vdec-1A-1cm-2 and βa= 0.025 Vdec-1A-1cm-2 from G2 samples. Gradients from G4 specimens
100
showed βc= -0.034 Vdec-1A-1cm-2 and βa= 0.027 Vdec-1A-1cm-2 and reflect similar slopes in cathodic
101
curve. Both curves reached corrosion potential at similar current density and corrosion potential
102
(Table 2), although G4 samples reached equilibrium between oxidation and reduction at higher
103
potential (-0.399V vs -0.421 V), being the slope of anodic curve greater in G4 samples. Critical current
104
density was higher recorded at G4 and G4h samples, polarization resistance was larger at G5-P and
105
IFG-C, and corrosion rate was lowest at UFG-C and highest at G2 samples. TEM identified oxide
106
layers with qualitative variances in organization (figure 2), at different thickness from samples as
107
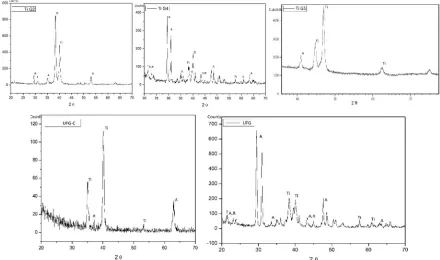
UFG (51.045ηm), G2 (12.102ηm), UFG-C (10.515 ηm) and G4 (5.17 ηm). Diffractograms (figure 3) at
108
grazing incidence exposed mainly the anatase variant of titanium oxide layer. Weight loss (figure 4)
109
demonstrated minor differences among samples with the lowest loss from UFG and UFG-C-P and
110
largest from G2 samples after 2 months. After 3 years, all samples revealed weight increase, except
111
G5 samples where a loss of 0.98% was identified.
112
3.1. Figures, Tables and Schemes
113
115
Figure 2. TEM micrographs revealed the morphology of the native oxide layer. The thickness of the
116
film is indicated.
117
Figure 4. Weight loss test after 2 months and an additional follow up of 3 years. Samples were immersed into
119
1M HCl solution. Values are given in (%) and positive values indicated weight gain.
120
121
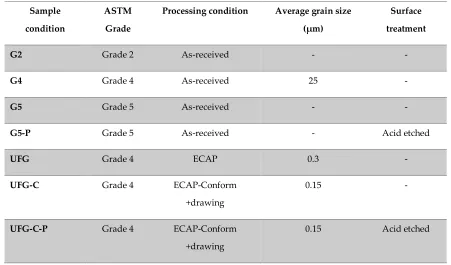
Table 1. Sample condition of titanium its alloys used for investigation.
122
123
Sample
condition
ASTM
Grade
Processing condition Average grain size
(µm)
Surface
treatment
G2 Grade 2 As-received - -
G4 Grade 4 As-received 25 -
G5 Grade 5 As-received - -
G5-P Grade 5 As-received - Acid etched
UFG Grade 4 ECAP 0.3 -
UFG-C Grade 4 ECAP-Conform
+drawing
0.15 -
UFG-C-P Grade 4 ECAP-Conform
+drawing
Table 2 – Open circuit potential (OCP), corrosion current density (Icorr), corrosion potential (ECorr),
124
Tafel coefficients (βa and βc), primary passive potential (Epp), critical current density (Ic), polarization
125
resistance and corrosion rate from different samples. Rate was settled at 1 mV/s.
126
4. Discussion
127
Different behavior was observed in the superimposed polarization curves showed in Figure 1.
128
Although the corrosion potential brings limited information regarding corrosion rates, results
129
revealed that C samples has the lowest potential followed by G5, G5-P, G4, G2, UFG and
UFG-130
C-P.
131
Open circuit potential (Table 2) was read as -0.174V from G2, -0.166V from UFG-C-P, -0.152V
132
from G4, -0.151V from UFG, -0.128V from G5, -0.110V from G5-P and -0.098V from UFG-C.
133
Comparison among the several open potentials revealed that the most chemically stable values were
134
acquired from UFG, however the samples became significantly instable (-0.166V) after etching surface
135
treatment. The OCP value from UFG-C-P was the lowest measured, except for the value from G2
(-136
0.174V). This behavior was not observed in titanium alloys, where potential was increased after acid
137
etching surface treatment, becoming the etched G5 titanium chemically more stable (-0.128V) than
138
samples before surface etching (-0,110V). Regarding the stability of coarse-grained CP Ti samples, G4
139
specimens showed higher OCP value (-0,152V) than G2 (-0.174V), which could be explained in terms
140
of the higher continuous tightly adherent oxide layer expected (Figure 2), besides higher levels of
141
oxygen, nitrogen and iron are also expected. Although UFG specimens showed the thicker native
142
film (Figure 2), its corrosion behavior was less affected by changes in microstructure than observed
143
in UFG-C specimens, since OCP values were similar (difference of just 0.001V) when compared to its
144
coarse-grained state.
145
Tafel intersections were defined basing on polarization curves. Tafel constants were βc= -0.042
146
Vdec-1A-1cm-2 and βa= 0.025 Vdec-1A-1cm-2 from G2 samples. Gradients from G4 specimens showed
147
βc= -0.034 Vdec-1A-1cm-2 and βa= 0.027 Vdec-1A-1cm-2 and reflect similar slopes in cathodic curve. Both
148
curves reached corrosion potential at similar current density and corrosion potential (Table 2),
149
although G4 samples reached equilibrium between oxidation and reduction at higher potential
(-150
0.399V vs -0.421 V), being the slope of anodic curve greater in G4 samples.
151
Comparing cathodic and anodic curves (Figure 1), differences in slopes can be identified and
152
reflect straightly in Tafel constants. Despite the initial overlap of cathodic curves from alloys, they
153
assumed different slopes when potential is raised by potentiostat, being UFG-C cathodic slope lower
154
than the others. However, the tangent related to the UFG samples etched was lower, the specimen
155
took more time to be polarized, which justify the right slide of curve when compared to mainly of
156
the other titanium samples. After passivation oxide film is being formed, UFG-C presented a
157
passivation ability under lower potentials. This reflects in anodic constants, which slope was almost
158
vertical, while an angle of almost 45° with a slope of 1 was identified from at least 3 of the other
159
Samples OCP
(V)
Icorr
(A/cm²)
ECorr
(V)
βa βc Epp Ic Polarization
Resistance
(ohm/cm²)
Corrosion
rate (10-3
mm/year)
G2 -0,174 4,69E-05 -0,421 0,025 -0,042 0.568 3.905E-4 145,579 0,807
G4 -0,152 4,82E-05 -0,399 0,027 -0,034 0.979 5.311E-4 136,748 0,829
G4h -0,151 4,47E-05 -0,421 0,026 -0,032 0.972 6.367E-4 139,248 0,769
G4(UFG) -0,098 2,01E-05 -0,674 0,034 -0,016 0.892 3.019E-4 235,374 0,347
G4(UFG-P) -0,166 4,07E-05 -0,421 0,036 -0,022 0.976 3.167E-4 143,908 0,701
G5 -0,128 2,20E-05 -0,638 0,039 -0,019 -0.016 9.729E-5 251,397 0,379
samples, with exception of the etched UFG-C and UFG one. Gradients before and after surface
160
etching revealed similar behavior under cathodic and anodic reactions (Table 2), although corrosion
161
potentials were whole slid up after etching. Corrosion current density (Icorr) was less affected by
162
surface treatment. Comparing electrochemical behavior of samples submitted to ECAP and its
163
coarse-grained counterparts, UFG-C specimens showed a lower resistance to corrosion than
cold-164
worked UFG samples. UFG demonstrated an upper slide in comparison to coarse-grained G4 curve,
165
while UFG-C curve stayed below G4 curve. In this perspective, UFG samples had a slightly higher
166
corrosion potential (Ecorr) than G4 and UFG-C.
167
The influence of changes in substructure and chemical stability of titanium alloys are widely
168
reported [3,14,15]. Although grain boundaries are commonly expected areas susceptible to corrosion
169
attack, the increased chemical stability of UFG might be related to improvements into protective
170
passivation film achieved due to changes in surface energy (Figure 2). Somehow, the influence of
171
microstructure evolution on film stability can be related to the degree of achieved refinement, since
172
UFG-C specimens demonstrated limited ability to increase its corrosion resistance, although the
173
current density was similar and corrosion potential stayed close to observed in UFG specimens.
174
Discussion upon the degree of grain refinement of cold worked samples in comparison with UFG-C
175
is found in [12].
176
Weight loss analysis was performed as usually shown in literature [14] with a couple months of
177
follow up and an additional observation was performed after a lengthy period of immersion in acid
178
solution. A follow up of 3-year after a regular immersion for 2 months can reveal a precise insight of
179
the dynamic process of corrosion based on its weight change. Figure 4 shows weight alterations after
180
2 and 38 months. In 2 months all samples demonstrated similar weight loss, varying from 1.02%
181
(UFG-C) to 1.2% (G2). Slight difference was observed between specimens before and after surface
182
etching (0.02%-0.06%), while the difference between work hardening of G4 specimens (UFG-C and
183
UFG) was less than 0.04%.
184
The primary passive potential (Table 2) determines when passivation is initiated. From our
185
results, oxidized layer was first formed in Ti-6Al-4V samples (G5 and G5-P) and specimens
(G4-UFG-186
C), being the values of potential close to G2 samples. Similar values of potential were recorded from
187
ultrafine-grained (UFG and UFG-C), etched UFG-C-P, and G4 specimens. Although values stayed in
188
a close range, the greater potential was recorded in G4 specimens.
189
The values of critical current density (Table 2) were smaller in specimens where passivation
190
process was firstly initiated, as seen in Ti-6Al-4V samples (G5 and G5-P). Similar current was
191
measured in ultrafine-grained (UFG and UFG-C) and coarse-grained G2. Higher current densities
192
were recorded in G4h and G4 samples. These results confirm the importance of the oxide layer in
193
corrosion protection of the specimens, since the intensity of current density was lower in samples
194
passivated at lower potentials and higher at samples passivated later at higher potentials.
195
Polarization (Table 2) was also in alignment with the discussed above relation between current and
196
passivation, once the resistance to electrons passage is in opposite relation to the values of current
197
density measured.
198
Coarse-grained non-etched G4, UFG, UFG-C-P and G2 samples demonstrated lower
199
polarization resistance which have allowed the highest current density passaged, being the specimen
200
passivated at highest potential. Etched Ti-6Al-4V (G5-P) and UFG-C showed higher resistance to
201
polarization, which is, however, lower than that of non-etched Ti-6Al-4V (G5) samples. The highest
202
resistance to current passage from Ti-6Al-4V (G5) was in coherence with the lowest density of
203
measured current (Ic) and the lowest potential of passivation (Epp) described above.
204
Comparing the values of primary passivation and the density of current with the weight loss
205
presented above (after 2 months), minor differences were observed in the loss among the specimens
206
evaluated. However, differences were below 0.01%, UFG-C specimens demonstrated the lowest
207
weight loss with identical values from observed in UFG and UFG-C-P specimens. The greatest loss
208
was identified in G2 samples, which susceptibility might be related to changes in tightly adherence
209
of oxide layer, as seen in Figure 2, where even before immersion into acid solution G2 samples had
210
observed in UFG-C and G4 specimens, with a thickness of 10.515 ηm and 5.170 ηm, respectively. G5
212
samples demonstrated the densest and the thinnest (2.504 ηm) oxide film. UFG samples
213
demonstrated the thickest (51.045 ηm) film, however, with a not so tightly dense layer. These findings
214
are in line with our results regarding polarization curves, polarization resistance, corrosion rate and
215
weight loss. At grazing incidence, the native titanium layer was identified as mainly formed by
216
anatase variant (Figure 3).
217
Corrosion rate extrapolations in mm/year confirmed the projections of the least weight loss of
218
UFG-C and a higher rate of coarse grain G2 samples. Considering the short range of difference among
219
weight loss discussed above, weight loss extrapolations were in accordance with the intermediate
220
values of G5 alloy (G5-P and G5), UFG-C-P, UFG and a higher weight loss of coarse-grained G2. It
221
was interesting to observe that etching surface treatment had slight increased the weight loss after 2
222
months of immersion into acid solution when comparisons were performed with its counterpart
223
coarse-grained specimens.
224
The 3-year long-term weight loss followed up and was necessary since extrapolations would not
225
be able to predict the possible weight increase due to the passive layer thickening that comes after
226
oxidation process. After 38 months of immersion in HCl, our results revealed a weight increase in all
227
specimens, except Ti-6Al-4V alloy (G5) which had a decrease of 0.98% (Figure 4). Mass increase was
228
observed at a very close range of 0.7%-0.98%, even between UFG and coarse grain (G4) specimens.
229
Identical mass increase was found in UFG-C, coarse grain G2, UFG-C-P and etched Ti6Al4V (G5-P)
230
samples. Changes in weight loss behavior were identified in acid etched surface treated specimens
231
when follow up was extended from a regular analysis of 2 months to a period of 38 months. In this
232
perspective, etched samples demonstrated the highest increase of mass and reflect improvements in
233
passive film stability and enhancements into corrosion resistance. This finding was not observed after
234
2 months, what implies that an extended follow up was necessary to diagnose any changes in
235
passivation oxide layer features, including its thickness and/or alterations in its continuous tight
236
adherence. Weight gain is predictable in cases of oxidation process by different laws [16-18], and
237
oxidation reactions are adequate descripted by Cabrera-Mott model and its modifications [19].
238
Oxidation kinetics can be assumed in terms of inverse logarithm law during film grow [17], although
239
the effectiveness of a conventional thermally activated diffusion model is limited and unable to
240
interpret low temperatures differential data [20]. Oxidation process under low temperature
241
environment can be predicted in terms of weight gain by parabolic and linear laws with one third of
242
the power expected at temperatures of 400-500°C [16]. At 600°C mass gain was also predicted by a
243
linear law [18], being the first power of time, and weight gain considered adequate when small
244
amount of mass has already been deposited as a consequence of oxide film thickening [16]. In terms
245
of Carrera-Mott model, weight gain [17] was compared with our results and the thickness of oxide
246
layer was extrapolated in keeping with aluminum kinetics [20] due to absence of models with
247
titanium under identical thermodynamic conditions. This extrapolation reflected an increase of
248
passive layer in rage of 0.624-0.682 ηm. In consonance with the weight gain presented above, oxide
249
layer thickening of cold worked and coarse grain G4 titanium was identical (0.624 ηm), followed by
250
etched Ti6Al4V (0.643 ηm), UFG-C (0.655 ηm), coarse grain G2 (0.666 ηm) and UFG-C-P (0.682 ηm).
251
Despite thickness increase was similar, etched surfaces demonstrated improved potential of enhance
252
passive layer organization in terms of weight gain and oxide film dimensions.
253
The positive influence of processing techniques in polarization behavior was observed at
254
samples subjected to ECAP. From ultrafine-grained materials (UFG and UFG-C) standpoint, any
255
improvement in corrosion resistance that might arise from the ultrafine microstructure sounds
256
controversial. Generally, any increase in the grain boundary density would be expected to decrease
257
the corrosion resistance of the material, since boundaries might work as preferable sites for nucleation
258
of pits. On the other hand, our results showed that the corrosion susceptibility was reduced, the
259
higher relative boundary-related material volume improved the weight gain, oxide layer thickness
260
and polarization behavior become ruled by terms of passivation kinetics. Therefore, a faster and
261
stable passive layer was formed by reason of the high relative grain boundary related volume of
262
also identified in Figure 2 where a denser, thicker and a more homogeneous oxide layer was
264
addressed to surface of ultrafine grained samples. Apart from grain boundary influence, dislocations
265
might also be considered during our discussion. Dislocations are identified as high energy linear
266
defects with greater susceptibility for pits nucleation, with an opposite effect from its density inside
267
the grains and the overall corrosion resistance [14]. Confronting ultrafine-grained samples (UFG and
268
UFG-C), severe plastic deformed specimens with less expected dislocations inside grains revealed an
269
advantage in corrosion resistance since a small amount of boundaries can be resulted from dislocation
270
interactions, while well-defined extremely fine subgrains are usually observed instead of clustered
271
dislocations in high density [3,5,11,12,14]. Moreover, it is believed that the passive film was formed
272
at surface crystalline defects in these samples, and a higher number of nucleation sites was available
273
to make possible a denser and more compact oxidized layer onto material surface [3,14]. This finding
274
agrees with our results, where a predominant anatase (Figure 3) film was denser and tightly adhered
275
onto ultrafine-grained specimens (Figure 2).
276
5. Conclusions
277
Ultrafine-grained titanium obtained by ECAP techniques has improved the corrosion resistance
278
in comparison to its coarse-grained counterparts. Commercially pure grade 2 and 4 showed similar
279
corrosion susceptibility. Ti-6Al-4V alloy (grade 5) showed a thin and tightly adhered native oxide
280
layer. Surface etching revealed improvements in corrosion resistance. Ultrafine-grained titanium
281
samples showed a more compact and adhered oxidized layer which is responsible for the higher
282
resistance demonstrated by these samples.
283
Author Contributions: Dr Fernandes conceived this study, prepared manuscript, interpreted and discussed
284
results with Dr Elias, Dr Valiev and Dr Prokofiev. Dr Elias and Dr Valiev previewed, reviewed and approved
285
the final version. SPD samples were processed by Dr Valiev and Dr Prokofiev. Surface etching was performed
286
by Dr Elias and Dr Fernandes. Miss Almeida and Miss Monteiro acquired polarization curves, revised its
287
calculations and executed XRD at grazing incidence.
288
Funding: This research was funded by [Carlos Chagas Foundation for Research Support from the Rio de Janeiro
289
State (FAPERJ)] grant numbers [E-26/201.759/2015, E-26/201.828/2015, E-26/010.001.262/2015], [Russian Ministry
290
for Education and Science] contract number [14.B25.31.0017], [Saint Petersburg State University] grant number
291
[6.37.204.2016] and [National Council of Technological and Scientific Development from Brazilian Government
292
(CNPq)] grant number [168807/2017-3].
293
Acknowledgments: The authors thank Dr Chia-Hui Lu for acquisition of TEM micrographs.
294
Conflicts of Interest: The authors declare no conflict of interest.
295
References
296
1. Williams DF. Titanium for medical applications. In: Brunette DM, Tengvall P, Textor M, Thomsen P. (eds)
297
2001 Titanium in Medicine. Springer-Verlag: Berlin, Germany, 2001; pp. 13-24, ISBN 9783642564864.
298
2. Liu, H.; Xu, Q.; Zhang, X.; Wang, C.; Tang, B. Wear and corrosion behaviors of Ti6Al4V alloy biomedical
299
materials by silver plasma immersion ion implantation process. Thin Solid Films 2012, 521, 89-93.
300
3. Balyanov, A.; Kutnyakova, J.; Amirkhanova, N.A.; Stolyarov, V.V.; Valiev, R.Z.; Liao, X.Z.; Zhao, Y.H.;
301
Jiang, Y.B.; Xu, H.F.; Lowe, T.C.; Zhu, Y.T. Corrosion resistance of ultra fine-grained Ti. Scripta Mater 2004,
302
51, 225-229.
303
4. Billi, F.; Onofre, E.; Ebramzadeh, E.; Palacios, T.; Escudero, M.L.; Garcia-Alonso, M.C. Characterization of
304
modified Ti6Al4V alloy after fretting–corrosion tests using near-field microscopy. Surf Coat Tech 2012, 212,
305
134-144.
306
5. Fernandes, D.J.; Elias, C.N.; Valiev, R.Z. Properties and Performance of Ultrafine Grained Titanium for
307
Biomedical Applications. Mater Res 2015, doi: http://dx.doi.org/10.1590/1516-1439.005615.
308
6. Valiev, R.Z.; Zhilyaev, A.P.; Langdon, T.G. Bulk Nanostructured Materials: Fundamentals and Applications, 1st
309
7. Semenova, I.P.; Valiev, R.Z.; Yakushina, E.B.; Salimgareeva, G.H.; Lowe, T.C. Strength and fatigue
311
properties enhancement in ultrafine-grained Ti produced by severe plastic deformation. J Mater Sci 2008,
312
43, 7354-7359.
313
8. Gunderov, D.V.; Polyakov, A.V.; Semenova, I.P.; Raab, G.I.; Churakova, A.A.; Gimaltdinova, E.I.; Sabirov,
314
I.; Segurado, J.; Sitdikov, V.D.; Alexandrov, I.V.; Enikeev, N.A.; Valiev, R.Z. Evolution of microstructure,
315
macrotexture and mechanical properties of commercially pure Ti during ECAP-conform processing and
316
drawing. Mater Sci Eng A 2013, 562, 128–136.
317
9. Dyakonov, G.S.; Zemtsova, E.; Mironov, S.; Semenova, I.P.; Valiev, R.Z.; Semiatin, S.L. An EBSD
318
investigation of ultrafine-grain titanium for biomedical applications. Mater Sci. Eng A 2015, 648, 305–310.
319
10. Nazarov, D.V.; Zemtsova, E.G.; Solokhin., A.Y.; Valiev, R.Z.; Smirnov, V.M. Modification of the Surface
320
Topography and Composition of Ultrafine and Coarse Grained Titanium by Chemical Etching.
321
Nanomaterials 2017 7, 15, doi:10.3390/nano7010015.
322
11. Elias, C.N.; Fernandes, D.J.; de Biasi, R.S. Comparative study of compressive and fatigue strength of dental
323
implants made of nanocrystalline Ti Hard and microcrystalline Ti G4. Fatigue Fract Engng Mater Struct 2017,
324
40, 696-705.
325
12. Elias, C.N.; Fernandes, D.J.; Resende, C.R.S.; Roestel, J. Mechanical properties, surface morphology
326
andstability of a modified commercially pure high strength titanium alloy for dental implants. Dent Mater
327
2015, 31, e1-e13.
328
13. Drevet, R.; Aaboubi, O.; Benhayoune, H. In vitro corrosion behavior of electrodeposited calcium phosphate
329
coatings on Ti6Al4V substrates. J Solid State Electrochem 2012, 16, 3069-3077.
330
14. Kim, H.S.; Yoo, S.J.; Ahn, J.W.; Kim, D.H.; Kim, W.J. Ultrafine grained titanium sheets with high strength
331
and high corrosion resistance. Mater Sci Eng A 2011, 528, 8479-8485.
332
15. Liu, X.; Chu, P.K.; Ding, C. Surface modification of titanium, titanium alloys, and related materials for
333
biomedical applications. Mat Sci Eng R 2004 47, 49–121.
334
16. Takayama, I. Development of oxidation protective coating for titanium. Nippon Steel Tech Report 1994, 62,
335
57-63.
336
17. Gemelli, E.; Camargo, N.H.A. Oxidation kinetics of commercially pure titanium. Materia 2007, 12, 525-531.
337
18. Zhang, W.; Sadedin, D.R.; Reuter, M.A.; McCallum, J.C. The de-oxidation of partially oxidized titanium by
338
hydrogen plasma. Mater Forum 2007, 31, 76-83.
339
19. Zhdanov, V.P.; Kasemo, B. Cabrera–Mott kinetics of oxidation of nm-sized metal particles. Chem Phys Lett
340
2008, 452, 285-288.
341
20. Ermoline, A.; Dreizin, E.L. Equations for the Cabrera–Mott kinetics of oxidation for spherical nanoparticles.
342
Chem Phys Lett 2011, 505, 47-50.
343
21. Valiev, R.Z.; Sabirov, I.; Zhilyaev, A.P.; Langdon, T.G. Bulk nanostructured metals for innovative