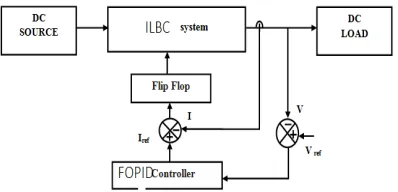
Coupled Inductor based Interleaved Boost Converter for Enhanced Time Response
Full text
Figure


Related documents
bodies in infected goats was determined; (ii) in a second study, the NH tracer potential to detect antibodies in samples obtained from vaccinated goats was evaluated; and (iii) in
IndexTerms — Orthogonal frequency division multiplexing peak-to-average power ratio, tone injection (TI), peak interference-to-carrier ratio, power
BioMed Central Page 1 of 8 Virology Journal Open AccessShort report Bioinformatic evidence for a stem loop structure 5' adjacent to the IGR IRES and for an overlapping gene in the
Vol 11, Issue 11, 2018 Online 2455 3891 Print 0974 2441 FORMULATION AND EVALUATION OF LIDOCAINE HYDROCHLORIDE CHEWABLE TABLET HARSHADA ANIL KASAR1*, ASISH DEV1, SUBHAKANTA DHAL3
Keywords: Material degradation, austenitic stainless steel, martensite, neutron diffraction, magnetic non- destructive material testing, lifetime prediction, low cycle
2 shows the query entered from the given dataset taken and then finds the mean squared error value.Figs.3, 4, 5, 6 shows the number of iterations taken place
2.Edge Detection and Boundary Estimation (a) Original color image (b) Image after converting to grayscale (c) Image after converting to binary (d) Canny Edge Detection Output (e)
The high order of negative inter- ference (high O/C) apparent in these crosses indicates a positive correlation be- tween recombinations in adjacent regions. The value of O/C
