Importance of Software Metrics to Quantify of
Software Design and Source Code Quality
Siddharth Jain, Pradeep Baniya Asstistant. Professors, IIST-II
Abstract-The vital role of software process improvement is ability to measure the current state of system process and establishing improvement priorities. In addition, the focus on process improvement has increased the demand for software measures, or metrics with which to manage the software process. The need for such metrics is particularly acute when an organization is adopting new technologies and establishing best practices for the organization. This paper mainly addresses the needs of development and implementation of a new suite of metrics for OO design. Metrics developed based on literature survey, while contributing the software development processes, having serious criticisms, which includes the lack of a theoretical base this suggests that software metrics need to be constructed with a stronger degree of theoretical and mathematical rigor. Given the extant software metrics literature, this paper has a three fold agenda: 1) To propose metrics that are constructed with a firm basis in theoretical concepts in measurement and the ontology of objects, and which incorporate the experiences of professional software developers; 2) Evaluate the proposed metrics against established criteria for validity 3) Present empirical data from commercial projects to illustrate the characteristics of these metrics on real applications, and suggest ways in which these metrics may be used.
Keywords: OOD (Object Oriented Design) Metrics, RFC (Response for a Class), WMC (Weighted Methods per Class), DIT (Depth of Inheritance Tree).
1.INTRODUCTION
Given the central role that software development plays in the delivery and application of information technology, managers are increasingly focusing on process improvement in the software development area [1]. This emphasis has had two effects. The first is that this demand has spurred the provision of a number of new and/or improved approaches to software development, with perhaps the most prominent being object orientation (OO). Second, the focus on process improvement has increased the demand for software measures, or metrics with which to manage the process. These include: lacking a theoretical basis, lacking in desirable measurement properties, being insufficiently generalized or too implementation technology dependent, and being too labor-intensive to collect. [2] Wand and Weber, the theoretical base approach applies for the metrics was the ontology of Bunge.[4] Six design metrics are developed, and then analytically evaluated against Weyuker’s proposed set of measurement principles. [7] An automated data collection tool was then developed and implemented to collect an empirical sample of these metrics at two field sites in order to demonstrate their feasibility and suggest ways in which project managers may use these metrics for process improvement.
2. RESEARCH PROBLEM
3. THEORY BASE FOR OOD METRICS
While there are many object oriented design (OOD) methodologies, one that reflects the essential features of OOD is presented by Booch.[3] He outlines four major steps involved in the object-oriented design process.
1) Identification of Classes (and Objects): In this step, key abstractions in the problem space are identified and labeled as potential classes and objects.
2) Identify the Semantics of Classes (and Objects): In this step, the meaning of the classes and objects identified in the previous step is established, this includes definition of the life-cycles of each object from creation to destruction.
3) Identify Relationships Between Classes (and Objects):
In this step, class and object interactions, such as patterns of inheritance among classes and pattems of visibility among objects and classes (what classes and objects should be able to “see” each other) are identified.
4) Implementation of Classes (and Objects): In this step, detailed internal views are constructed, including definitions of methods and their various behaviors. Whether the design methodology chosen is Booch’s OOD[6] or any of the several other methodologies, design of classes is consistently declared to be central to the OO paradigm. As card et al. suggest, class design is the highest priority in OOD [6], and since it deals with the functional requirements of the system, it must occur before systems design (mapping objects to processors, processes) and program design (reconciling of functionality using the target languages, tools, etc.) Given the importance of class design, the metrics outlined in this paper specifically are designed to measure the complexity in the design of classes. The limitation of this approach is that possible dynamic behavior of a system is not captured. Since the proposed metrics are aimed at assessing the design of an object oriented system rather than its specific implementation, the potential benefits of this information can be substantially greater than metrics aimed at later phases in the life-cycle of an application. In addition, implementation-independent metrics will be applicable to a larger set of users, especially in the early stages of industry’s adoption of OO before dominant design standards emerge.
4. EMPIRICAL DATA COLLECTION
As defined earlier, a design encompasses the implicit ideas designers have about complexity. These viewpoints are the empirical relations [10] RI,R P,. . . R, in the formal definition of the design D. The viewpoints that were used
in constructing the metrics presented in this paper were gathered from extensive collaboration with a highly experienced team of software engineers from a software development organization. This organization has used OOD in more than four large projects over the past five years. Though the primary development language for all projects at this site was C++, the research aim was to propose metrics that were language independent. As a test of this, later data were collected at two new sites which
used different languages.
The metrics proposed in this paper were collected using automated tools developed for this research at two different organizations which will be referred to here as Site A and
Site B. Site A is a software vendor that uses OOD in their
development work and has a collection of different C++ class libraries. [5] Metrics data from 634 classes from two C++ class libraries that are used in the design of graphical user interfaces (GUI) were collected. Both these libraries were used in different product applications for rapid prototyping and development of windows, icons and mouse-based interfaces. Reuse across different applications was one of the primary design objectives of these libraries. These typically were used at Site A in conjunction with
other C++ libraries and traditional C-language programs in the development of software sold to UNIX workstation users. Site B is a semiconductor manufacturer and uses the Smalltalk programming language for developing flexible machine control and manufacturing systems. Metrics were collected on the class libraries used in the implementation of a computer aided manufacturing system for the production of VLSI circuits. Over 30 engineers worked on this application, after extensive training and experience with object orientation and the Smalltalk environment. Metrics data from 1459 classes from Site B were collected.
5. RESULTS
5.1 Metric 1: Weighted Methods per Class (WMC) Definition: Consider Class C1 with methods M1... Mn, that are defined in the class. Let c1, c2... cn, be the complexity of the methods. Then:
If all method complexities are considered to be unity, then WMC = n, the number of methods.
Theoretical Basis: WMC relates directly to Bunge's
definition of complexity of a thing, since methods are properties of object classes and complexity is determined by the cardinality of its set of properties. The number of methods is, therefore, a measure of class definition as well as being attributes of a class, since attributes correspond to proper ties.
5.1.1 Viewpoints
1) The number of methods and the complexity of methods involved is a predictor of how much time and effort is required to develop and maintain the class. 2) The larger the number of methods in a class the greater
the potential impact on children, since children will inherit all the methods defined in the class.
3) Classes with large numbers of methods are likely to be more application specific, limiting the possibility of reuse.
Table 1. Summary Statistics of WMC
5.1.2 Empirical Data
The histograms (Figure. 1 and Figure. 2) and summary statistics (Table 1) from both sites are shown above.
5.1.3 Interpretation of Data:
The most interesting aspect of the data is the similarity in the nature of the distribution of the metric values at Site A and B, despite differences in 1) the nature of the application; 2) the people involved in their design; and 3) the languages (C++ and Smalltalk) used. This seems to suggest that most classes tend to have a small number of methods (0 to lo), while a few outliers declare a large number of them. Most classes in an application appear to be relatively simple in their construction, providing specific abstraction and functionality.
5.2 Metric 2: Depth of Inheritance Tree (DIT)
Definition: Depth of inheritance of the class is the DIT metric for the class. In cases involving multiple inheritances, the DIT will be the maximum length from the node to the root of the tree. Theoretical Basis: DIT relates to Bunge’s notion of the scope of properties. DIT is a measure of how many ancestor classes can potentially affect this class.
5.2.1 Viewpoints
1. The deeper a class is in the hierarchy, the greater the number of methods it is likely to inherit, making it more complex to predict its behavior.
2) Deeper trees constitute greater design complexity, since
3) The deeper a particular class is in the hierarchy, the more methods and classes are involved. Greater the potential reuse of inherited methods.
5.2.2 Empirical Data
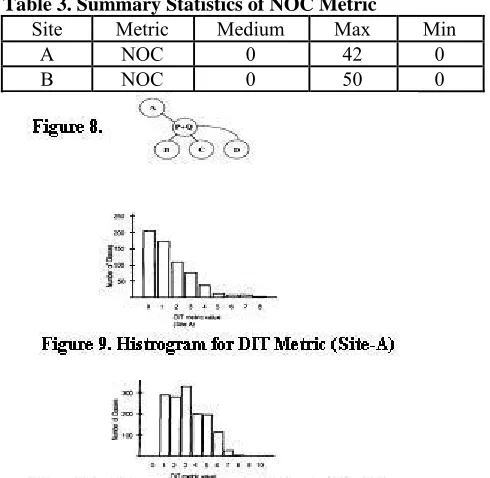
The histograms are shown in Figure. 9 and 10, and the summary statistics are shown in Table 2 (all metric values are integers).
Table 2. Summary Statistics of DIT Metric
Site Metric Medium Max Min
A DIT 1 8 0
B DIT 13 10 0
5.2.3 Interpretation of Data
Both Site A and B libraries have a low median value for the DIT metric. This suggests that most classes in an application tend to be close to the root in the inheritance hierarchy. By observing the DIT metric for classes in an application, a senior designer or manager can determine whether the design is “top heavy” (too many classes near the root) or “bottom heavy” (many classes are near the
bottom of the hierarchy). At both Site A and Site B, the library appears to be top heavy, suggesting that designers may not be taking advantage of reuse of methods through inheritance. Note that the Smalltalk application has a higher depth of inheritance due, in part, to the library of reusable classes that are a part of the language. For example, all classes are subclasses of the class “object”. Another interesting aspect is that the maximum value of DIT is rather small (10 or less). One possible explanation is that designers tend to keep the number of levels of abstraction to a manageable number in order to facilitate comprehensibility of the overall architecture of the system. Designers may be forsaking reusability through inheritance for simplicity of understanding. This also illustrates one of the advantages of gathering metrics of design complexity in that a clearer picture of the conceptualization of software systems begins to emerge with special attention focused on design tradeoffs. Examining the class at Site A with a DIT value of 8 revealed that it was a case of increasingly specialized abstractions of a graphical concept of control panels. The class itself had only 4 methods and only local variables, but objects of this specialized class had a total of 132 methods available through inheritance. Designing this class would have been a relatively simple task, but the testing could become more complicated due to the high inheritance. 21 resources between design and testing could be adjusted accordingly to reflect this.
5.3 Metric 3: Number Of Children (NOC)
Definition: NOC = number of immediate subclasses
subordinated to a class in the class hierarchy. Theoretical Basis: NOC relates to the notion of scope of properties.It is a measure of how many subclasses are going to inherit the methods of the parent class.
Inter
5.3.1 Viewpoints:
1) Greater the number of children, greater the reuse, since inheritance is a form of reuse.
2) Greater the number of children, the greater the likelihood of improper abstraction of the parent class. If a class has a large number of children, it may be a case of misuse of sub-classing.
3) The number of children gives an idea of the potential influence a class has on the design. If a class has a large number of children, it may require more testing of the methods in that class.
5.3.2 Empirical Data:
The summary statistics from both sites are shown in table 3
Table 3. Summary Statistics of NOC Metric
Site Metric Medium Max Min A NOC 0 42 0 B NOC 0 50 0
5.3.3 Interpretation of Data
Like the WMC metric, an interesting aspect of the NOC data is the similarity in the nature of the distribution of the metric values at Site A and B. This seems to suggest that classes in general have few immediate children and that only a very small number of outliers have many immediate subclasses. This further suggests that designers may not be using inheritance of methods as a basis for designing classes, as the data from the histograms show that a majority of the classes (73% at Site A and 68% at Site B) have no children. Considering the large sample sizes at both sites and their remarkable similarity, both the DIT and NOC [8] data seem to strongly suggest that reuse through inheritance may not be being fully adopted in the design of class libraries, at least at these two sites. One explanation for the small NOC [8] count could be that the design practice followed at the two sites dictated the use of shallow inheritance. A different explanation could be a lack of communication between different class designers and therefore that reuse opportunities are not being realized.
Whatever the reason, the metric values and their distribution provide designers and managers with an opportunity to examine whether their particular design philosophy is being adhered to in the application. An examination of the class with 42 subclasses at Site A was a GUI-command class for which all possible commands were separate subclasses. Further, none of these subclasses had any subclasses of their own. Systematic use of the NOC [8] metric could have helped to restructure the class hierarchy to exploit common characteristic of different commands (e.g., text commands, mouse commands etc.).
5.4 Metric 4: Coupling Between Object classes (CBO) Definition: CBO for a class is a count of the number of other classes to which it is coupled.
Theoretical Basis: CBO relates to the notion that anobject is coupled to another object if one of them acts on the other, i.e., methods of one use methods or instance variables of another. As stated earlier, since objects of the same class have the same properties, two classes are coupled when methods declared in one class use methods or instance variables defined by the other class.
5.4.1 Viewpoints
1) Excessive coupling between object classes is detrimental to modular design and prevents reuse. The more independent a class is, the easier it is to reuse it in another application.
2) In order to improve modularity and promote encapsulation, inter-object class couples should be kept to a minimum. The larger the number of couples, the higher the sensitivity to changes in other parts of the design, and therefore maintenance is more difficult. 3) A measure of coupling is useful to determine how
complexes the testing of various parts of a design are likely to be. The higher the inter-object class coupling, the more rigorous the testing needs to be.
5.4.2 Empirical Data
The histograms and summary statistics from both sites are shown in Table 4.
Table 4. Summary Statistics of CBO Metric
Site Metric Medium Max Min
A CBO 0 8 0
B CBO 9 234 0
5.4.3 Interpretation of Data
which will be counted as an interaction in the CBO metric [9]. Simple scalars will not be defined as C++ classes, and certainly control flow entities are not objects in C++. Thus, CBO values are likely to be smaller in C++ applications. However, that does not explain the similarity in the shape of the distribution. One interpretation that may account for both the similarity and the higher values for Site B is that coupling between classes is an increasing function of the number of classes in the application. The Site B application has 1459 classes compared to the 634 classes at Site A. It is
possible that complexity due to increased coupling is a characteristic of large class libraries. This could be an argument for a more informed selection of the scale size (as measured by number of classes) in order to limit coupling. The low median values of coupling at both sites suggest that at least 50% of the classes are self-contained and do not refer to other classes (including super-classes). Since a fair number of classes at both sites have no parents or no children, the limited use of inheritance may be also response for the small CBO [9] values. Examination of the outliers at Site B revealed that classes responsible for managing interfaces have high CBO [9] values. These classes tended to act as the connection point for two or more subsystems within the same application. At Site A,
the class with the highest CBO value was also the class with the highest NOC value, further suggesting the need to re-evaluate that portion of the design. The CBO metric can be used by senior designers and project managers as a relative simple way to track whether the class hierarchy is losing its integrity, and whether different parts of a large system are developing unnecessary interconnections in inappropriate places.
5.5 Metric 5: Response For a Class (RFC)
Definition: RFC = IRS( where RS is the response set forthe class
Theoretical Basis: The response set for the class can beRS = {MI Uall i {Ri}
where { R,} = set of methods called by method i and { M} = set of all methods in the class. The response set of a class is a set of methods that can potentially be executed in response to a message received by an object of that class 26. The cardinality of this set is a measure of the attributes of objects in the class. Since it specifically includes methods called from outside the class, it is also a measure of the potential communication between the class and other classes.
5.5.1 Viewpoints
1) If a large number of methods can be invoked in response to a message, the testing and debugging of the class becomes more complicated since it requires a greater level of understanding required on the part of the tester.
2) The larger the number of methods that can be invoked from a class, the greater the complexity of the class. 3) A worst case value for possible responses will assist in
appropriate allocation of testing time.
5.5.2 Empirical data:
The summary statistics from both sites are shown in Table 5.
Table 5. Summary Statistics of RFC Metric
Site Metric Medium Max Min A RFC 6 120 0 B RFC 29 422 3
5.5.3 Interpretation of Data:
The data from both Site A and Site B, suggest that most classes tend to able to invoke a small number of methods, while a few outliers maybe be most profligate in their potential invocation of methods. This reinforces the argument that a small number of classes may be responsible for a large number of the methods that executed in an application, either because they contain many methods (this appears to be the case at Site A) or that they call many methods. By using high RFC valued classes as structural drivers, high test coverage can be achieved during system test. Another interesting aspect is the difference in values for RFC between Site A and B. Note that the median and maximum values of RFC at Site B are higher than the RFC values at Site A. As in the case of the CBO metric, this may relate to the complete adherence to object oriented principles in Smalltalk which necessitates extensive method invocation, whereas
C++’ incremental approach to object orientation gives designers alterative to message passing through method inv~cation.~N’ ot surprisingly, at Site B high RFC value classes performed interface functions within the application. Since there are a number of classes that are standalone (i.e. no parents, no children, no coupling) the RFC values also tend to be low. Again, the metrics collectively and individually provide managers and designers a basis for examining the design of class hierarchies.
5.6 Metric 6: Lack of Cohesion in Methods (LCOM) Definition: Consider a Class C1 with n methods MI, M2.,
Mn. Let {Ij} = set of instance variables used by method
Theoretical Basis: This uses the notion of degree of similarity of methods. The degree of similarity for two methods MI and M2 in class C1 is given by:
σ()={I1}∩{I2}
where {I1}and{I2} instance variables used by MI and M2.
5.6.1 Viewpoints
1) Cohesiveness of methods within a class is desirable, since it promotes encapsulation.
2) Lack of cohesion implies classes should probably be split into two or more subclasses.
3) Any measure of disparateness of methods helps identify flaws in the design of classes.
4) Low cohesion increases complexity, thereby increasing the likelihood of errors during the development process.
5.6.2 Empirical Data
The summary statistics from both sites are shown in Table 6.
Table 6. Summary Statistics of LCOM Metric
Site Metric Medium Max Min A LCOM 0 200 0
B LCOM 2 17 0
5.6.3 Interpretation of Data
At both sites, LCOM median values are extremely low, indicating that at least 50% of classes have cohesive methods. In other words, instance variables seem to be operated on by more than one method defined in the class. This is consistent with the principle of building methods around the essential data elements that define a class. The Site A application has a few outlier classes that have low cohesion, as evidenced by the high maximum value 200. In comparison, the Site B application has almost no outliers, which is demonstrated by the difference in the shape of the two distributions. A high LCOM value indicates disparateness in the functionality provided by the class. This metric can be used to identify classes that are attempting to achieve many different objectives, and consequently are likely to behave in less predictable ways than classes that have lower LCOM values. Such classes could be more error prone and more difficult to test and could possibly be disaggregated into two or more classes that are better defined in their behavior. The LCOM metric can be used by senior designers and project managers as a relatively simple way to track whether the cohesion principle is adhered to in the design of an application and advice changes, if necessary, at an earlier phase in the design cycle.
5.6.4 Summary
The Metrics Suite and Booch OOD Steps:
The six metrics are designed to measure the three implementation steps in Booch’s definition of OOD. Each metric is one among several that can be defined using Bunge’s ontological principles. But inclusion in the proposed suite is influenced by three additional criteria: 1) ability to meet analytical properties 2) intuitive appeal to practitioners and managers in organizations and 3) ease of automated collection. Reading down the columns of Table VII, WMC, DIT and NOC relate to the first step (identification of classes) in OOD since WMC is an aspect of the complexity of the class and both DIT and NOC directly relate to the layout of the class hierarchy. WMC and RFC [8] capture how objects of a class may “behave”
when they get messages. For example, if a class has a large WMC or RFC, it has many possible responses (since a potentially large number of methods can execute). The LCOM metric relates to the packaging of data and methods within a class definition provides a measure of the cohesiveness of a class. Thus WMC, RFC and LCOM relate to the second step (the semantics of classes) in OOD. A benefit of having a suite of metrics is that there is the potential for multiple measures of the same underlying construct”. The RFC and CBO metrics also capture the extent of communication between classes by counting the inter-class couples and methods external to a given class, providing a measure of the third step (the relationships between classes) in OOD.
5.6.5 Future Directions:
The proposed OOD metrics have already begun to be used in a few leading edge organizations. Sharble and Cohen report on how these metrics were used by Boeing Computer Services to evaluate different OO methodologies [9]. Two implementations of an example system, one is using responsibility based methodology and another using data driven methodology were analyzed using these six metrics.
The application of these metrics is in studying differences between different OO languages and environments. As the RFC and DIT data suggest, there are differences across the two sites that may be due to the features of the two target languages. However, despite the large number of classes examined (634 at Site A and 1459 at Site B), only two sites were used in this study, and therefore no claims are offered as to any systematic differences between the C++ and Smalltalk environments. This is suggested as a future avenue where OO metrics can help establish a preliminary benchmarking of languages and environments. The most obvious extension of this research is to analyze the degree to which these metrics correlate with managerial performance indicators, such as design, test and maintenance effort, quality and system performance and managerial decision making.
6. CONCLUSION AND REMARKS
To analyze some of the issues related to this problem having some concluding remarks:
1. By using the metrics suite they can identify areas of the application that may require more rigorous testing and areas that are candidates for redesign.
2. Using the metrics in this manner, potential flaws and other leverage points in the design can be identified and dealt with earlier in the design develop-test-maintenance cycle of an application.
3. Yet another benefit of using these metrics is the added insight gained about trade-offs made by designers between conflicting requirements such as increased reuse (via more inheritance) and ease of testing (via a less complicated inheritance hierarchy).
the idea is to use measurement to improve the process of software development.
This set of six proposed metrics is presented as the first empirically validated proposal for formal metrics for OOD [9]. By bringing together the formalism of measurement theory, Bunge’s ontology, Weyuker’s evaluation criteria and empirical data from professional software developers working on commercial projects, this paper seeks to demonstrate the level of rigor required in the development of usable metrics for design of software systems. Of course, there is no reason to believe that the proposed metrics will be found to be comprehensive, and further work could result in additions, changes and possible deletions from this suite. In particular, the LCOM metric might warrant alterative interpretations since it is currently based on a data-centered view of cohesion. In addition, these metrics may also serve as a generalized solution for other researchers to rely on when seeking to develop specialized metrics or particular purposes or customized environments. Further research in moving OO development management towards a strong theoretical base should help to provide a basis for significant future progress.
REFERENCES
[1] J. Banerjee, H. Chou, J. Garza, W. Kim, D. Woelk, and N. Ballou,
“Data model issues for object oriented applications,” ACM Trans. Oflce Inform. Syst., vol. 5, pp. 3-26, 1987.
[2] V. Basili and R. Reiter, “Evaluating automatable measures of software models,” in IEEE Workshop Quantitative Sofware Models, Kiamesha, S. C. Bilow, “Applying graph-theoretic analysis models to object oriented system models,” in OOPSLA 92 Workshop on Metricsfor ObjectOriented Software Eng., Position Paper, 1992. [3] G. Booch, Object Oriented Design with Applications. Redwood
City, CA: Benjamin/Cummings, 1991.
[4] Bunge, Treatise on Basic Philosophy: Ontology I : The Furniture of the World. Boston: Riedel, 1977.
[5] M. Bunge, Treatise on Basic Philosophv: Ontology /I: The World of Systems. Boston: Riedel. 1979.
[6] D. N. Card and W. W. Agresti, “Measuring software design complexity,” J . Syst. and Sofh+are, vol. 8, pp. 185-197, 1988.
[7] J. C. Chemiavsky and C. H. Smith, “On Weyuker’s axioms for
software complexity measures,” IEEE Trans. Sofn*“z Eng., vol. 17, pp. 636-638, 1991.
[8] V. Chemiavsky and D. G. Lakhuty, “On the problem ofinformation system evaluation,” Automatic Documentation and Mathematical Linguistics, vol. 4, pp. 9-26, 1971.
[9] S. R. Chidamber and C. F. Kemerer, “Towards a metrics suite for object oriented design,” in Proc. 6th ACM Conf. Object Oriented Programming. Syst., Lung. and Applicat. (OOPSLA), Phoenix, AZ, 1991,pp. 197-21