Load Estimation and Prediction on Passport Data
Using Linear Regression
Swati Rana1, Rajan Vohra2
1
Student of M.Tech(Computer Science), 2Head of Department(Computer Science & Information Technology) PDM College of Engineering ,Sector 3A, Sarai Aurangabad, Bahadurgarh, Haryana, India
Abstract - This paper is a small approach in providing solutions to the various problems faced by various passport issuing authorities all across the country and thereby can be proved to be one of the effective measures in analyzing various trends that appear in the issued passports. By analyzing the trends forming in the issued passports, based on the previous records, various passport authorities are able to develop a deeper understanding of the various classes of the population, their need, and behaviour.
The question this work can provide the solution to can be given as follows:
“How many passports are expected to be issued in following
few years based on the record of number of passports issued in
last few years?”
Keywords: Load estimation, Prediction, Regression, Weka tool.
I. INTRODUCTION
A passport is a government-issued travel document that certifies the identity and nationality of its holder for the purpose of international travel. The elements of identity contained in all standardized passports include information about the holder, including name, date of birth, sex and place of birth.
A passport displays nationality, but not the place of residence of the passport holder. The passport holder is normally entitled to re-enter the country that issued the passport in accordance with the laws of that country, and in some instances of gaining a new citizenship, to enter that country for the first time. A passport does not necessarily grant the passport holder entry into any other country, nor to consular protection while abroad or other privileges, such as immunity from arrest or prosecution. Those rights and privileges, if and when applicable, arise from international treaties.
Types of passport:-
Passport (also called tourist passport or regular
passport) - The most common form of passport, issued to citizens and other nationals. Occasionally, children are registered within the parents' passport, making it equivalent to a family passport.
Official passport (also called service passport or
special passport) -Issued to government employees for work-related travel, and their accompanying dependents.
Diplomatic passport - Issued to government officials
and their accompanying dependents for work-related international travel.
Emergency passport (also called temporary passport) -
Issued to persons whose passports were lost or stolen, without time to obtain a replacement. Laissez-passer is also used for this purpose.
Collective passport - Issued to defined groups for
travel together to particular destinations, such as a group of school children on a school trip.
Family passport - Issued to an entire family. There is
one passport holder, and they may travel alone or with one or more other family members. A family member who is not the passport holder cannot use the passport for travel unless accompanied by the passport.
Passport is a global market research database providing statistics, analysis, reports, and surveys and breaking news on industries, countries and consumers worldwide. Passport connects market research to your company goals and annual planning, analysing market context, competitor insight and future trends impacting businesses globally. And with 90% of our clients renewing every year, companies around the world rely on Passport to develop and expand business opportunities, answer critical tactical questions and influence strategic decision making.
A. Definition Of The Problem
The problem defined in this work generally focuses on providing solution to the following question:
How many passports are expected to be issued in following few years based on the record of number of passports issued in last few years?
B. Significance Of The Problem
By analyzing the growth in the number of issued passports, based on the previous records, and thus predicting the estimate of number of passports that can be issued in coming few years, various passport authorities are able to develop a deeper understanding of the various classes of the population, their need, and behaviour. Understanding the requirements of the population through the passports issued in last some years and level of engagement with the authorities, is the key to unlock the strategy of effective marketing.
II. RESEARCH BACKGROUND
The research strategy adopted was to conduct a survey to gather information required to solve the problems specified in the work. The fieldwork was conducted at the sites during the period from February 2014 to May 2014. The main data collection techniques used in this research study were semi-structured interviews, group discussion, participant observation, documentation analysis and questionnaires.
Visit to NIC (National Information Centre) was conducted a few times for the purpose of the system study required in analysis and collection of required data.
Services) office which handles all the information related to passports these days.
The database used for this paper consists of a record of total number of passports issued in 11 years (2000 to 2010).
A. Data Analysis
Primary data was first collected from NIC
(National Information Centre) and TCS (TATA Consultancy Services) office branch which handles the passport information.
The collected data is analyzed to finalize the entire database needed to solve the problem defined. For this work, a record of total number of passports issued in 11 years (2000 to 2010) in 6 cities (Delhi, Mumbai, Kolkatta, Pune, Jaipur and Chandigarh) is taken.
The database attributes are finalized for the
database needed in the proposed work.
Database is then populated and data analysis is
done using the specified tools (Linear Regression using MS Excel in this case).
Results of data analysis is done and described in
detail further in this work.
III. LITERATURE REVIEW
A Research Paper given by Sauli Kivikunnas on June 29th, 2011, surveys trend analysis methods and their applications in process industry. Basic principles of several methods are presented together with known applications in process monitoring, diagnosis and control. In the first place, the methods presented analyse process measurements or some calculated quantities as time series using various pattern recognition methods. Also computationally much lighter methods such as linear regression based methods are included.
This paper has been devoted to presenting some promising approaches to process trend analysis. Although the methodological background varies considerably in the presented approaches, certain common features can be found:
Most of the authors refer to the emulation of
human perception and reasoning capabilities in motivating their work.
Trend analysis operates as a complementing, not
as standalone system and normally provides information to some Reasoning mechanism.
Computational efficiency issues play an essential
role in development towards on-line systems.
No firm design methodologies can be found.
One perspective is to integrate trend analysis with systems providing for adequate temporal reasoning capabilities. Another direction for further research could be the investigation of possibilities of trend information in supervisory control.
In conclusion: Trend analysis has found its place in process monitoring, diagnosis and control but is still in its infancy. To date, only demonstrations with industrial data have been published.
In another Research paper presented by Haixun Wang and Jian Pei (in July 2008), there is a work done on the task of clustering is to identify classes of similar objects among a
set of objects. The definition of similarity varies from one clustering model to another. However, in most of these models the concept of similarity is often based on such metrics as Manhattan distance, Euclidean distance or other Lp distances. In other words, similar objects must have close values in at least a set of dimensions. In this paper, we explore a more general type of similarity. Under the pCluster model we proposed, two objects are similar if they exhibit a coherent pattern on a subset of dimensions. The new similarity concept models a wide range of applications. For instance, in DNA microarray analysis, the expression levels of two genes may rise and fall synchronously in response to a set of environmental stimuli. Although the magnitude of their expression.
As for future work, we believe the concept of similarity in pattern distance spaces has opened the door to quite a few research topics. For instance, currently, the similarity model used in data retrieval and nearest neighbor search is based on value similarity. By extending the model to reflect pattern similarity will benefit a lot of applications and will help in evaluation of degree in similarity in trends.
IV. CONCEPTUAL FRAMEWORK
Since we know that the problem is to identify the record or some data sets from a large database so there is need of some technique to retrieve the data sets. For this, various data mining techniques are used for mining the useful information or records.
A. Data Mining
Data mining (the analysis step of the "Knowledge Discovery in Databases" process, or KDD), an interdisciplinary subfield of computer science, is the computational process of discovering patterns in large data sets involving methods at the intersection of artificial intelligence, machine learning, statistics, and database systems. The overall goal of the data mining process is to extract information from a data set and transform it into an understandable structure for further use. Aside from the raw analysis step, it involves database and data management aspects, data pre-processing, model and inference considerations, interestingness metrics, complexity considerations, post-processing of discovered structures, visualization, and online updating.
Generally, data mining (sometimes called data or knowledge discovery) is the process of analyzing data from different perspectives and summarizing it into useful information - information that can be used to increase revenue, cuts costs, or both. Data mining software is one of a number of analytical tools for analyzing data. It allows users to analyze data from many different dimensions or angles, categorize it, and summarize the relationships identified. Technically, data mining is the process of finding correlations or patterns among dozens of fields in large relational databases.
B. Regression Analysis
adependent variableand one or moreindependent variables. More specifically, regression analysis helps one understand how the typical value of the dependent variable (or 'criterion variable') changes when any one of the independent variables is varied, while the other independent variables are held fixed. Most commonly, regression analysis estimates theconditional expectationof the dependent variable given the independent variables –
that is, theaverage valueof the dependent variable when
the independent variables are fixed. Less commonly, the
focus is on aquantile, or otherlocation parameterof the
conditional distribution of the dependent variable given the independent variables. In all cases, the estimation target is
afunctionof the independent variables called
theregression function. In regression analysis, it is also of interest to characterize the variation of the dependent variable around the regression function which can be described by aprobability distribution.
Regression analysis is widely used forpredictionandforecasting, where its use has substantial
overlap with the field ofmachine learning. Regression
analysis is also used to understand which among the independent variables are related to the dependent variable, and to explore the forms of these relationships. In restricted circumstances, regression analysis can be used to
infercausal relationshipsbetween the independent and
dependent variables.
Regression analysis provides:
Regression analysis can be used to identify the
line or curve which provides the best fit through a set of data points.
This curve can be useful to identify a trend in the
data, whether it is linear, parabolic, or of some other form.
R squared value shown on the graph indicates the
goodness of fit for the line through the given points.
R squared value of 1.0, means that all points lie
exactly on a straight line with no scatter. Knowing X lets you predict Y perfectly.
C. Problem Statement: Load Estimation And
Prediction Using Auto Regression Technique:-
In this problem, we desire to estimate or predict the load or the number of passports that can be issued in coming few years based on the records of the number of passports already issued in last few years. Therefore, for obtaining such results, the records are first fetched from the given database, then the Auto regression technique is applied to predict trends on the basis of past data records to identify whether patterns identified so far are repeating or not. In the given problem, we have the total number of passports issued in 11 years from 2000 to 2010, and then we need to predict the estimate number of passports that are likely to be issued in next 5 years. For obtaining the result, Linear Regression is applied on the given data and as a result, an equation of following type will be generated:
Y= mx + b
The equationy = mx + balgebraically describes a straight
line for a set of data with one independent variable
wherexis the independent variable,yis the dependent
variable,mrepresents the slope of the line, andbrepresents the y-intercept.
The following diagram depicts a brief working description for solving the problem, where the estimated output is the forecast of number of passports to be issued in next 5 years:
Figure 1: Diagrammatic representation of proposed problem.
V. RESULTS AND DISCUSSION
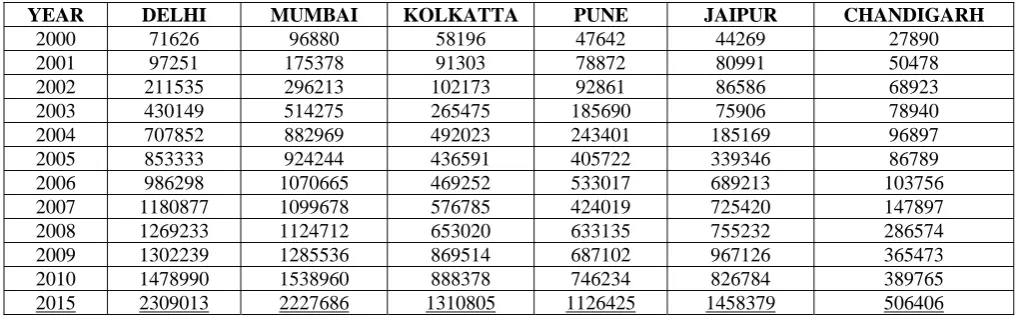
For obtaining the result for the proposed work, a database containing total number of passports issued in 6 cities for 11 years (2000 to 2010) was created. These 6 cities are: Delhi, Mumbai, Kolkatta, Pune, Jaipur and Chandigarh. The database was formed as follows:
Figure 2: Database formed for solving the problem.
On applying the linear regression technique, for the following cities the results were obtained as:-
A. Delhi:
For X-axis taken as the year from 2000 to 2010 and Y-axis taken as number of passports issued in Delhi, the following was obtained
y = 152816x – 136043
y = 2309013 (for x= 16) R² = 0.9775
B. Mumbai:
For X-axis taken as the year from 2000 to 2010 and Y-axis taken as number of passports issued in Mumbai, the following was obtained
y = 140864x – 26137
y = 2227686 (for x= 16) R²=0.953
Figure 4: Graph depicting estimate of number of passports to be issued in next 5 years in Mumbai.
C. Kolkatta
For X-axis taken as the year from 2000 to 2010 and Y-axis taken as number of passports issued in Kolkatta, the following was obtained.
y = 86510x – 73361
y = 1310805 (for x= 16) R² = 0.952
Figure 5 : Graph depicting estimate of number of passports to be issued in next 5 years in Kolkatta.
D. Pune
For X-axis taken as the year from 2000 to 2010 and Y-axis taken as number of passports issued in Pune, the following was obtained.
y = 75573x – 82736
y = 1126425 (for x= 16) R² = 0.9554
Figure 6: Graph depicting estimate of number of passports to be issued in next 5 years in Pune.
E. Jaipur
For X-axis taken as the year from 2000 to 2010 and Y-axis taken as number of passports issued in Jaipur, the following was obtained.
y = 102419x – 180330
y = 1458379 (for x= 16) R² = 0.8958
Figure 7: Graph depicting estimate of number of passports to be issued in next 5 years in Jaipur.
F. Chandigarh
For X-axis taken as the year from 2000 to 2010 and Y-axis taken as number of passports issued in Chandigarh, the following was obtained.
y = 35155x – 56079
y = 506406 (for x= 16) R² = 0.8106
YEAR DELHI MUMBAI KOLKATTA PUNE JAIPUR CHANDIGARH
2000 71626 96880 58196 47642 44269 27890
2001 97251 175378 91303 78872 80991 50478
2002 211535 296213 102173 92861 86586 68923
2003 430149 514275 265475 185690 75906 78940
2004 707852 882969 492023 243401 185169 96897
2005 853333 924244 436591 405722 339346 86789
2006 986298 1070665 469252 533017 689213 103756
2007 1180877 1099678 576785 424019 725420 147897
2008 1269233 1124712 653020 633135 755232 286574
2009 1302239 1285536 869514 687102 967126 365473
2010 1478990 1538960 888378 746234 826784 389765
2015 2309013 2227686 1310805 1126425 1458379 506406 Table 1: Result obtained for the problem: Estimate of number of passports likely to be issued in all cities in next 5 years.
From the above described results for all the different cities, we can obtain an estimate of total number of passports that can be issued in coming few years in each city. The regression technique is used for predicting the load estimate.
Therefore on combining all the results, we get the following table depicting the estimated number of passports that are likely to be issued in next 5 years:
VI. CONCLUSION AND FUTURE SCOPE
Understanding various trends and predicting these trends in advance in passport systems help to know the various aspects of the nation’s growth and development and thereby focussing on the areas of the population which are either blooming or need more attention, Industry analysis across fast moving consumer goods and services, including market performance, market size, company and brand shares and profiles of leading companies and brands; data and analysis on consumer lifestyles, population trends, and socioeconomic analysis for every country, lifestyle and consumer type down to the city level; timely commentary on factors influencing the global, regional and local business environment; surveys exploring consumer opinions, attitudes and behaviors. The most important part discussed in the given project is to estimate or predict the load or the number of passports that can be issued in coming few years based on the number of passports already being issued in last few years. This analysis thus can help the authorities in predicting the nation’s development in coming years.
In future, this project can be useful for various reasons, some of these may be:
Data and analysis on consumer lifestyles,
population trends, and socioeconomic analysis for every country.
Lifestyle and consumer type down to the city
level; timely commentary on factors influencing the global, regional and local business environment.
ACKNOWLEDGEMENT
“It is not possible to write a paper without the assistance and encouragement of other people. This one is certainly no exception.”
On the very outset of this paper, I would like to extend my sincere obligation towards all the personages who have helped me in this endeavor. Without their active guidance, help, cooperation and encouragement, I would not have made headway this research. First and foremost, I would like to express my sincere gratitude to my project guide,
Dr. Rajan Vohra.
I was privileged to experience a sustained enthusiastic and involved interest from his side. This fuelled my enthusiasm even further and encouraged me to boldly step into what was totally dark and unexplored expanse before me. He always fuelled my thoughts to think out of box.
REFERENCES
[1] Dr. Sankar Rajagopal, “Customer Data Clustering using data mining technique”, International Journal of Database Management Systems ( IJDMS ) Vol.3, No.4, November 2011;
[2] Joan Anderson, Antigone Kotsiopulos, “ Enhance Decision Making using data mining: Applications for Retailers”, Journal of Textile and Apparel, Technology and Management (JTATM) Vol 2, Issue 3, Summer 2002;
[3] E. Mooi, M. Sarstedt, “A Concise Guide to Market Research”, DOI 10.1007/978-3-642-12541-6_9,#Springer-Verlag Berlin Heidelberg 2011
[4] M.R. Berthold et al, “Guide to Intelligent Data Analysis”;
[5] Aldenderfer, M.S. and Blashfield, R.K. (1984), Cluster Analysis, Sage Publications, Newbury Park, CA.
[6] Grabmeier, J. and Rudolph, A. (2002) “Techniques of cluster algorithms in data mining” Data Mining and Knowledge Discovery, 6, 303-360;
[7] A.K. Jain, M.N. Murty, and P. J. Flynn,(1999) “Data clustering: a review”, ACM Computing Surveys (CSUR), Vol.31, Issue 3,, 1999. [8] John O. Rawlings, Sastry G. Pantula, David A. Dickey, “Applied
Regression Analysis: A Research Tool, Second Edition”
[9] http://www.laits.utexas.edu/~anorman/BUS.FOR/course.mat/Alex/ [10]
http://www.tutorialspoint.com/data_mining/dm_cluster_analysis.htm [11] http://www.data.gov.in/
[12] http://www.etaal.nic.in/
[13] http://www.marketwatch.com/story/global-e-passport-trends-industry-2014-03-24
[14] http://www.oxfordjournals.org/our_journals/tropej/online/ma_chap2. pdf