187 | a g e P
https://edupediapublications.org/journals/index.php/IJR/ Available online:
Using Data Mining Methods (Neural Network) in Tehran
Fuel Consumption Analysis in Public Transportation
Ali Khosravi moghddam
&
Ali horshad
1Department of industrial management, College of Management and Economics, Tehran Science and
Research branch, Islamic Azad University, Tehran, Iran.
Ph.D. student of Islamic Azad University, Firoozkooh Branch, Iran
2
Review:
To predict demand for oil products using statistical methods such as regression models, auto regression and moving average, from the beginning, the form of the functional relationship between the dependent variable (consumption of the product) and the independent variables (total population, urban population Rural population, gross national product, value added of industries and mines, road and rail transportation section, agricultural sector, product prices, number of diesel fuel buses, number of mini- buses and capacity of power plants ) Be clear. In most cases, for simplicity, linear, quadratic or logarithmic relationships are assumed, although this simplification may lead to false results.
Determining the functional relationship
between the consumption of the product and the factors affecting it is a very complicated problem and it is simply not possible. Therefore, the use of intelligent systems such as neural networks, which in recent years has been considered by many experts, is reasonable. In this study, multi-layer neural networks with retro-reflection learning were used to predict Tehran's gas consumption. In this study, in order to find the predicted values closer to the desired output values and to select the best solution with the lowest MSE, the network problem Neural networks were solved for
various values of the secret layer neurons and educational, evaluation and experimental sets. Since manual selection of numbers in addition to being time-consuming is a possible mistake due to the fact that some values are not selected, in order to avoid this problem, the optimal number of secret layer neurons, the percentage of data related to the training, evaluation and testing sets It was found by MATLAB software and the problem was solved for each of the MLP, MLFF, and MLCF states, which ultimately was the best answer with the lowest MSE of MLFF mode with 8 neurons in the hidden layer, and taking 65 % Of the data for the training set, 16% for evaluation and 19% for the test. Eventually, by the time series of the network, it was trained to predict the next seven courses, and the gasoline consumption rate was
projected until 1400.
Key words: Neural network, prediction, energy consumption
Email*: [email protected]
Introduction
188 | a g e P
https://edupediapublications.org/journals/index.php/IJR/ Available online:
control energy supply and demand indicators more accurately, with more accurate energy consumption planning and proper planning in the direction of consumption. Given the special position of Iran in the field of energy in the Middle East and the world as well as the strategic importance of hydrocarbon resources, the proper management of these resources in the process of production to consumption in the country is of particular importance. The increasing growth of the road fleet has led to a significant portion of the country's energy consumption in the transport sector, and consequently the greenhouse gas and pollutant emissions are also a major cause. Basically, energy consumption in the consumer sector, including the transportation sector, is not a good model, and the reform of the energy consumption pattern in all sectors is indispensable. In Iran, gasoline accounts for a major part of the energy carrier, and its increasing consumption has led many professionals to take major steps in this regard. Due to its widespread use in the national transport network, this fuel has a very important role in the country's economic cycle, and any changes in its production situation and its decline are effective on the country's economic situation.
To predict demand for oil products using statistical methods such as regression models, autoregression and moving average, from the beginning, the form of the functional relationship between the dependent variable (consumption of the product) and the independent variables (total population, urban population Rural population, gross national product, value added of industries and mines, road and rail sectors, agricultural sector,
product prices, number of bus and coach buses, number of minivans and capacity of power plants) . In most cases, for simplicity, linear, quadratic or logarithmic relationships are assumed, although this simplification may lead to false results. Determining the functional relationship between the consumption of the product and the factors affecting it is a very complicated problem and it is simply not possible. Therefore, the use of intelligent systems such as neural networks, which has attracted many experts in recent years, seems reasonable.
Express the issue
189 | a g e P
https://edupediapublications.org/journals/index.php/IJR/ Available online:
its decline will affect the country's economic situation. Therefore, the necessity of providing a model for predicting consumption of this product is very important for future decision making and macro policy of the country.
Nowadays, the use of intelligent technologies has been of great interest in solving complex practical problems in various industrial sectors. These systems collect general rules by computing empirical data. Hence, they are called smart systems. Neural networks are part of a group of intelligent systems that transfer knowledge beyond the data by processing empirical data into the network structure. The greatest advantage of neural networks is their ability to model complex nonlinear relationships, regardless of previous assumptions. Artificial neural networks have features that distinguish them in some applications such as pattern recognition and model in nonlinear and complex systems of other methods. Among these features are: •Learning capability: the ability to adjust network weights using educational data.
•Generalization: After training the network using training data and setting network weights, the network can accept an untrained input and provide an appropriate output.
According to the presentations in this research, it has been attempted to draw a model of neural networks for predicting gas consumption in Tehran's public transport sector.
Research variables
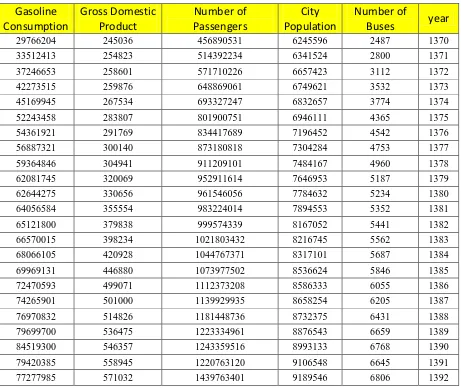
The inputs used in this study are the number of buses, the gross domestic product and population of Tehran, and the number of passengers displaced and the output of research on the amount of gasoline consumed in the public transport sector are as follows:
Number of buses: The number of buses and minivans from 1991 to 2014, which are used for the movement of passengers in the city of Tehran.
GDP: GDP or GDP is the sum of the total value of goods and services produced from 1370 to 1393.
Population of Tehran: The number of people living in Tehran from 1991 to 2014
Number of Passengers Passed: The number of people who used buses and minibuses from 1370 to 1393.
Gasoline consumption: Gasoline consumed by buses and minibuses for passenger transportation from 1991 to 2014
data analysis methods Artificial Neural Networks
Neural networks have been used in recent decades as a powerful tool for prediction in various areas. In this research, multi-layer neural networks with retro-reflective learning are used to predict the demand for subsequent periods.
190 | a g e P
https://edupediapublications.org/journals/index.php/IJR/ Available online:
MLP progressive model with backward or post-propagation pattern of BP with three layers with the highest value of R2-value, minimum value of MSE and minimum value of MAD And is more powerful compared to classical methods, and this demonstrates the superiority of neural networks compared to the old ones.
Collect information
Data on GDP and energy from the Ministry of Energy and the Statistics Center of Iran, Population Information from the Ministry of Industries, Mines and Commerce, and the Statistics Center of Iran, Information on the number of passengers displaced from the bus and data organization The number of Auto waves from the Ministry of Industry, Mining, and Commerce and the Bus Company has been collected.
Table 4-1: Input and Output data of the model
year
Number of
Buses
City
Population
Number of
Passengers
Gross Domestic
Product
Gasoline
Consumption
1370 2487 6245596 456890531 245036 29766204 1371 2800 6341524 514392234 254823 33512413 1372 3112 6657423 571710226 258601 37246653 1373 3532 6749621 648869061 259876 42273515 1374 3774 6832657 693327247 267534 45169945 1375 4365 6946111 801900751 283807 52243458 1376 4542 7196452 834417689 291769 54361921 1377 4753 7304284 873180818 300140 56887321 1378 4960 7484167 911209101 304941 59364846 1379 5187 7646953 952911614 320069 62081745 1380 5234 7784632 961546056 330656 62644275 1381 5352 7894553 983224014 355554 64056584 1382 5441 8167052 999574339 379838 65121800 1383 5562 8216745 1021803432 398234 66570015 1384 5687 8317101 1044767371 420928 68066105 1385 5846 8536624 1073977502 446880 69969131 1386 6055 8586333 1112373208 499071 72470593 1387 6205 8658254 1139929935 501000 74265901 1388 6431 8732375 1181448736 514826 76970832 1389 6659 8876543 1223334961 536475 79699700 1390 6768 8993133 1243359516 546357 84519300 1391 6645 9106548 1220763120 558945 79420385 1392 6806 9189546 1439763401 571032 77277985191 | a g e P
https://edupediapublications.org/journals/index.php/IJR/ Available online:
To predict gas demand using statistical methods such as regression, autoregressive and moving average models, the functional relationship between the dependent variable (diesel consumption) and the independent variables (bus number, GDP, population Tehran and the number of passengers displaced). In most cases, for simplicity, linear relations are assumed to be second or logarithmic, and this simplification may lead to inaccurate results. Determining the
functional relationship between gasoline consumption and the factors affecting it is a very complicated problem and is not easily feasible. The use of intelligent systems such as neural networks, which in recent years has been considered by many experts, seems reasonable. In this section, how to predict gas consumption using the neural network and software maklet.
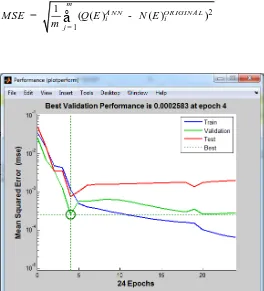
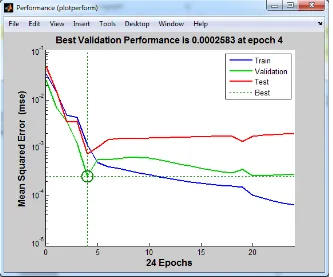
Figure 2 shows the network performance diagram in terms of least squares error (MSE). The definition of the MSE function is given in the following equation:
2
1 1
( ( ) ( ) )
m
A NN OR IGINA L
i i
j
MSE Q E N E
m =
=
å
192 | a g e P
https://edupediapublications.org/journals/index.php/IJR/ Available online:
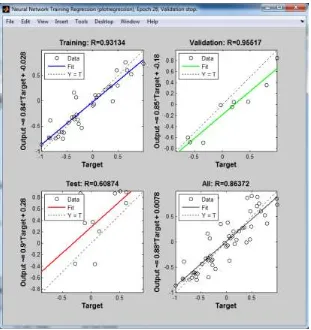
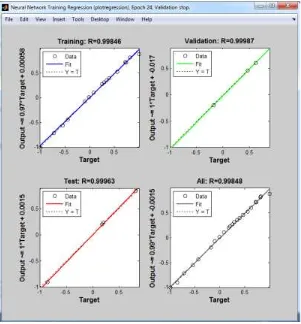
Figure 2 shows the regression results
Fig. 3 Graph of training data
193 | a g e P
https://edupediapublications.org/journals/index.php/IJR/ Available online:
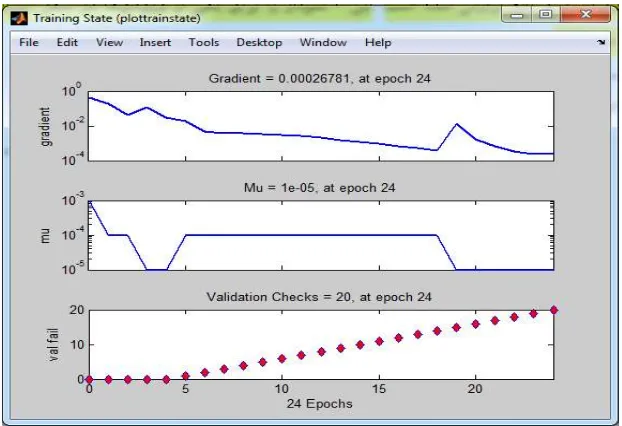
Figure 4: Performance diagram in terms of MSE for solving the problem of the neural network by MLP
194 | a g e P
https://edupediapublications.org/journals/index.php/IJR/ Available online:
Figure 6: Regression results graph in solving the problem of the neural network by MLP
Solve the problem of the neural network by MLCF
In the MLCF networks, it also uses the BP algorithm to update the weights as a progressive forward-looking network, but the main features of the network are that the neurons of each layer are connected to all the
195 | a g e P
https://edupediapublications.org/journals/index.php/IJR/ Available online:
196 | a g e P
https://edupediapublications.org/journals/index.php/IJR/ Available online:
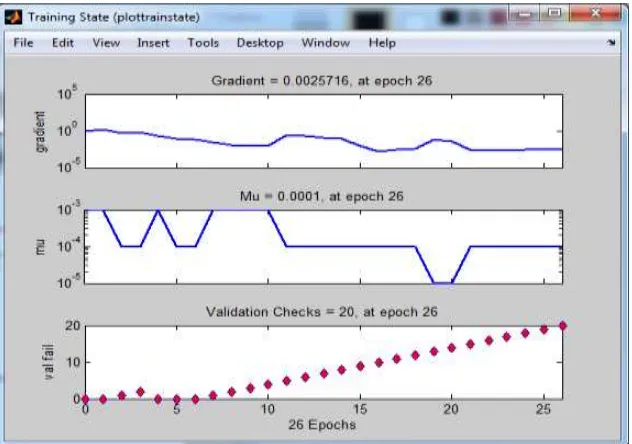
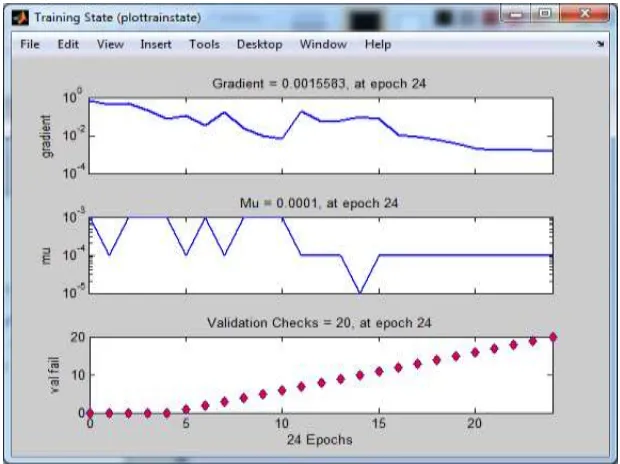
Figure 8: Data flow diagram in solving the problem of the neural network by MLCF
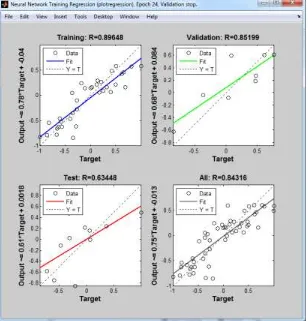
Figure 9: Regression results graph for solving the problem of the neural network by MLCP
Solving the Neural Network Problem by MLFF In laminar networks with back propagation algorithm in progressive multi-layer structures In order to get the predicted values closer to
197 | a g e P
https://edupediapublications.org/journals/index.php/IJR/ Available online:
198 | a g e P
https://edupediapublications.org/journals/index.php/IJR/ Available online:
Figure 11: Data flow diagram in solving the problem of the neural network by MLFF
Figure 12: Regression results graph in solving the problem of the neural network by MLFF
As is clear from the results, the MLFF has the lowest error and the highest value of R, in this case, the predicted values are closer to the optimal output values and the best answer with the lowest MSE value is the calculation criterion.
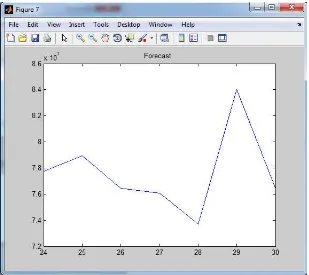
Output indicator forecast
199 | a g e P
https://edupediapublications.org/journals/index.php/IJR/ Available online:
Figure 13: Graph of training data in predicting gas consumption by time series
200 | a g e P https://edupediapublications.org/journals/index.php/IJR/ Available online: Conclusion
Despite the fact that the Islamic Republic of Iran has many potential for the development of the oil industry and gasoline and gas production, the development of the country's oil industry is slowly taking place. According to the existing literature, the most fundamental obstacle to the development of Iran's oil and gas industry is the lack of effective policies and the imposition of international sanctions. Indeed, the absence of a well-defined framework of factors and indicators of gas consumption in Iran and its constituent parts has led policy makers to have no clear basis for formulating the policies required by the industry and are more based on non- Bachelor, decide. In this research, which seems to have addressed a flow of relationships between the determinants of gas consumption with an appropriate approach, it was attempted to use a system knowledge and knowledge of effective indicators of gasoline consumption to predict consumption Gasoline in Tehran to plan for the future. This template represents the effective indicators of gas consumption in Tehran and the most general relations of accelerating or limiting its development, and by completing and clarifying it, it is possible to adjust the policies of gas consumption in the coming years with the proper precision of the program Made.
In general, energy policy makers in the country, based on this model and the knowledge of the effective indicators of energy consumption and this fuel, as well as the logical relations between
them, can develop more effective policies for development. The energy sector and this fuel
will be compiled.
REFERENCES:
[1].
Demuth
،
H
&
M
،
Beale.
،
2006
،
Matlab Help / Neural Network
Toolbox Version 4. 0. 1
[2].
Engelbretcht
،
Andries
،
2007
،
Computational Intelligence
،
South Africa
،
WILEY Ltd
،
PP 668- 683
[3].
Enserink. B & J. F. M. Koppenjan&
W. A. H. Thissen
،
2009
،
Policy Analysis
Of Multi-actor Systems
،
PP 149-150
[4].
Gurney.
،
K
،
1997
،
An
Introduction to Neural Networks
،
UCL
Press
،
London.
[5].
Kohonen.
،
T
،
1988
،
"An
Introdustion to Neural Computing"
،
Neural
Networks
،
Vol. 1
،
No. 10
،
pp.3-16
[6].
Lawrance
،
2001
،
forecasting
in
supply chain management
،
advance in
business and forecasting
،
volume 4
،
pp.
3-12
[7].
Maria
،
Anu
،
1997
،
Introduction To
Modeling & Simulation
،
State University
Of New York at Binghamton
،
pp 7-10
[8].
Mitchell
،
T
،
1997
،
Machine
Learning
،
McGraw-Hill
،
New York
[9].
Patterson
،
D. W
،
1996
،
Artificial
Neural
Networks
،
Prentice
Hall
،
Singapore
[10].
Ramesh
،
M.
C
&
R
،
Rajamanickam& S
،
jayaraman.
،
1995
،
" The Prediction of Yarn Tensile Properties
by using Artificial Neural Network"
،
J.
201 | a g e P
https://edupediapublications.org/journals/index.php/IJR/ Available online: