Effects of Dust Accumulation Density on PV Panel Efficiency
Mehmet Sait Cengiz
1& Mehmet Salih Mamiş
21
Department of Technical Vocational School, Bitlis Eren University, 13000 Bitlis, Turkey
2
Department of Electrical and Electronics Engineering, İnönü University, Malatya, Turkey
Abstract:
Photovoltaic (PV) panels are affected by various several environmental conditions at the phase of power generation. It is a complicated problem of performance how to measure dusting at an accurate Figure. Position of the dust on panel surfaces may vary by environmental factors such as field and ambient temperature, wind and rainfall. In this study, effects of dust accumulation on PV panels were examined in order to provide a better understanding for contamination dependent losses of performance. Results from the study simulated performance of PV panels under different dust accumulation regimes were evaluated by comparing with the results from
panels in real environment. Power-voltage
characteristic of PV panels were designed in Matlab- Simulink environment.
Keywords
Photovoltaic, renewable energy, cleaner energy.
1.
Introduction
Turkey is not of high productivity in terms of both production capacity and production method, even tries to take advantage of sun through certain methods reducing electrical productivity, although it has maximum potential of sun in terms of taking advantage of sun among European countries. Our country’s need of energy can be solved by considering methods of power generation from sunlight which are used by countries having common climatic characteristics, geographical structure and elevation values with Turkey [1-3].
Wastes formed by traditional fuel types during process of energy generation cause adverse effects on ecological balance. Increase in CO2 in the atmosphere causes greenhouse gas effect and SO2, NOx, HC and particles pollute the environment, as well [4-7]. Electric generation from the sunlight that is one of the most harmless methods in terms of environmental and human health is the most commonly used method of RES.
Limited oil reserve of the world and inefficient use of the current resources demonstrate that energy problems would increase if use of RES was not increased. Today, soil energy is used directly or
indirectly in an intense Fig to heat, cool and generate energy, particularly [9-11].
2.
Photovoltaic Systems
While PV panel systems are involved in the category of direct energy generation, vapor systems produced by using the sunlight or Stirling engines defined as solar-powered hot-air engines are involved in the category of indirect electric generation. The most commonly used method is PV-panel production systems.
Figure 1. PV system for a house independent of the network
PV energy systems connected to the network is used in house or building implementations at low voltage as well as they may be power stations containing large power reserves.
The most important reason why PV systems are preferred is that they can turn solar energy directly into electrical energy, don’t pollute the environment, have simple structures and can they can be implemented easily [18,19]. PV systems are used in two different Figs - being connected to the network and independently of the network- and they are designed with a fixed and tracing system.
3.
Environmental Conditions That Affect
Production of PV panels
Main environmental conditions that affect energy generation of PV panels are:
• Temperature influence of the environment, • New or old panels,
• Shadow effect depending on the location, • Diode cabling defects during production-assembly,
• Sun’s angle of incidence on PV panel, • Dusting-contamination effect of PV panel
Productivity of PV panel depends on loss of the energy produced. Losses may arise from design, quality of the material used, craftsmanship or contamination on surface of the panel as well as environmental conditions. PV panels can produce energy at maximum capacity if environmental conditions are applicable and surface of the panel is clean [3-6, 9, 19-21]. This productivity decreases over the time due to dust, dirt, pollen, bird excrement and various particles on the panels [19-24]. Productivity decreases on solar panels due to external conditions which they are installed in a dirty
and dusty environment and stay outdoor all the time. The most important reasons for contamination on the panels are:
• Transportation of dust, subsidence of dry and wet dust,
• Waste and subsidence of smut, • Pollen and dust stuck on panels,
• Stabilized road dusts, exhaust gases and effect of rail lines,
• Lime scales resulting from washing, • Effects of the leaves, seed, resin from trees, • Transportation of dust by agricultural spraying,
• Dusts formed by the effect of high humidity and temperature,
• Insect scales and bird excrements.
Loss of power arising from contamination on PV panels depends on type of contamination, elapsed time as from the last raining and regular cleaning period [3]. It has been observed that raining has influence on cleaning the dust if PV panel’s angle of inclination on horizontal plane is above 15°, and that productivity decreased due to contamination is 0,5% at this angle.
Productivity loss increases if PV panel’s angle is below 15° or raining is rare and if the current field is exposed to a specific dustiness and industrial pollution. Excluding specific experimental studies, however, it is seen in the studies conducted that losses arising from contamination level of PV panels rarely exceeds 4% [4].
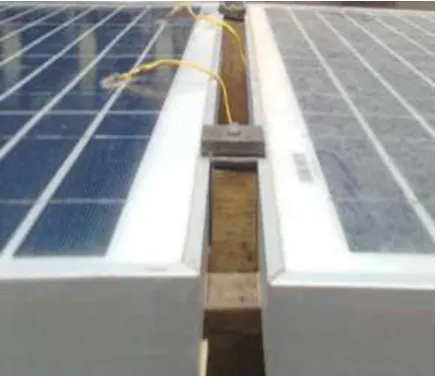
Figure 2. A group of PV panels which were cleaned and left uncleaned
Figure 3. illustrates variation of power in PV panel. In that, the more dustiness increases, productivity falls from 2.94% to 12.14%.
As PV panels get contaminated, difference of energy generation increases between clean PV panel and contaminated PV panel. PV panels which are side by side under equal conditions produce energy by benefiting from solar radiation according to contamination level. While clean PV panel makes production 5.1 W when PV panel is exposed to 5 g/m2 of dust, less contaminated PV panel produces less energy at 2.94% by producing energy 4.95 W. In the same Fig, PV panel exposed to 10 g/m2 of dust produces less energy at 3.47%, PV panel exposed to 15 g/m2 of dust produces less energy at 6.31%, PV panel exposed to 20 g/m2 of dust produces less energy at 9.09% and PV panel exposed to 25 g/m2 of dust produces less energy at 12.14%.
In that, PV panels decrease the productivity as contamination increases. Figure 3 illustrates proportional change of contamination and the power generated in PV panel.
Figure 3. Proportional change of contamination and the power generated in PV panel
Panel’s angle of inclination is another important parameter which affects productivity of PV panels. For this purpose, productivity has been analyzed in terms of different angles of PV panel in simulation and real environments. In this study, PV panel’s angle of inclination has been simulated in matlab Simulink at first. This kind of software-simulation and application studies have been carried out in several fields in the recent days. Then, power generations in simulation and real environments have been compared by observing power generation of a PV panel at different aspects in physical
environment. Figure 4 illustrates PV panel model formed by Simulink.
Fig. 4. PV panel model formed by Simulink
4.
Results and Discussion
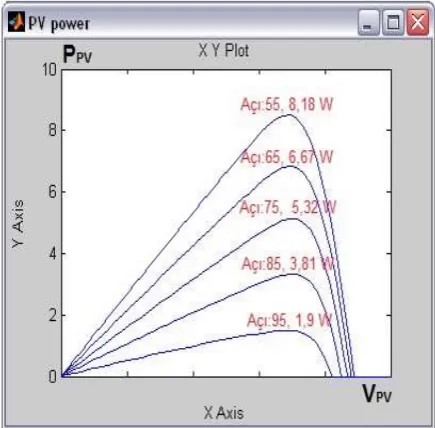
Power outputs obtained from PV panels having angles of 55o, 65o, 75o, 85o and 95o in simulation environment are 8.18 W, 6.67 W, 5.32 W, 3.81 and 1.9 W, respectively. Figure 5 and Figure 6 illustrates output powers for different angles according to the simulation.
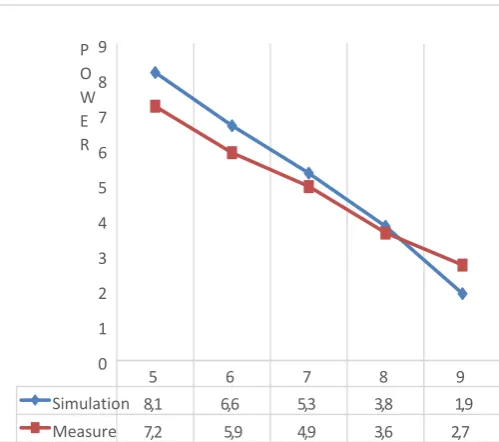
Figure 5 thus illustrates output powers of simulation and real panels at different aspects and it is seen that output powers of simulation environment are higher when output powers are examined. The reason is that there isn’t any adverse parameter to decrease the productivity since conditions are ideal in the simulation. Figure 6 illustrates output powers of simulation and real PV panels at different aspects.
Figure 6. Output powers of simulation and real PV panels at different aspects
As it is seen in Figure 6, real PV panel produces more energy than the simulation panel at the angle of 95°. The reason is that sun beams reflected by the surface supply additional power to PV panel. Power output falls by 1.86 W when the surface causing reflection is covered by a black rough cloth absorbing light of the surface.
5.
Conclusion
This study has been carried out in order to examine effect of dust accumulation density on performance of PV panel. Study is based on comparing the effect of contamination-dusting formed over the panels outdoors in simulation and physical environments. Performance change of power generation has been thus observed.
Identical panels exposed to the same conditions and ambient temperature have been compared, and one of the panels kept dust on the surface while the other one was cleaned. Any loss of power resulting from dust accumulation over the surfaces of PV panels wasn’t observed. This decrease of power output has been accepted; and decrease at power
outlet arising from dust causes large-scale loss of electric energy and considerable economic losses for PV power plants, depending on size of the plants.
6.
References
[1] Alkan, S., Öztürk, A., Zavrak, S., Tosun, S., Avcı, E. Installation of Photovoltaic System That Can Supply Electrical Energy Needs of a House, Eleco 2014 Elektrik– Elektronik–Bilgisayar ve Biyomedikal Mühendisliği Sempozyumu, 27–29 Kasım 2014, Bursa
[2] Cengiz M.S., Mamiş M.S., Akdağ M. and Cengiz Ç., 2015. A Review of Prices for Photovoltaic Systems, International Journal on Technical. Phy. Prob. Engineering 7(10), pp. 8-13.
[3] Çıbuk, M. 2009. The Academıc Personal Informatıon System 4(4), e-Journal of New World Sciences Academy Engineering Sciences, 4, (4), 601-611.
[4] Detrick, A., Kimber, A. and Mitchell, L. 2005. Performance Evaluation Standards for Photovoltaic Modules and Systems, Proceedings of the 31st IEEE Photovoltaics Specialists Conference, pp. 1581-1586, ISBN 0-7803-8707-4, Lake Buena Vista, USA, January 2005.
[5] Ertuğrul, Ö.F., Kurt MB., 2009. Güneydoğu Anadolu Bölgesinin Yenilebilir Enerji Kaynakları Yönünden Değerlendirilmesi, V. Yenilenebilir Enerji Kaynakları Sempozyumu (YEKSEM’09), 232-235.
[6] Ertuğrul, Ö.F., Kurt MB., 2009. Yenilenebilir Enerji Kaynakları Maliyet Analizi Ve Sürdürülebilir YEK Uygulamaları, V. Yenilenebilir Enerji Kaynakları Sempozyumu (YEKSEM’09), 37-40.
[7] Efe S.B., Cebeci M., 2015. Mikro Şebekenin Farklı İşletme Koşulları Altında İncelenmesi, 6. Enerji Verimliliği Kalitesi Sempozyumu (EVK2015), 4-6 Haziran 2015, Sakarya, Türkiye.
[8] Efe, S.B., 2016. Effects of Faults on Power Flow Analysis for Microgrids. 8th International Ege Energy Syposium May 11-13, 2016 Afyonkarahisar, pp. 971-976.
[9] Goossens D, Van Kerschaever E. 1999. Aeolian dust deposition on photovoltaic solar cells: the effects of wind velocity and airborne dust concentration on cell performance. Solar Energy; 66(4):277-289.
[10] Hass R. 1995. The value of photovoltaic electricity for society. Solar Energy 53:395–402.
[11] Kaynaklı, M., Palta, O., Cengiz, Ç. 2016. Solar Radiation and Temperature Effects on Agricultural Irrigation Systems, Bitlis Eren Universty Journal of Science & Technology, 6, 1, pp. 53-58.
[12] King DL, 2004. Boyson WE, Kratochvil JA. Photovoltaic array performance model. Sandia National Laboratories Internal Report; SAND2004-3535.
[13] Kymakis, E., Kalykakis, S. and Papazoglou, T.M.. 2009. Performance Analysis of a Grid Connected Photovoltaic Park on the Island of Crete. Ener. Conver. Manag, 50:3, 433–438.
5 5 6 5 7 5 8 5 9 5 Simulation 1 8 ,
8 6,6
7
5,3 2
, 38
1
1,9 Measure
ment
2 2 ,
7 5,9 ,9
[14] Mani M, Pillai R. 2010. Impact of dust on solar photovoltaic (PV) performance: Research status, challenges and recommendations. Renewable and Sustainable Energy Reviews; 14(9): 3124-3131.
[15] Maraşlı, F., Çıbuk, M. 2016. RFID based on the design of a new fuel recognation system, Bitlis Eren Univ J Sci & Technol.6 (2), 66-72.
[16] Ö. F., Ertugrul, 2016. Forecasting electricity load by a novel recurrent extreme learning machines approach, International Journal of Electrical Power & Energy Systems 78, 429-435
[17] Pizzini, S. 2010. Towards solar grade silicon: Challenges and benefits for low cost photovoltaics, Sol. Ener. Mater. Sol. Cells, 94: 9, 1528–1533.
[18] Rao A, Pillai R, Mani M, Ramamurthy P. 2013. An experimental investigation into the interplay of wind, dust and temperature on photovoltaic performance in tropical conditions. Proceedings of the 12th International Conference on Sustainable Energy Technologies; 2303-2310.
[19] Said SAM. 1990. Effect of dust accumulation on performances of thermal and photovoltaic flat-plate collectors. Applied Energy; 37(1):73-84.
[20] Samimi J, Asl-Soleimani E, Zabihi MS. 1997. Optimal sizing of photovoltaic systems in varied climates. Solar Energy 52:97–107.
[21] Serhadlıoğlu, YS. 2014. http://enerjienstitusu .de/2014 /12/20/gunes-enerjisi-fotovoltaikekipman-garanti-kosullari/ (Erişim Tarihi:01.02.2018)
[22] Yetkin, S., İlcihan, Z.,Ilkılıç, Z. (2017). Ters Sarkaç Sisteminin Dinamik Modeli ve Simulasyon Tasarımı. International Conference on Multidisciplinary, Science, Engineering and Technology (IMESET’17 Bitlis), 344-344.
[23] Cengiz Ç. Yapıcı I., Cengiz M.S., 2018. Fourier Analysis in Rail Systems, International Conference on Multidisciplinary, Science, Engineering and Technology-Dubai Oct 25-27, 2018, Dubai-Birleşik Arap Emirliği
[24] Yapıcı İ., Cengiz MS., Mamiş MS., Stirling Engines Mechanical Design, International Engineering and Natural Sciences Conference (IENSC 2018), Nov. 2018
Received: 9th May 2018; Accepted: 17th Nov 2018;
Published: Dec 2018)