Article Number: 51AF5B657107 ISSN 1684-5315
Copyright © 2018
Author(s) retain the copyright of this article http://www.academicjournals.org/AJB
African Journal of Biotechnology
Full Length Research Paper
Simple sequence repeat (SSR) markers linked to
drought tolerant traits in selected Sudanese rice (
Oryza
sativa
L
.)
genotypes
Ahmed Bashier
1,2*, Joel Masanga
3,
Wariara Kariuki
4and
Steven Runo
31
Institute for Basic Sciences Technology and Innovation, Pan African University, P. O. Box 62000 00200 Nairobi, Kenya. 2
Biotechnology and Biosafety Research Center (BBRC), Agricultural Research Corporation (ARC), Khartoum, Sudan. 3
Department of Biochemistry and Biotechnology, Kenyatta University (KU), Nairobi, Kenya. 4
Jomo Kenyatta University of Agriculture and Technology (JKUAT), Nairobi, Kenya.
Received 28 March, 2018; Accepted 7 May, 2018
Rice growth and productivity are affected by biotic and abiotic stresses; key among them being drought. Conventional breeding for drought tolerance is slowed down by the complex nature of mechanisms underlying this stress although molecular markers offer a promising approach. Plant exposure to drought stress leads to a significant effect in chlorophyll content and reduction in photosynthesis. In this study, 23 Sudanese rice (Oryza sativa L.) genotypes under greenhouse conditions for drought tolerance were examined. The study focus on tracking changes in chlorophyll content under stress (by withholding water and later rewatering) and further screened them for DNA polymorphisms using simple sequence repeat (SSR) markers. The results showed that genotypes IR11A306, IRRI 154, NERCA 6, IR12N 240, NERICA 4, Wakra and IRRI 150 exhibited high drought tolerance based on the assay. After dehydration, IR11A306 recorded the highest increment in total chlorophyll while IR11A483 showed the highest reduction followed by NERICA 15, IR11 N121, IRRI 168, NERICA 7, NERICA 1, NERICA 14 and Nipponbare. When plants were rehydrated and total chlorophyll measured, the highest increase and best recovery were observed in IR74371-70-1-1 followed by IRRI 168, IRRI 147, Nipponbare, Kosti 2, IAC 165 and Umgar. Genotype IR11A306 showed the least reduction in chlorophyll followed by NERICA 15, IRRI 150, IRRI 122, IR12N 240, IRRI 154, NERICA 16, NERICA 4 and Wakra. Eighteen out of the 19 primers tested showed amplification of the SSR markers generating 569 alleles that ranged between 13 and 113 alleles per marker. These alleles further produced polymorphism information content (PIC) values of 0.51 to 0.99 per marker. The assay helped select genotypes that showed a steady recovery of chlorophyll content following drought stress while the markers studied could be useful for future molecular breeding for drought tolerance in rice.
Key words: Chlorophyll, drought tolerance, polymorphism, rice, simple sequence repeats (SSR), sudanese genotypes.
INTRODUCTION
and 20% of overall nutritional protein (Muench et al., 1998; Bashir et al., 2007). It is cultivated under diverse ecologies ranging from irrigated to fed uplands, rain-fed lowland and deep water. Irrigated rice is cultivated on 55% of the world’s production area and accounts for about 75% of total rice production. Furthermore, over 3 billion people in the world depend on rice for food (Awasthi and Lal, 2014). In Africa, Sudan has an estimated rice production area of more than 300,000 ha and if this area is properly utilized, it would suffice the local consumption demand and hence fill the gap with non-course food grain. Rice production in Sudan was introduced in the Gazira scheme by the technical assistance of China in 1973 and is manly practiced in the southern states. During this period, 12,000 ha were cultivated under irrigation with yields of between 3.5 and 7.6 ton/ha attained. A few years ago, it was reported that, no breakthrough with regards to increasing the cultivated area and improving new varieties has been achieved (Mahgoub, 2014). Being in an arid and desert ecological zone, Sudan is one of the most vulnerable countries to climate change owing to a high climatic variability and low development (Elasha et al., 2005). Drought has been considered one of the major causes of food insecurity in Sudan (Mahgoub, 2014) and in many parts of the country, this was been exacerbated by decreasing annual rainfall over the past 60 years (Nimir and Elgizouli, 2011). Growth and productivity of rice is adversely affected by various biotic and abiotic stress factors key among them being drought (Ndjiondjop et al., 2010; Singh et al., 2012). Drought conditions lead to a reduction in plant growth by affecting various physiological and biochemical processes such as photosynthesis, respiration, translocation, ion uptake, carbohydrate metabolism, nutrient metabolism and growth promoter activities (Farooq et al., 2008). Drought stress leads to a reduction in leaf area, cell size and intercellular volume (Ndjiondjop et al., 2010). Furthermore, it has been demonstrated that exposure of plants to drought leads to a significant effect in chlorophyll contents as a result of the reduction in leaf growth (Chutia and Borah, 2012). Most of the cultivated rice varieties are susceptible to drought therefore necessitating the need for continued improvement (Uphoff et al., 2015). In attempts to overcome the drought problem, researchers in various improvement programs have used molecular markers to identify germplasm with traits related to drought tolerance (Afiukwa et al., 2016).
Development of molecular markers and their use for genetic dissection of agronomical important traits has been identified as a powerful tool for studying complex plant traits such as drought tolerance (Suji et al., 2011). Particularly, DNA-based molecular markers have been
reliably used with availability of a large number of polymorphic markers enabling precise classification of the cultivars (Sonia, 2013). Improvement of rice for drought tolerance using conventional breeding methods is slow due to geographical differences and the variations of seasons in drought timing and severity, the complex nature of drought tolerance traits and the difficulty in selection of combinations of traits (Courtois et al., 2003). Other factors that have slowed down this process include low heritability, multiple gene control as well as genotype and environmental interactions (Cattivelli et al., 2008). The uses of molecular markers to select accessions possessing genes and genomic regions that control target traits can fast-track the progress in breeding drought tolerant rice. This is because molecular markers are consistently transmitted from generation to generation and are not subject to environmental influences (Afiukwa et al., 2016). Studies using molecular markers have reported success in identification of QTLs underlying various drought tolerance traits in rice chromosomes. For instance, Vasant (2012) showed that 12 SSR markers are strongly associated with root traits under drought while 14 SSRs show a significant association with yield and its components under drought. Furthermore, other molecular markers associated with drought-related traits have also been reported thereby affirming the usefulness of these markers in the molecular breeding of rice for improved drought tolerance (Afiukwa et al., 2016). Several molecular markers such as Restriction Fragment Length Polymorphism (RFLP), Random Amplified Polymorphic DNA (RAPD), Simple Sequence Repeats (SSRs), Inter Simple Sequence Repeats (ISSRs), Amplified Fragment Length Polymorphism (AFLP) and Single Nucleotide Polymorphisms (SNPs) are presently available to assess the variability and diversity at molecular level and have been used to enhance traditional breeding programs to improve rice crop (Sonia, 2013). The SSR markers were identified as the system of choice for genetic analysis in rice because of their efficiency, abundance in the rice genome, high level of polymorphism and high but simple reproducible assays that are reliable (Singh et al., 2010). This study therefore aimed to determine the SSR markers linked to drought tolerance traits and their association with phenotypic traits in rice genotypes cultivated in Sudan. The study also assayed for changes in total chlorophyll content following drought stress by withholding water from the plants and later re-watering them. Data obtained here is expected to contribute towards marker assisted breeding for drought tolerance for sustainable rice production under the current climate changing conditions.
*Corresponding author. E-mail: ahmedbashir.sd@gmail.com.
Table 1. List of rice genotypes used in the study.
Name Origin (Country, Group) Ecosystem level of drought tolerance
NERICA 6 Sierra Leone Upland Drought tolerant NERICA 16 Sierra Leone Upland Drought tolerant NERICA 15 Sierra Leone Upland Drought tolerant NERICA 14 Sierra Leone Upland Drought tolerant NERICA 4 Sierra Leone Upland Drought tolerant Wakra Indonesia Upland Drought tolerant Kosti 2 WARDA Upland Drought tolerant Kosti 1 WARDA Upland Drought tolerant IRRI 150 Philippines Undefined Undefined IR11A306 IRSEA Undefined Undefined IR11A483 IRSEA Undefined Undefined IRRI 147 Philippines Undefined Undefined IRRI 122 Philippines Undefined Undefined NERICA 1 Sierra Leone Upland Drought tolerant IR12N240 IRSEA Undefined Undefined IR74371-70-1-1 India Undefined Drought tolerant IR11N121 IRSEA Undefined Undefined IRRI 154 Philippines Undefined Undefined IRRI 168 Philippines Undefined Undefined Umgar China Upland Drought tolerant Nipponbare Japan Upland Undefined IAC 165 Brazil Upland Undefined NERICA 7 Sierra Leone Upland Drought tolerant
MATERIALS AND METHODS
Plant materials
Seeds of twenty three (23) Oryza sativa L. genotypes grown in Sudan with varying degree of tolerance to drought were obtained from Biotechnology and Biosafety Research Center (BBRC), Agricultural Research Corporation, Sudan and used. These included 11 upland drought tolerant genotypes (NERICA 4, NERICA 6, NERICA 14, NERICA 15, NERICA 16, NERICA 1, NERICA 7, Umgar¸ Kosti 1, Kosti 2 and Wakra), ten genotypes (IRRI 150, IR 11A306, IR 11A483, IRRI 147, IRRI 122, IR 12N240, IR 74371-70-1-1, IR11N121, IRRI 154 and IRRI 168) still under research in Sudan and two genotypes (IAC 165 and Nipponbare) from Kenyatta University (KU), Kenya. Genotype description is presented in Table 1.
Determination of chlorophyll content from rice
Chlorophyll content analysis was conducted on rice leaves grown in the greenhouse at the Plant Transformation Laboratory, Kenyatta University, Kenya. Rice seeds were directly sowed in plastic pots (size 10*10*5 cm) containing garden soil placed in buckets containing water for underwatering. The greenhouse conditions were: 12 h light/12 h dark photoperiod; 28ºC day and 24ºC night temperature and 60% of humidity. Five plants were used for each genotype with three replicates. Pots were randomized and irrigated after every five days. At the 3 to 4 leaf stage (corresponding to around 3 weeks after sowing), the plants were irrigated constantly until 60 days followed by the first chlorophyll extraction according to
Botstein et al. (1980). Five leaf discs were punched from rice plants using a paper punch and ground to a fine powder under liquid nitrogen. Total chlorophyll was then extracted using acetone with a 10 min centrifugation step. The chlorophyll was quantified using a spectrophotometer (Spectrometre UV- Visible- UV- 3100 PC- VWR) under 660 nm wavelength. Three spectrophotometer readings were taken and an average calculated for each genotype. The plants were exposed to drought stress conditions by draining water from the buckets and placing back the plastic pots. The plants were maintained under this condition for seven days after which a second chlorophyll extraction was done. Plants were then put under the normal condition by rewatering the buckets and a 3rd chlorophyll extraction was done seven days later.
Screening rice genotypes using SSR markers
Table 2. List of SSR markers used to in the current study.
Primer name Primer sequence SSR motif Chr. Num. Size of bands Sources
RM38 F: ACGAGCTCTCGATCAGCCTA
R: TCGGTCTCCATGTCCCAC (GA)16 8 250 Srividhya et al., 2011 RM252 F: TTCGCTGACGTGATAGGTTG
R: ATGACTTGATCCCGAGAACG (CT)19 4 216 McCouch et al., 2002 RM170 F: TCGCGCTTCTTCCTCGTCGACG
R: CCCGCTTGCAGAGGAAGCAGCC (CCT)7 6 121 Yue et al., 2005 RM318 F: GTACGGAAAACATGGTAGGAAG
R: TCGAGGGAAGGATCTGGTC (GT)15 2 140 Srividhya et al., 2011 RM279 F:GCGGGAGAGGGATCTCCT
R: GGCTAGGAGTTAACCTCGCG (GA)16 2 174 Ordonez et al., 2010 RM7390 F: CTGGTTAACGTGAGAGCTCG
R: GCAGATCAATTGGGGAGTAC (GATA)8 9 140 McCouch et al., 2002 RM432 F: TTCTGTCTCACGCTGGATTG
R: AGCTGCGTACGTGATGAATG (CATC)9 7 187 Vikram et al., 2011 RM5367 F: AGTACCTCTCACTCGCCTGC
R: TGTCAGCTGTGAGTGAAGTCG (TC)13 12 185 McCouch et al., 2002 RM5423 F: ATCCCACTTGCAGACGTAGG
R: ACAGCAGCAAGGTGCCTC (TC)16 1 202 McCouch et al., 2002 RM5850 F: TTAGGTGTGTGAGCGTGGC
R: ATACACAGATGACGCACACG (ATA)27 6 181 McCouch et al., 2002 RM36 F: CAACTATGCACCATTGTCGC
R: GTACTCCACAAGACCGTACC (GA)23 3 192 Brondani et al., 2002 RM3558 F: ACGAGAGATCTTCTTTGCAG
R: CCTCTATTTATGCCTCTACGC (GA)12 4 161 McCouch et al., 2002 RM517 F: GGCTTACTGGCTTCGATTTG
R: CGTCTCCTTTGGTTAGTGCC (CT)15 3 266 Lu et al., 2005 RM6130 F: GGCAGAGAGAGCTGCATCTC
R: GACGACGACGAACCCAAC (CGC)8 4 116 McCouch et al., 2002 RM583 F: AGATCCATCCCTGTGGAGAG
R: GCGAACTCGCGTTGTAATC (CTT)20 1 192 Vikram et al., 2011 RM1141 F: TGCATTGCAGAGAGCTCTTG
R: CAGGGCTTTGTAAGAGGTGC (AG)12 1 100 McCouch et al., 2002 RM260 F: ACTCCACTATGACCCAGAG
R: GAACAATCCCTTCTACGATCG (CT)34 12 111 McCouch et al., 2002 RM525 F: GGCCCGTCCAAGAAATATTG
R: CGGTGAGACAGAATCCTTACG (AAG)12 2 131 McCouch et al., 2002 RM331 F: GAACCAGAGGACAAAAATGC
R: CATCATACATTTGCAGCCAG
[(CTT)4GT
T]2(CTT)11 8 176 Srividhya et al., 2011
cycles of 94ºC for 30 s, annealing at 55ºC for 30 s and an extension period of 68ºC for 30 s. A final extension period of 68ºC for 5 min was also included. The amplified PCR products were resolved on a 2% agarose gel after staining with SYBR green and run at 100 volts for 1 h alongside a 50 bp DNA ladder. The gels were visualized under UV light from a transilluminator and documented using a digital camera. The amplified bands were scored for each SSR marker, generating a binary data matrix of 1 (presence) and 0 (absence) for each primer. This information was then used to determine the number of alleles and the Polymorphism Information Content (PIC) by using the formula described by Botstein et al. (1980) as follows:
Where, Pi and Pj are the frequencies of the ith and jth alleles of a given marker, respectively, n = number of different alleles
Statistical analysis
Analysis of variance (ANOVA) was performed to compare
n-1 n
PICj = 1-∑P i2-∑ ∑2 P i2 P j 2
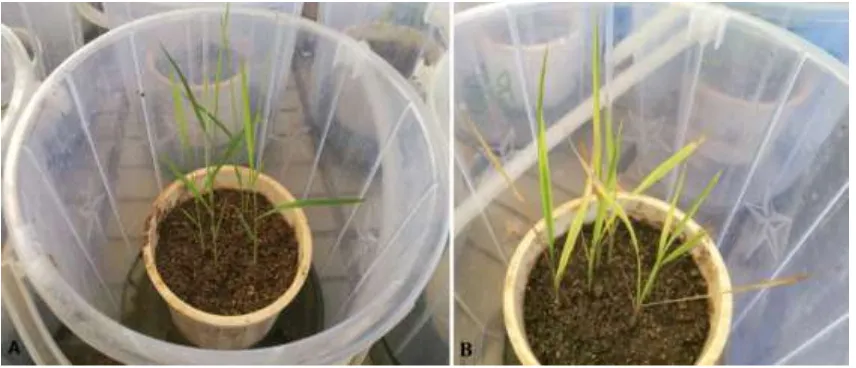
Figure 1. Plants of Kosti 1 genotype in the greenhouse before (A) and after (B) exposure to drought stress by withholding water for 7 days.
chlorophyll contents among genotypes under the imposed drought conditions using Statistical analysis software (SAS) version 9.2. A Tukey’s HSD test at 95% confidence interval was used for mean separations and the data presented as means with their respective standard errors. The SSR marker amplification data (1 and 0) were used to determine population genetic structure and presented as a dendrogram generated by the Unweighted Pair Group Method with Arithmetic Mean (UPGMA) based on Jaccard’s dissimilarity coefficient in the Dissimilarity Analysis and Representation (DARwin) software version 6. Marker-trait association analysis was done by physically comparing the pattern of the SSR markers clustered from the genotypes with the percentage change in the total chlorophyll content as a result of drought stress.
RESULTS
Effect of drought on rice chlorophyll content
Withholding water for seven days resulted in a marked effect on total chlorophyll content in all rice genotypes under this study. The effect was first noted in the color change in the leaves with those under stress turning yellow compared to plants growing under normal conditions (Figure 1). Total chlorophyll content was significantly affected despite all genotypes responding differentlytothedrought stress treatment. Under normal watering conditions (control) (Figure 2), NERICA 7 showed the highest chlorophyll content followed by significantly lower levels (p≤0.05) in NERICA 15, Kosti 1, NERICA 1, NERICA 14, IAC 165, IRRI N 121 and Wakra. Genotype IRRI 154 recorded the lowest chlorophyll followed by Nipponbare, IR12N240, IR11A483, Kosti 2, IR74371-70-1-1 and IR11A306. After dehydration (Figure 3), IR11A306 recorded the highest increment in total chlorophyll followed by NERICA 4, Kosti 1, Wakra, NERICA 6, IR12N240, IAC 165 and IRRI 150, while IR11A483 showed the highest reduction followed by
Nipponbare, Kosti 2, IR74371-70-1-1, IRRIN121, IRRI 168, NERICA 7, NERICA 15 and NERICA 1. When plants were rehydrated and total chlorophyll measured (Figure 4), the highest increase and best recovery were observed in IAC 16 followed by Kosti 1, IR 74371-70-1-1, IRRI 147, NERICA 6, Umgar and IRRI 168, while NERICA 15 showed the least reduction in chlorophyll levels followed by IR11A483, IR 11A 306, IRRI 122, IRRI 150, IR12N240 and IRRI 154.
All the genotypes recorded different values of change in total chlorophyll (Table 3). At the end of the dehydration period, genotype IR 11A 306 recorded the highest increase in total chlorophyll followed by IRRI 154, NERICA 6, IR12N240, NERICA 4, Wakra and IRRI 150, while IR11A483 showed the highest reduction followed by Nerica 15, IR11N121, IRRI 168, NERICA 7, NERICA 1, NERICA 14 and Nipponbare. After rehydration, the highest increase and best recovery were observed in IR74371-70-1-1 followed by IRRI 168, IRRI 147, Nipponbare, Kosti 2, IAC 165 and Umgar. Genotype IR11A306 showed the least reduction in chlorophyll levels followed by NERICA 15, IRRI 150, IRRI 122, IR12N240, IRRI 154, NERICA 16, NERICA 4 and Wakra. In general, NERICA 4 and Wakra performed best under both conditions (before and during dehydration) but their chlorophyll contents declined after rehydration. NERICA 6, IRRI 154 and IR11A306 showed a weak performance in normal conditions and after rehydration, but a good performance during the dehydration period.
Population structure of rice genotypes and SSR polymorphism
Table 3. Percentage change in total chlorophyll contents following dehydration and rehydration in rice genotypes.
S/N Genotype % Chlorophyll change
after dehydration Rank
% Chlorophyll change
after rehydration Rank
1 IAC 165 -19.41 9 7.31 6
2 IR 11A 306 187.12 1 -97.03 23 3 IR 11A 483 -82.88 23 -22.98 8 4 IR 12N 240 57.33 4 -83.52 18 5 IR 74371-70-1-1 -46.51 12 257.54 1
6 IRRI 150 2.77 7 -92.17 21
7 IRRI 122 -26.72 10 -91.03 20 8 IRRI 147 -38.22 11 43.39 3 9 IRRI 154 150.53 2 -83.36 18 10 IRRI 168 -73.87 20 63.93 2 11 IRRI N 121 -77.61 21 -63.56 12
12 KOSTI 1 -1.48 8 -26.64 9
13 KOSTI 2 -57.43 15 7.89 5
14 NERICA 1 -61.71 18 -65.39 13 15 NERICA 14 -59.69 17 -68.54 14 16 NERICA 15 -77.98 22 -96.17 22 17 NERICA 16 -51.33 14 -79.81 17 18 NERICA 4 16.79 5 -78.029 16 19 NERICA 6 69.28 3 -51.96 11 20 NERICA 7 -65.89 19 -28.31 10 21 NIPPONBARE -59.32 16 14.18 4
22 UMGAR -48.54 13 2.67 7
23 WAKRA 6.89 6 -69.46 15
Figure 2. Total chlorophyll content in rice leaves after 2 months of growth under normal conditions. Genotypes (means) with the same letter are not significantly different.
19 SSR markers successfully amplified and representative gel images of the results are presented in Figure 5. Information on allele frequency, allele number and PIC are summarized in Table 4. The 18 SSR primers
Figure 3. Total chlorophyll content in rice leaves 7 days after dehydration. Genotypes (means) with the same letter are not significantly different.
Figure 4. Total chlorophyll content after 7 days of rewatering. Genotypes (means) with the same letter are not significantly different.
method clustered the genotypes into 3 major clusters (Figure 6). Cluster 1 had 2 distinct sub-groups with all themembersinthissub-group originating from the upland ecosystem. The genotypes that clustered in this group were Kosti 2, NERICA 14, Kosti 1, Wakra, NERICA 4, NERICA 15, NERICA6, NERICA 7, NERICA 16, IAC 165 and NERICA1,whilesub-group2comprised Nipponbare, Umgar and IR12N240. The second cluster comprised lowland rice genotypes and these were further grouped into two sub-group; sub-group 1 that had IR11A306, IRRI 150, IR11A483, IRRI 147, IRRI 122 and IR 74371-70-1-1
and sub-group 2 that had IRRI 154 and IR11N121. A lowland IRRI168genotypeformed cluster 3.
Marker- trait association under drought stress analysis
Figure 5. Representative gels of fragments amplified by PCR targeting SSR markers common in size to rice. M -50 bp ladder; -ve= negative control; numbers 1- 23 represent each of the rice varieties; A = RM6130; B = RM 38; C = RM5423.
Table 4. Genetic diversity indices detected in rice genotypes by SSR markers.
SSR primer Allele frequency Allele number PIC
RM38 0.96 27 0.95
RM252 1 27 0.99
RM170 1 33 0.99
RM318 1 37 0.99
RM279 0.74 28 0.73
RM7390 0.52 29 0.51
RM432 0.74 57 0.73
RM5367 1 23 0.99
RM5423 0.96 22 0.95
RM5850 0.57 13 0.56
RM36 1 26 0.99
RM3558 1 23 0.99
RM517 1 24 0.99
RM6130 0.96 113 0.95
RM583 1 23 0.99
RM1141 0.96 22 0.95
RM260 0.61 15 0.6
RM525 1 27 0.99
Mean 0.89 31.7 0.88
grouped the genotypes according to the patterns of change in total chlorophyll content. Although the majority
Figure 6. A dendrogram generated from UPGMA cluster analysis based on Jaccard’s dissimilarity coefficient with 1000 boostrap replicates showing 23 rice genotypes generated from 18 SSR markers scoring.
chlorophyll content at the end of the dehydration period while the other genotypes showed a significant reduction. Genotypes in cluster 2 and cluster 3 are lowland. Here, IR11A306, IRRI 154 and IRRI 150 showed an increase in total chlorophyll content at the end of the dehydration period with the rest of the genotypes in both clusters showing a reduction in chlorophyll.
DISCUSSION
Effect of drought stress on total chlorophyll content
Drought stress affects morphological and physiological traits during plant growth and development. Particularly, drought stress leads to a reduction in leaf area, cell size and intercellular volume (Ndjiondjop et al., 2010). Furthermore, it has been demonstrated that exposure of plants to drought leads to a significant effect in chlorophyll contents as a result of the reduction in leaf growth (Chutia and Borah, 2012). In the current study, each rice genotype was examined under drought stress by monitoring the change in total chlorophyll content following seven days of withholding water and a further seven days of re-watering. The study data showed significant increase in levels of chlorophyll in some genotypes while others recorded marked chlorophyll decline as a result of dehydration. This could be attributed to drought’s effect on chlorophyll biosynthesis and therefore a strong indication that photosynthesis
would subsequently be affected in these plants. It has been previously reported that chlorophyll supports more efficient energy conversion into ATP and NADPH which are then used as source of energy to build carbohydrates from CO2 (Pena et al., 1986). Chlorophyll degradation in these genotypes might be an indication that photosynthesis had already been inhibited when the color of leaves started to change. Consequently, some of the genotypes including IR74371-70-1-1, IRRI 168, IRRI 147, Nipponbare, Kosti 2, IAC 165 and Umgar showed recovery of chlorophyll after rehydration while IR11A306, NERICA 15, IRRI 150, IRRI 122, IR12N 240, IRRI 154, NERICA 16, NERICA 4 and Wakra showed no recovery following drought (based on the negative percentage loss of chlorophyll). Overall, these observations indicated variations among these genotypes with respect to chlorophyll levels and how the individual lines respond to drought stress. It is important for a tolerant plant to maintain high level of chlorophyll under drought stress to ensure continued photosynthesis. In cereals, higher total chlorophyll content under stress conditions has been reported and this is an indicator for drought tolerance (Gummuluru et al., 1989).
Patterns of SSR polymorphism and their correlation with chlorophyll under drought stress
target traits can fast-track the progress of breeding for drought tolerant rice. This is because molecular markers are transmitted faithfully from generation to generation and are not subject to environmental influences (Afiukwa et al., 2016). The SSR markers are efficient along with the system of choice for genetic analysis in rice because of their abundance in the rice genome, high level of polymorphism, reliable and high but simple reproducible assays (Singh et al., 2010). For these reasons therefore, SSR markers have been used in molecular characterization of rice as well as other crop species (Semagn et al., 2006). In the current study, a total of 569 alleles were amplified using 18 SSR primers ranging between 13 and 113 alleles per primer. The study data is comparatively higher than that of Aficukwa et al. (2016) who reported between 4 and 25 alleles per primer and PIC values of 0.76 to 0.95. This reflects the high discriminatory ability of the used markers and therefore affirms their use in genetic characterization studies (Singh et al., 2010).
Improvement of rice for drought tolerance using conventional breeding methods is slow due to the differences in geographical locations and variations of seasons in drought timing and severity, the drought tolerance complex nature itself and the selection of combinations difficulty of traits (Courtois et al., 2003). Furthermore, other factors that underline the slow progress include low heritability, multiple gene control, genotype and environment interactions. All these were shown to substantially influence crop yields (Cattivelli et al., 2008). Tracking the population structure of rice genotypes under this study grouped them into 3 major clusters. The dendrogram analysis provided an evidence of the ecosystem of each genotype and the genetic relation between them as cluster 1 (with two sub-clusters) comprised 93% upland genotypes and the rain fed lowland genotypes grouped in cluster 2 and 3.
A comparison between the pattern in which the SSR markers clustered the genotypes and change in chlorophyll allowed determination of marker-trait associations for drought tolerance showed that none of the markers clearly grouped the genotypes according to the change pattern of the total chlorophyll content. A majority of cluster 1 genotypes were from the lowland ecosystem, and showed an increase in the chlorophyll content at the end of dehydration as expected result while the others showed a significant reduction. In spite of both cluster 2 and 3 being rain fed lowland genotypes, some of them showed an increase in the chlorophyll content at the end of the dehydration period. It could, therefore be deduced from the results that the markers were able to group the genotypes based on their ecosystem reflecting the strength of the SSR markers in analyzing and explaining the population genetic structure as earlier demonstrated by Garris et al.(2005). Notable, also, was the observation that although NERICA 1, NERICA 14, NERICA 15, NERICA 16 and NERICA 7
have been described as drought tolerant (Somado et al., 2008); they did not show the expected performance under the current study conditions.
Conclusion
This study noted variations among the genotypes screened with respect to chlorophyll levels and how the individual lines respond to drought stress. For determination of the levels of genetic diversity in the population, a total of 18 SSR markers were successfully amplified resulting in a total of 569 alleles with 13 to 113 alleles per primer with an average of 31.7. The PIC values ranged from 0.51 to 0.99 with a mean value of 0.88. Furthermore, comparing the pattern in which the SSR markers grouped the genotypes and the change in total chlorophyll content in each genotype, showed that none of the markers clearly grouped the genotypes according to the patterns of change in total chlorophyll contents. These results could play a role in developing genotypes that tolerate drought stress through analysis of molecular and morphological genetic diversity information thereby selecting the best parental lines for developing and improving drought tolerant rice varieties.
CONFLICT OF INTERESTS
The authors have not declared any conflict of interests.
REFERENCES
Afiukwa CA, Faluyi JO, Atkinson CJ, Ubi BE, Igwe DO, Akinwale RO (2016). Screening of some rice varieties and landraces cultivated in Nigeria for drought tolerance based on phenotypic traits and their association with SSR polymorphism. African Journal of Agricultural Research, 11(29):2599-2615.
Awasthi S, Prakash Lal J (2014). Marker assisted selection for the improvement of Sarjoo-52 for drought tolerance by introgression of MQTL1. 1 from the source Nagina–22. Journal of Plant Molecular Breeding, 2(2):43-55.
Bashir K, Khan NM, Rasheed S, Salim M (2007). Indica rice varietal development in Pakistan: an overview. Paddy and Water Environment, 5(2):73-81.
Botstein D, White RL, Skolnick M, Davis RW (1980). Construction of a genetic linkage map in man using restriction fragment length polymorphisms. American Journal of Human Genetics, 32(3):314. Brondani C, Rangel P, Brondani R, Ferreira M (2002). QTL mapping
and introgression of yield-related traits from Oryza glumaepatula to cultivated rice (Oryza satiiva) using microsatellite markers. Theoretical and Applied Genetics, 104(6-7):1192-1203.
Cattivelli L, Rizza F, Badeck FW, Mazzucotelli E, Mastrangelo AM, Francia E, Stanca AM (2008). Drought tolerance improvement in crop plants: an integrated view from breeding to genomics. Field Crops Research, 105(1-2):1-14.
Chutia J, Borah S P (2012). Water stress effects on leaf growth and chlorophyll content but not the grain yield in traditional rice (Oryza
sativa Linn.) genotypes of Assam, India II. Protein and proline status
in seedlings under PEG induced water stress. American Journal of Plant Sciences, 3(07):971.
population IAC 165× Co39. Euphytica, 134(3):335-345.
Elasha BO, Elhassan NG, Ahmed H, Zakieldin S (2005). Sustainable livelihood approach for assessing community resilience to climate change: case studies from Sudan. Assessments of Impacts and Adaptations to Climate Change (AIACC) Working Paper. 17. Farooq M, Basra SMA, Wahid A, Cheema ZA, Cheema MA, Khaliq A
(2008). Physiological role of exogenously applied glycinebetaine to improve drought tolerance in fine grain aromatic rice (Oryza sativa
L.). Journal of Agronomy and Crop Science, 194(5):325-333. Garris AJ, Tai TH, Coburn J, Kresovich S, McCouch S (2005). Genetic
structure and diversity in Oryza sativa L. Genetics, 169(3):1631-1638. Gummuluru S, Hobbs SLA, Jana S (1989). Physiological responses of
drought tolerant and drought susceptible durum wheat genotypes. Photosynthetica, 23(4):479-485.
Lu H, Redus MA, Coburn JR, Rutger JN, McCouch SR, Tai TH (2005). Population structure and breeding patterns of 145 US rice cultivars based on SSR marker analysis. Crop Science 45(1):66-76.
Mahgoub F (2014). Current status of agriculture and future challenges in Sudan. Nordiska Afrikainstitutet, 57:7-12.
McCouch SR, Teytelman L, Xu Y, Lobos KB, Clare K, Walton M, Zhang Q (2002). Development and mapping of 2240 new SSR markers for rice (Oryza sativa L.). DNA Research, 9(6):199-207.
Murray MG, Thompson WF (1980). Rapid isolation of high molecular weight plant DNA. Nucleic Acids Research, 8(19):4321-4326. Ndjiondjop M, Cisse F, Futakuchi K, Lorieux M, Manneh B, Bocco R,
Fatondji B (2010). Effect of drought on rice (Oryza spp.) genotypes according to their drought tolerance level. Second Africa Rice Congress, Bamako, Mali, 22–26 March 2010: Innovation and Partnerships to Realize Africa’s Rice Potential. pp. 151-158.
Ordonez SA, Silva J, Oard JH (2010). Association mapping of grain quality and flowering time in elite japonica rice germplasm. Journal of Cereal Science, 51(3):337-343.
Pena S, Rao KV, Reddy GM (1986). Plant regeneration from glum calli of maize. Theoretical and Applied Genetics 72:120-122.
Semagn K, Bjørnstad Å, Ndjiondjop MN (2006). An overview of molecular marker methods for plants. African Journal of Biotechnology, 5(25):2540-2568.
Singh CM, Kumar B, Mehandi S, Chandra K (2012). Effect of drought stress in rice: A review on morphological and physiological characteristics. Trends in Biosciences, 5(4):261-265.
Singh N, Dang TT, Vergara GV, Pandey DM, Sanchez D, Neeraja CN, Mackill DJ (2010). Molecular marker survey and expression analyses of the rice submergence-tolerance gene SUB1A. Theoretical and Applied Genetics, 121(8):1441-1453.
Somado EA, Guei RG, Keya SO (2008). NERICA: The new rice for Africa–a compendium. Africa Rice Center (WARDA). pp.10-14. Sonia N (2013). Morphological Characterization and Genetic Diversity
Analysis of Drought Tolerant NERICA-4 Mutant Lines Using SSR and RAPD Markers (Doctoral dissertation, MS thesis. Department of Biotechnology, Bangladesh Agricultural University, Mymensingh). Srividhya A, Vemireddy LR, Sridhar S, Jayaprada M, Ramanarao PV,
Hariprasad AS, Siddiq E (2011). Molecular mapping of QTLs for yield and its components under two water supply conditions in rice (Oryza
sativa L.). Journal of Crop Science and Biotechnology, 14(1):45-56.
Uphoff N, Fasoula V, Iswandi A, Kassam A, Thakur AK (2015). Improving the phenotypic expression of rice genotypes: Rethinking “intensification” for production systems and selection practices for rice breeding. The Crop Journal, 3(3):174-189.
Vasant DV (2012). Genome wide association mapping of drought resistance traits in rice (Oryza sativa L.). M Sc. Thesis, Department of Plant Biotechnology, Centre for Plant Molecular Biology and Biotechnology, Tamil Nadu Agricultural University Coimbatore, India. Vikram P, Swamy BM, Dixit S, Ahmed HU, Cruz MTS, Singh AK, Kumar
A (2011). qDTY 1.1, a major QTL for rice grain yield under reproductive-stage drought stress with a consistent effect in multiple elite genetic backgrounds. BMC Genetics, 12(1):89.