Implementation of Principal Component Analysis Technique
in Peak to Average Power Ratio
A.A.A.Wahab
1,W.A.F.W.Othman
2, S.S.N.Alhady
3& P. Tajuddin
4 11,2,3,4
School Of Electrical and Electronic Engineering, Engineering Campus, Universiti Sains
Malaysia
Abstract:
Wireless communication has become one of the most rapid technology evolvements in the world.
Orthogonal Frequency Division Multiplexing
(OFDM) has become the most efficient multi carrier modulation technique for achieving high data rate transmission in wireless communication. OFDM offers advantages such as immunity to selective fading, spectrum efficiency, and various more. Regardless of these beneficial advantages, the performance of OFDM is limited as Peak Power to Average Power Ratio (PAPR) is significantly high. This would reduce the performance of Power Amplifier (PA). Principle Component Analysis (PCA) technique is proposed to implement in the high PAPR as it identifies the directions of most variation in the data set and it reduces the data down into its basic component, dispossess any unnecessary parts. A novel framework using Principal Component Analysis in PAPR is studied. A simple framework using Covariance Matrix in Principal Component Analysis is developed in the PAPR. An evaluation of the overall performances is made using the proposed Principal Component Analysis scheme in PAPR in OFDM system. The project starts with initializing the parameter used in the OFDM system. The input data is generated randomly. Next, serial to parallel the subcarriers ready for the processing of IFFT. Then, the IFFT takes place. After that, PCA technique save the largest eigenvector and eigenvalue. Lastly, the optimal transmitted signal with the lowest PAPR is chosen. It has been observed from the obtained results that PCA technique increased the value of PAPR even when it suppressed the amplitude of the signal. When implementing PCA technique with clipping, PAPR is reduced significantly. It can be concluded that PCA technique alone do not reduced PAPR, but when combining with other methods, notable PAPR reduction can be achieved.
Index Terms—PCA, PAPR, OFDM, CCDF
I.
Introduction
The revolution of telecommunications has evolved dramatically, transforming wired communications to wireless communication system.
Within recent years, the use of wireless communications has expanded remarkably worldwide, as more and more users are sending and receiving data and image applications. The early application of Frequency Division Multiplexing (FDM) is used which is the telegraphs. It carried low rate signal using a separate carrier frequency for each signal. Throughout time, the Orthogonal Frequency Division Multiplexing or commonly referred to as OFDM scheme is focused on the synthesis of band-limited orthogonal signals for multi-channel data transmission. New scheme of transmitting signals synchronously over a band-limited channel without inter-carrier interface (ICI) and inter-symbol interface (ISI) is also introduced. The OFDM contradict from FDM as the multiple carriers or also known as subcarriers carry the flow of information, the subcarriers are orthogonal, and a guard interval is included to each symbol to decrease the channel delay spread and inter symbol interference.
OFDM acted as multi-carrier modulation method to achieve high speed communication. It has seen as a robust signal processing attributable to its high spectral-efficiency [1]. Apart from that, other notable characteristics that OFDM can offers are simpler channel equalization, resilience against Selective Fading, cost effective equalization process, better spectrum efficiency, and immunity to narrowband effects. OFDM is said to be the most promising candidate for flexible spectrum pooling in communication systems[2].
II.
Orthogonal frequency division
multiplexing (OFDM)
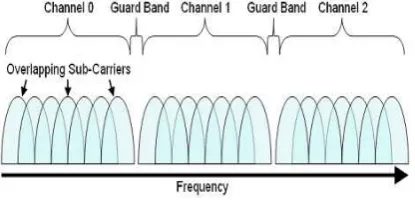
The OFDM concept is based on spreading the data to be transmitted over a large number of carriers, each being modulated at a low rate. These sub-carriers or sub-channels divide the available bandwidth and are sufficiently separated in frequency or is known as frequency spacing so that they are orthogonal. The carriers are made orthogonal to each other by appropriately choosing the frequency spacing between them[4]. As the subcarriers are orthogonal, it ensures that the subcarriers do not interfere with each other, and at the same time, for higher system efficiency, they are packed densely in the spectrum without any frequency guard bands [5].
Figure 1 Spectrum of an OFDM System
From Figure 1, there are seven sub-carriers for each individual channel. As the symbol rate increases as the channel bandwidth increases, this implementation allows for a greater data throughput than with an FDM system. The orthogonality of the carriers means that each carrier has an integer number of cycles over a symbol period. Due to this, the spectrum of each carrier has a null at the center frequency of each of the other carriers in the system. This results in no interference between the carriers, although their spectra overlap.
III.
Peak to Average Power Ratio
(PAPR)
The main issue when implementing OFDM in wireless communication technologies is its high PAPR. The input symbol stream of the IFFT should possess a uniform power spectrum, but the output of the IFFT may result in a nonuniform or spiky power spectrum. Most of transmission energy would be allocated for a few instead of the majority subcarriers. This problem can be quantified as the PAPR measure. It causes many problems in the OFDM system at the transmitting end. PAPR can be defined as the ratio between instantaneous powers to average power[6] represented as follows
(1)
The Root Mean Square (RMS) of the OFDM signal is defined as the root of the time average of
the envelope power ( ) where is denoted by (2)
where, x(t) is the OFDM signal as shown in equation (2.4). The value corresponds to a single OFDM symbol and relies on the sequence of information consisting coefficients . The average power of OFDM symbols can be described as
(3)
The PAPR of an OFDM signal will then can be defined as
(4)
(5)
When the input data power is normalized, then . Thus, the equations obtained are stated by
(6)
(7)
The maximum PAPR for an OFDM signal x(n) in a system is defined by [7],
=10 log (8)
Crest factor (CF) is the ratio of the maximum magnitude to the root mean square of the signal that is corresponding to the square root of PAPR by[8]
(9)
IV.
Principal Component Analysis
and reducing loss of information. This is because great datasets are progressively common and difficult to interpret [10].
PCA can be generalized as correspondence analysis (CA) in order to handle qualitative variables and as multiple factor analysis (MFA) in order to handle heterogeneous sets of variables. The goals of PCA are to extract the most important information from the data table. It then compressed the size of the data set by keeping only this important information. Next. PCA simplify the description of the data set. Lastly, it analyze the structure of the observations and the variables[11]. In order to achieve these goals, PCA computes new variables called principal components which are obtained as linear combinations of the original variables.
To transform the correlated data to uncorrelated set of data, there are two methods that can be done which are by singular value decomposition (SVD) of input data and by eigenvalue decomposition of the covariance matrix. These two methods are used to calculate the principal components.
A.
Covariance Matrix Method
Given the data matrix … where N is the total number of samples and represents the
sample. Compute the mean, of all samples as
(10)
Then, after calculating the mean of each variable in the data matrix, the mean-centring data are calculated by subtracting the mean from all samples by,
(11)
where D denotes the Mean-Centring Data. The covariance matrix, is then calculated as follows
(12)
Next, the eigenvectors and eigenvalues of the covariance matrix are computed. The eigenvectors are sorted according to their corresponding eigenvalues. Then, the eigenvectors that have the largest eigenvalues is selected.
B.
Singular Value Decomposition (SVD)
To calculate SVD, and S are first calculated by diagonalizing as follows where ,
(13)
The left singular vectors (L) is then calculated as follows,
(14)
The columns of the right singular vectors (R) represent the eigenvectors of or the principal components of the PCA. As the number of principal components and their eigenvalues are equal to q, thus the dimension of the original data matrix must be reversed to be compatible with SVD method. Thus, the mean-centring matrix is transposed before calculating the SVD method.
C.
SVD vs. Covariance Matrix
The eigenvalues and eigenvectors of the covariance matrix are calculated, where the covariance matrix is the product of , where . Using Equation (15) that is used to calculate SVD, the covariance matrix can be calculated as follows, where .
(15) Thus,
(16)
where represents the eigenvalues of or and the columns of the right singular vector (R) represent the eigenvectors of . To conclude, the square root of the eigenvalues that are calculated using the covariance matrix method are equal to the singular values of SVD method. Moreover, the eigenvectors of are equal to the columns of R. Thus, the eigenvalues and eigenvectors that are calculated using the two methods are equal.
V.
Results and discussion
Simulation is done for OFDM signal with PCA technique using MATLAB software based on the parameters described in Table 1.
PARAMETER VALUE
Modulation QAM
Size of Symbol 16, 64 Number of transmitting
symbols
64, 128, 256, 512
Oversampling factor 1
Number of runs 1000
A.
PCA
performance comparison of original OFDM and PCA method. Figure 2 shows simulation results when PCA technique is applied to the OFDM of 16-QAM with 64 subcarriers.
Figure 2 Variation in OFDM Signal while applying PCA technique
Figure 3 Screenshot of the MATLAB Window showing PAPR using the PCA method
Modulation Number of subcarrier, N
Original OFDM (dB)
PCA Technique (dB)
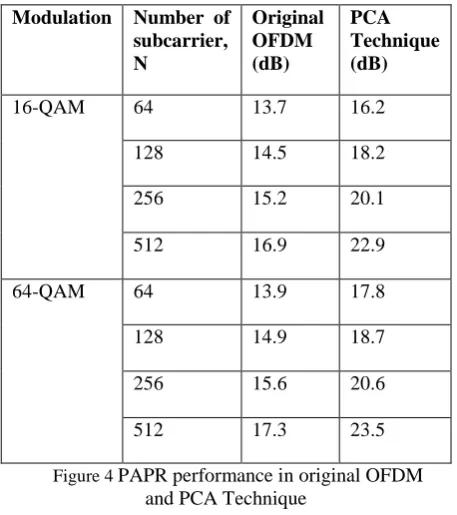
16-QAM 64 13.7 16.2
128 14.5 18.2
256 15.2 20.1
512 16.9 22.9
64-QAM 64 13.9 17.8
128 14.9 18.7
256 15.6 20.6
512 17.3 23.5
Figure 4 PAPR performance in original OFDM
and PCA Technique
Figure 3 shows the screenshot of the MATLAB Window showing PAPR using the PCA technique. Figure 4 shows the performance comparison of original OFDM and PCA method in 16-QAM and 64-QAM. Normal OFDM consists of several peaks. PCA method, it is seen that several peaks get suppress. It is shown that PCA did not reduced the value of PAPR as it is increased for about 0.3dB higher than its original value. Figure 3 shows the Screenshot of the MATLAB Window showing PAPR using the PCA technique
B.
PAPR CCDF
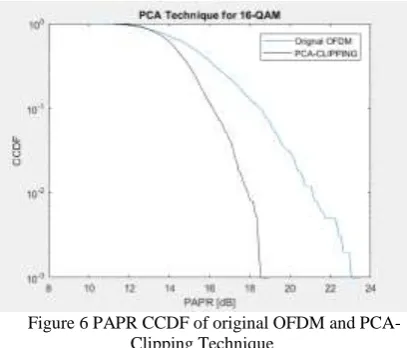
To analyze the PAPR reduction efficiency of the proposed scheme complimentary cumulative distribution function graph is plotted. The CCDF curve is a plot of relative power levels and probability. The x-axis shows the threshold values and in y-axis probability of PAPR value is greater than the threshold is plotted.
From Figure 5, the performance of PAPR CCDF shows the increase of PAPR value when implementing the PCA technique.
Figure 5 PAPR CCDF of original OFDM and PCA Technique
Figure 6 PAPR CCDF of original OFDM and PCA-Clipping Technique
As the results obtained from simulation of both 16-QAM and 64-QAM, PCA with clipping reduced the PAPR value significantly. Clipping technique clipped 70% of the peaks of the signal after PCA technique were applied. PCA with clipping technique improved the results of PAPR by decreased the value for about 0.3 dB to 0.6 dB from its original OFDM value.
Modulati on
No. of
Subcarrie rs, N
Origin al OFD M (dB)
PCA Meth od (dB)
PCA-Clippi ng Metho d (dB) 16-QAM 64 12.9 16.1 6.5
128 14.7 18.5 8.0 256 16.5 20.4 12.1 512 18.3 23.7 15.7 64-QAM 64 13.2 17.6 10.3
128 15.1 19.4 11.5 256 17.0 22.3 14.9 512 19.4 24.3 16.6
Several factors that may contributed on why PCA technique did not reduced PAPR value are identified. Removing more than three eigenvectors will commonly worsen the results. [13]. It is best to eliminate only the first two eigenvectors or principal component. Apart from that, data signal may be nonlinear. PCA is a linear method[14]. Thus, using linear PCA in nonlinear problems can sometimes be incompetent. Minor components are not usually consisting of noise or unimportant variance, but they also contain important information. If the minor components are eliminated, hence the important information will also be lost. This results in inconsistency of PCA technique
VI.
Conclusion
When the PCA technique is implemented in original OFDM signal, it is seen that several peaks get suppress compared to the original OFDM signal, but the value of PAPR did not reduced. With the implementation of clipping to the PCA technique, the PAPR value experienced significant reduction. It can be concluded that using PCA technique alone did not affect the value of high PAPR, but when combining PCA technique with other method, notable improvement of PAPR value can be achieved. The PCA technique did not improved the reduction of PAPR as it may be caused by several factors. Factors that could affect the deteriorated of PAPR value are the elimination of more than three eigenvectors, and data is nonlinear.
References
[1] 1. Hossain, M.S. and T. Shimamura,
Low-Complexity Null Subcarrier-Assisted OFDM PAPR Reduction With Improved BER. IEEE Communications Letters, 2016. 20(11): p. 2249-2252.
[2] 2. Rajbanshi, R., A.M. Wyglinski, and
G.J. Minden. Adaptive-mode peak-to-average power ratio reduction algorithm for OFDM-based cognitive radio. in Vehicular Technology Conference, 2006. VTC-2006 Fall. 2006 IEEE 64th. 2006. IEEE.
[3] 3. Gangwar, A. and M. Bhardwaj, An
overview: Peak to average power ratio in OFDM system & its effect. International Journal of Communication and Computer Technologies, 2012. 1(2): p. 22-25.
[4] 4. Bhardwaj, M., A. Gangwar, and D.
Soni, A review on OFDM: concept, scope & its applications. IOSR Journal of Mechanical and Civil Engineering (IOSRJMCE), 2012. 1(1): p. 07-11.
[5] 5. Walrand, J. and S. Parekh,
Communication networks: a concise introduction. Synthesis Lectures on Communication Networks, 2010. 3(1): p. 1-192.
[6] 6. Jawhar, Y.A., R.A. Abdulhasan, and
K.N. Ramli, Influencing Parameters in Peak to Average Power Ratio Performance on Orthogonal Frequency-Division Multiplexing System. 2006.
[7] 7. Agarwal, D., et al. PAPR reduction
using precoding and companding techniques for OFDM systems. in Computer Engineering and
Applications (ICACEA), 2015 International
Conference on Advances in. 2015. IEEE.
[8] 8. Cho, Y.-J., et al., Low-complexity PTS
schemes using dominant time-domain samples in OFDM Systems. IEEE Transactions on Broadcasting, 2017. 63(2): p. 440-445.
[9] 9. Jain, P.M. and V. Shandliya, A survey
Analysis (EFA). International Journal of Management, IT and Engineering, 2013. 3(6): p. 415. [10]10. Jolliffe, I.T. and J. Cadima, Principal
component analysis: a review and recent
developments. Phil. Trans. R. Soc. A, 2016. 374(2065): p. 20150202.
[11]11. Abdi, H. and L.J. Williams, Principal component analysis. Wiley interdisciplinary reviews: computational statistics, 2010. 2(4): p. 433-459. [12]Rajeswaran, D. and A.K. Nair. A novel approach for reduction of PAPR in OFDM communication. in
Communication and Signal Processing (ICCSP), 2016 International Conference on. 2016. IEEE.
[13]Martínez, A.M. and A.C. Kak, Pca versus lda.
IEEE transactions on pattern analysis and machine intelligence, 2001. 23(2): p. 228-233.