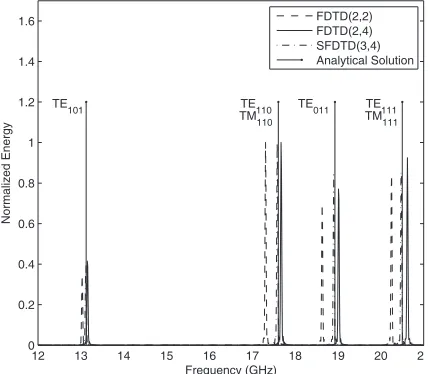
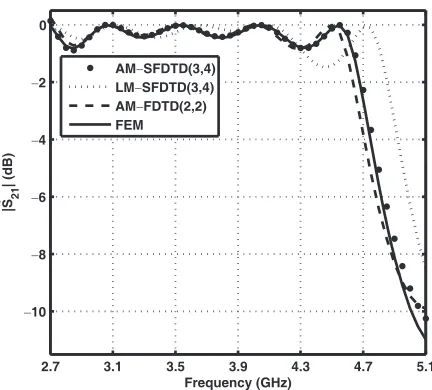
Waveguide Simulation Using the High-Order Symplectic Finite-Difference Time-Domain Scheme
Full text
Figure


Related documents
Table 2: Drain Current and Vth values for Gate Stack and Direct high-k Dielectric material.. The above table presents comparison of off current,on current and
61 , 62 Principally, the long lifetime excited states of UCNPs affect the mechanism of the up-conversion energy transferring process and this has been devel- oped different types
Microsoft Word LREC paper camera ready abl 3 docx Annotating High Level Structures of Short Stories and Personal Anecdotes Boyang Li1, Beth Cardier2, Tong Wang3, and Florian Metze4
Position Estimation with a Millimeter Wave Massive MIMO System based on Distributed Steerable Phased Antenna Arrays EURASIP Journal on Advances in Signal Processing Vukmirovic? et
Blood Vessels: In the identification of DR the Detection of blood vessels may be very most important via image processing. For the awareness of diabetic
specific to nursing students' satisfaction with all aspects of their academic program.. Several of the studies in the literature surveyed satisfaction related to
After 3 – 4 years of such a lifestyle program in persons at high risk of T2D, there was a decrease in inci- dent diabetes by 58% when compared to the control group in both
Description & Visual analysis: The above shown images are the resultant fused images by applying the described algorithms.If we observe the above images, we


