Test of internal-conversion theory with a measurement in
111
Cd
N. Nica1,a, J.C. Hardy1, V.E. Iacob1, T.A. Werke1, C.M. Folden III1, L. Pineda1, and M.B. Trzhaskovskaya2
1 Cyclotron Institute, Texas A&M University, College Station, Texas 77843, USA 2 Petersburg Nuclear Physics Institute, Gatchina 188300, Russia
Abstract. We have measured the K -shell and total internal conversion coefficients for the 150.8-keV E3 transition in111Cd:α
K =1.449(18) andαT =2.217(26) respectively. TheαK value agrees well with Dirac-Fock calculations, in which the effect of the K -shell atomic vacancy is included. It is consistent with our previous precise measurements of αK values, which cover a range of atomic numbers, and extends that range down to Z = 48. The αT measurement, however, disagrees by about two standard deviations from the calculatedαTvalue, whether the atomic vacancy is included or not.
1. Introduction
The internal conversion coefficient (ICC) is a critical property of each nuclear electromagnetic transition; it is defined as the ratio of electron toγ-ray emission. As the origin of the emitted electrons can in general be any one of the atomic shells, one can denote the ICCs corresponding to each shell byαK,αL,αM, and so on; and their sum by αT, the total ICC.
The ICCs are essential ingredients in the construction of nuclear decay schemes: They are required to determine total transition intensities, and they can be used in the assignment of spins and parities. Moreover, internal conversion plays an important role in medical, pharmaceutical and environmental applications of nuclear science. Thus it is important to the nuclear data community to have access to precise measurements of ICCs and to have the ability to calculate ICCs reliably where measurements do not exist.
For several decades, most ICC values appearing in nuclear databases were obtained from tabulated calculations, partly because the ICCs for most transitions had never been measured, and partly because the accuracy and precision of the values that had been measured were generally rather modest, being in the 5–10% range. In fact, this precision is quite adequate if the goal is to determine spins and parities based on the multipolarity of a transition, but it is far from adequate if precise transition intensities are sought. All ICC databases were elaborated using the Dirac-Slater method where the exchange between electrons was taken into account approximately. The agreement between theory and experiment was considered as satisfactory despite the fact that theoretical ICCs for high-multipolarity transitions systematically turned out to be 2–3% larger than experimental values.
About 15 years ago, this situation was seen to be unsatisfactory and Raman et al. [1] published a careful study that compared the available tables of calculated ICCs with one another and with a compilation of all
ae-mail:[email protected]
published measurements of ICC values. By then the ICC calculations based on the Dirac-Fock method were developed [2] where the exchange was included exactly between bound electrons as well as between bound and continuum ones. Extensive comparison of new theoretical ICC with measured values for 100 transitions having experimental uncertainties ≤ 5% has showed that the Dirac-Fock calculations reproduce experimental values, on average, at the 1.5% level. However since the measurements themselves were far from precise, it was difficult to draw a very firm conclusion. In particular, one ambiguity was made manifest: How should the atomic vacancy created by the ejected electron be treated? Some calculations took account of the vacancy; other did not. With about 20 ICCs measured with a precision of 2% or better, Raman et al. concluded that Dirac-Fock calculations by Band et al. [3] with the vacancy ignored agreed statistically better with data than a similar calculation by the same authors in which the effect of the vacancy was incorporated. This agreement influenced the National Nuclear Data Center (NNDC) and the Nuclear Structure and Decay Data international network (NSDD) to adopt the former calculations in the Evaluated Nuclear Structure Data File (ENSDF), the most comprehensive nuclear database available, which is used for the Nuclear Data Sheets published by Elsevier.
From a physics perspective, this choice is unsupport-able. The lifetimes of atomic vacancies are well known to be between 10−15 and 10−17 s [4]; and it is easy to show that this time is longer – usually much longer – than the time it takes for a conversion electron to leave the atom [5]. Surely in the calculation of ICCs the continuum wave function of the ejected electron must be calculated in the field of the ion, not of the neutral atom.
A limitation of the Raman et al. study was the striking lack of precise ICC measurements. Consequently, in 2003 we started a program at Texas A&M University to measure benchmark ICC values, with the goal to provide a more precise and reliable data set, one particularly geared to addressing the atomic-vacancy issue. So far, we have published a series of papers [5–13] that report
150.82
E3
245.40
E2
11/2
-
396.22
245.40
0.0
Cd
111
48
63
48.54 min
stable
1/2
++
5/2
84.5 ns
Figure 1. Decay scheme for the 48.5-min isomer in111Cd. The data are taken from Ref. [14].
ICC values in 6 nuclei, covering the range 48 < Z < 78, with a precision of 2% or better. Here we outline our measurement of the 150.8-keV E3 transition in 111Cd, which extended the range of nuclei down to Z =48. We report bothαK andαT values to precisions of about 1.2% [13]. An overview of results from our whole series of measurements is also presented, clearly demonstrating that the atomic vacancy must be included in ICC calculations.
2. Experimental method overview
The method we have employed in our previous measurements depends not upon detecting the conversion electrons but rather the characteristic K x rays emitted following the departure of K -shell conversion electrons.
Since both the K x rays and the γ rays from a
given transition can be recorded in same HPGe-detector spectrum, their relative intensities can be determined more reliably than if separate detectors had to be used for the electron and theγ ray. This method is suitable for decay schemes dominated by a single transition, in which case the K -shell ICC is derived according to the formula:
αK = NK
Nγ ·
γ
K ·
1
ωK, (1)
where NK and Nγ are the total numbers of observed
K x rays and γ rays, respectively; K and γ are the corresponding photopeak detection efficiencies; andωKis the fluorescence yield, which is the fraction of K -shell vacancies that result in the emission of a K x ray. For cadmium we useωK = 0.842(4), which is taken from the evaluation of Sch¨onfeld and Janssen [15], the same source that we used for all our previous measurements. It provides reliableωK values with sub-percent precision, in this case
±0.5%.
The decay scheme of the 48.5-min isomer in 111Cd, appearing in Fig. 1, shows a cascade of two transitions, both of which can convert in the K shell. This does not satisfy the single-transition condition required for Eq. (1), but can be accommodated by a modified version of that equation:
αK 150= NK
Nγ150
·γ150
K ·
1
ωK −αK 245·
Nγ245
Nγ150
·γ150 γ245
·
(2) The numerical subscripts designate the transition – either the 150.8-keV or 245.4-keV one – to which the quantities refer. EvidentlyαK 150, the quantity we seek to determine, now depends onαK 245, but since the 245.4-keV transition is pure E2, with a calculated K -conversion coefficient about an order of magnitude smaller than αK 150, it has very little impact on the precision with which αK 150 can be determined.
The presence of a second transition in cascade also allows us to determineαT 150by using the equation:
(1+αT 150)· Nγ150 γ150
=(1+αT 245)· Nγ245 γ245
· (3)
Just as we found for the αK values in Eq. (2), here αT 245 is much smaller thanαT 150 (∼0.06 vs.∼2.2) so the experimental result obtained forαT 150is rather insensitive to the calculated value used forαT 245.
Note that in obtaining calculated values forαK 245and αT 245 for use in Eqs. (2) and (3) we adopted the average of the values calculated with and without the atomic vacancy as given by the code BrIcc [16] (implemented at http://bricc.anu.edu.au). We also attached an error bar to the averages that encompassed both calculated results. The values we arrived at were
αK 245=0.05326(17) (4)
αT 245=0.06351(17). (5)
In this way, we ensured that the αK 150 andαT 150 values obtained from Eqs. (2) and (3) were independent of the treatment of the vacancy forαK 245andαT 245.
In applying Eqs. (2) and (3) we also took care that the N values we used incorporated corrections for coincidence summing, including the effect of angular correlation between the two gamma rays.
We used the same HPGe detector as in our previous measurements to measure both the γ rays and the K x rays, a detector whose efficiency has been calibrated thoroughly to sub-percent precision over the energy range from 50 to 3500 keV [17–19]. Precisely measured data were combined with Monte Carlo calculations from the CYLTRAN code [20] to yield a very precise and accurate detector efficiency curve over the whole energy interval. We recently extended the well-calibrated region down to 22.6 keV [12], the average energy of silver K x rays.
Table 1. The contributions of identified impurities that affect the cadmium K x-ray peaks.
Source Contaminant Contribution to spectrum (%)
S1 S2
115Cd In K x rays 1.81(8) 2.71(6) 117Cd In K x rays 0.113(12) 0.125(9) 117In Sn K x rays 0.18(3) 0.21(3) 117mIn In+Sn K x rays 0.603(9) 0.484(5) 116mIn In K x rays 0.010(2) 0.006(1)
3. The
111Cd experiment
Two sources were prepared – S1 and S2 – from 95.88%-enriched110CdO electroplated onto a 10-µm-thick foil of 99.999% pure aluminum. We produced111Cd by activating each source, two months apart, with a flux of thermal neutrons of ∼7×10¹²n/(cm2s) at the TRIGA reactor, located at the Texas A&M Nuclear Science Center. The initial activity of111mCd was∼80 kBq for each source.
We collected HPGe spectra from both sources using the same detector and source-to-detector distance (151 mm) as was used in the original efficiency calibration [18]. Our analog-to-digital converter was an Ortec TRUMPT M-8k/2k card controlled by MAESTROT M software. With source S1 we acquired 14 8k-spectra over a two-week period; with S2 we acquired 10 spectra in one week. Since 111mCd has a half-life of only 49 min, all but the first few spectra recorded in each case were used solely as an aid in identifying contaminant activities. All subsequent analysis for 111mCd itself was based on only two spectra – the first 9-min spectrum taken from S1 and the first 15-min spectrum from S2 – in which the111mCd activity was most dominant. It is the results from these two spectra that are reported here.
4. Data analysis
The recorded spectra were thoroughly analyzed to identify all radioactive isotopes present in our sources and to determine quantitatively those contaminants affecting the energy regions of interest, around the cadmium K x rays (23–27 keV) and the 150.8- and 245.4-keV γ-ray photopeaks.
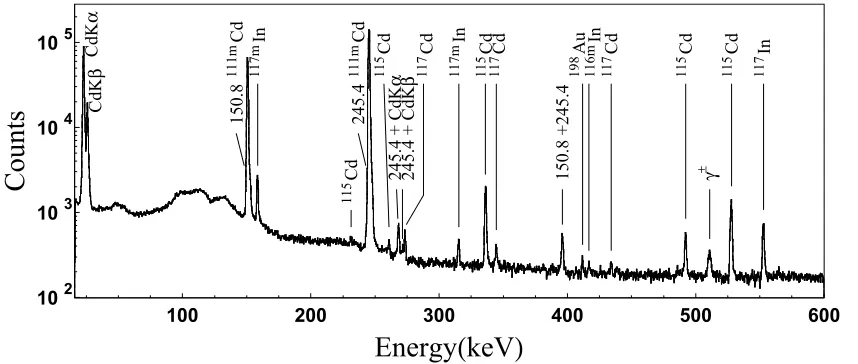
Figure 2 illustrates the analysis: We identified all the peaks including the weakest based on their energies and intensities, by using our efficiency cal-ibration and the electronic databases, ENSDF (at
http://www.nndc.bnl.gov) and the Lund Table of
Ra-dioactive Isotopes (at http://nucleardata.nuclear.
lu.se/toi). In total, we found five weak sources of
contamination that affect the cadmium K x ray region. These are listed in Table 1, where their contributions are given as percentages of the total cadmium K x rays recorded. In all, the impurities contribute less than 4% so their subtraction had very little affect on the precision of our final result. No impurities were found to interfere with either of theγ-ray peaks of interest.
The peaks were fitted with the GF2 program [21], in a version which allows us to extract the total number of counts above background within selected energy limits. The “total counts” obtained for all three regions of interest are listed in the first column of Table2. In the case of the x rays, the row immediately below gives the total number
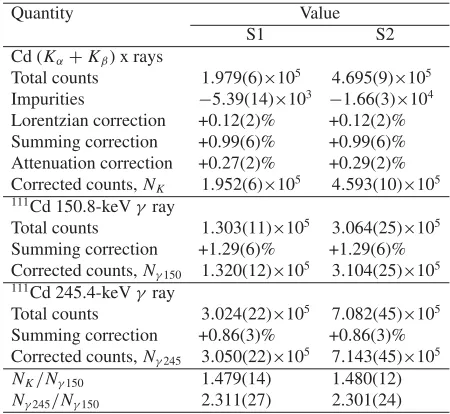
Table 2. The total number of counts (or areas of the peaks) for 111mCd K x rays and the 150.8- and 245.4-keVγ rays, followed by corrections and the corrected area-ratios information required to extract the value ofαK 150.
Quantity Value
S1 S2
Cd (Kα+Kβ) x rays
Total counts 1.979(6)×105 4.695(9)×105 Impurities −5.39(14)×103 −1.66(3)×104 Lorentzian correction +0.12(2)% +0.12(2)% Summing correction +0.99(6)% +0.99(6)% Attenuation correction +0.27(2)% +0.29(2)% Corrected counts, NK 1.952(6)×105 4.593(10)×105 111Cd 150.8-keVγray
Total counts 1.303(11)×105 3.064(25)×105 Summing correction +1.29(6)% +1.29(6)% Corrected counts, Nγ150 1.320(12)×105 3.104(25)×105 111Cd 245.4-keVγray
Total counts 3.024(22)×105 7.082(45)×105 Summing correction +0.86(3)% +0.86(3)% Corrected counts, Nγ245 3.050(22)×105 7.143(45)×105
NK/Nγ150 1.479(14) 1.480(12)
Nγ245/Nγ150 2.311(27) 2.301(24)
of impurity counts to be subtracted, as calculated from the percentage breakdowns in Table1.
For the x-rays, the peak areas thus obtained were further corrected to account for the long tails characteristic of their Lorentzian shapes. For this purpose we used realistic Voigt functions to generate simulation x-ray peaks that were subsequently analyzed with GF2 in the same manner as our actual data. Thus we established the appropriate correction factor (+0.12%) to apply to our analysis of real data. It also appears in Table2.
Also listed in the table are the summing corrections that account for real coincidences between the twoγ rays in cascade or between oneγ ray and a K x ray from the other transition. In either case, the individual signals are lost and are replaced by a single summed-energy signal. The corrections listed in Table2effectively add back the lost events to where they belong. The final correction appearing in the table is to compensate for the finite thickness of our samples, which produces more attenuation of the K x rays than of the higher-energyγrays.
The ratios NK/Nγ150and Nγ245/Nγ150 that appear in Eqs. (2) and (3) are also listed at the end of Table2. Their weighted average is:
NK/Nγ150=1.479(10)
Nγ245/Nγ150=2.305(18). (6)
The remaining quantities required for Eqs. (2) and (3) are the efficiency ratios, γ150/γ245 and γ150/K. The former is straightforwardly obtained from our efficiency curve via CYLTRAN Monte Carlo calculations [18]. The latter is more challenging. Photon scattering by air or by denser materials in the neighborhood of the source and detector results in events appearing in the spectrum at energies below that of each photopeak. This is particularly troublesome for photopeaks below 50 keV because much of this scattered radiation is indistinguishable from the peak itself.
102 103 104 105
100 200 300 400 500 600
CdK
α
CdK
β 111m
Cd
150.8
111m
Cd
245.4
245.4 + CdK
α
245.4 + CdK
β
150.8 +245.4
117m
In
115
Cd
115
Cd
117
Cd
117m
In
115
Cd
117
Cd
198
Au
116m
In
117
Cd
115
Cd
γ
±
115
Cd
117
In
Energy
(
keV
)
Counts
Figure 2. Portion of the x- andγ-ray energy spectrum measured for 15 min with source S2. Room background has been subtracted. The background was recorded before and after the source data were measured; and was normalized to the same live-time. Peaks are labeled by theirβ-decay parent; theγ-ray peaks associated with111mCd decay also have their energies in keV marked.
employ as low-energy calibration the well-known decay of109Cd, which emits 88-keVγ rays and silver K x rays. The latter are very close in energy to the cadmium K x rays observed in the current measurement. Note that we are not distinguishing between Kαand Kβx rays. Because scattering effects are pronounced at these energies we have chosen as before to use only the sum of the Kα and Kβ x-ray peaks. For calibration purposes, we consider each sum to be located at the intensity-weighted average energy of the component peaks1—23.62 keV for cadmium and 22.57 keV for silver.
We obtain the required ratio, γ150/K 23.6 from the following relation:
γ150 K 23.6
= γ88.0 K 22.6
· γ150 γ88.0
·K 22.6 K 23.6
, (7)
where we have identified the K x rays by their centroid energy for clarity. We take the ratioγ88/K 22.6= 1.069(8) from our previously reported measurement [12], while the other two ratios on the right hand side were calculated with CYLTRAN:γ150/γ88.0= 0.8707(13) andK 22.6/K 23.6= 0.9849(9). The latter ratio covers an energy span of only 1 keV and is thus very insensitive to scattering effects.
Finally the two efficiency ratios needed for Eqs. (2) and (3) are thus:
γ150 γ245
=1.3123(14)
γ150
K =0.917(7). (8)
5. Results
Substituting Eqs. (4), (6), and (8) into Eq. (2), we obtain:
αK 150=1.449(18). (9)
This result can be compared with the calculated values, 1.425(1) (no vacancy) and 1.451(1) (vacancy included
1To establish the weighting, we used the intensities of the
individual x-ray components from Table 7a in Ref. [22].
in the so-called frozen orbital, FO, approximation [6]). Our measured value is in very good agreement with the calculated value that includes the atomic vacancy, and is in disagreement with the one that does not.
Substituting Eqs. (5), (6), and (8), into Eq. (3), we obtain:
αT 150=2.217(26). (10)
In this instance the calculated values are 2.257(1) (no vacancy) and 2.284(1) (FO vacancy included). Unlike αK, the αT result is lower than both calculations, with the maximum disagreement (∼2.5σ) being with the FO calculation.
TheαK 150value has only once been measured before, by N´emeth and Veres [23]. They also used an HPGe detector for both the x and γ rays, and obtainedαK 150= 1.29(11), which is statistically consistent with our result but is much less precise.
ForαT 150, three measurements have previously been reported: 2.286(9) [24], 1.76(8) [25], and 1.98(5) [23]. The first measurement used a NaI(Tl) scintillator; the other two, an HPGe detector. Raman et al. [1] included all of them in their survey, adopting 2.12(11) forαT 150. None of the three previous measurements agree with one another or with our new result; however our result does agree with the value adopted by Raman et al. but is much more precise.
Why do both types of calculation disagree with our αT result? One possible explanation arises from the fact that the 150.8-keV transition is hindered by a factor of 104 relative to the single-particle Weisskopf estimate [2]. This could produce a “penetration” effect associated with the change from transition electromagnetic potentials used for a point nucleus to transition potentials required for a realistic finite-sized nucleus [26]. For strongly hindered transitions, the penetration effect can give rise to non-negligible nuclear matrix elements in the expressions for the ICCs, which can thus become dependent on nuclear structure details and nuclear transition dynamics.
Table 3. Comparison of the six measuredαK values published in Refs. [5–13] with Dirac-Fock theoretical calculations that either ignored the atomic vacancy (the “No vacancy” column) or included via the “frozen orbitals” approximation (the “Vacancy” column). The totalχ2values demonstrate a dramatic preference for the “frozen orbitals” calculations. The uncertainties of the theoretical values are negligible compared with the experimental ones and were omitted.
Parent Transition MeasuredαK CalculatedαK Energy(keV) No vacancy Vacancy 197mPt 346.5(2) 4.23(7) 4.191 4.276 193mIr 80.22(2) 103.0(8) 92.0 103.3 137mBa 661.659(3) 0.0915(5) 0.09068 0.09148 134mCs 127.502(3) 2.742(15) 2.677 2.741 119mSn 65.66(1) 1610(27) 1544 1618 111mCd 150.853(15) 1.449(18) 1.425 1.451
χ2 219 0.68
Figure 3. Percentage differences between the measured and calculated ICCs for two DiracFock calculations: one (a) is without the atomic vacancy; the other (b) is with it included in the “frozen orbital” approximation. Shown with solid diamonds are the twenty cases selected by Raman et al. [1] with highest precision - better than 2%. OurαK measured values, labeled on the figure, appear as open circles, with the original Raman et al. values shown in gray. The transition multipolarities E2, E3, and
M4, are indicated at the bottom. We have measured two E3 and
four M4 transitions.
the discrepancy we observe here between experiment and theory for αT. Moreover, Krpi´c and Ani˘cin [29] showed (for M1 transitions) that it is possible under particular conditions for the penetration to be “hidden” by a cancellation that can affect one atomic shell but not the others. Hypothetically this could also explain why in our case theαK looks to be unaffected by penetration effects, whileαT is significantly reduced.
6. Current status of precision ICC
measurements
AllαK experimental values we published in Refs. [5–13] are compared in Table 3 and Fig. 3 with both types of Dirac-Fock calculations: either excluding the atomic vacancy; or including it through the so-called “frozen orbitals” assumption. In both approximations the electron
wave functions in the initial bound state are calculated in the self-consistent field of a neutral atom. The difference occurs in the continuum final states: for the no-vacancy calculation the neutral atom is used again, while for the “frozen orbitals” approximation the continuum wave function is calculated in the ion field constructed from the bound wave functions of the neutral atom; this assumes that there is insufficient time for the atomic orbitals to have rearranged themselves. An inspection of Fig.3and theχ2 values in Table3 clearly shows good agreement with the “frozen orbitals” approximation and disagreement with the no-vacancy assumption. Our currentαKresult is consistent with all our previous measurements.
Finally, it should be noted that during the course of our series of measurements, Kib´edi et al. [16] were prompted to reevaluate the ICCs with our measurements now included, and to develop BrIcc, a new database obtained from the basic code by Band et al. [3]. In conformity with our conclusions, it employed a version of that code which incorporates the vacancy in the “frozen orbital” approximation. The BrIcc database was subsequently adopted by the NNDC and is available online for the determination of ICCs.
We wish to thank the staff of the Texas A&M Nuclear Science Center for their help in conducting neutron activations. This material is based upon work supported by the U.S. Department of Energy, Office of Science, Office of Nuclear Physics, under Award Number DE-FG03-93ER40773, and by the Robert A. Welch Foundation under Grant No. A-1397.
References
[1] S. Raman, C.W. Nestor, Jr., A. Ichihara, M.B. Trzhaskovskaya, Phys. Rev. C 66, 044312 (2002); see also the electronic addendum to this paper, the location of which is given in the paper’s reference 32 [2] I.M. Band, M.A. Listengarten, M.B. Trzhaskovskaya,
Bull. Akad. Sci. USSR, Phys. Ser. 53, 85 (1989) [3] I.M. Band, M.B. Trzhaskovskaya, C.W. Nestor, Jr., P.
Tikkanen, S. Raman, At. Data Nucl. Data Tables 81, 1 (2002)
[4] O. Keski-Rahkonen, M.O. Krause, At. Data Nucl. Data Tables 14,139 (1974)
[5] J.C. Hardy, N. Nica, V.E. Iacob, S. Miller, M. Maguire, M.B. Trzhaskovskaya Appl. Rad and Isot. 87, 87 (2014)
[6] N. Nica, J.C. Hardy, V.E. Iacob, S. Raman, C.W. Nestor Jr., M.B. Trzhaskovskaya, Phys. Rev. C 70, 054305 (2004)
[7] N. Nica, J.C. Hardy, V.E. Iacob, J.R. Montague, M.B. Trzhaskovskaya, Phys. Rev. C 71, 054320 (2005)
[8] N. Nica, J.C. Hardy, V.E. Iacob, W.E. Rockwell, M.B. Trzhaskovskaya, Phys. Rev. C 75, 024308 (2007)
[9] N. Nica, J.C. Hardy, V.E. Iacob, C. Balonek, M.B. Trzhaskovskaya, Phys. Rev. C 77, 034306 (2008) [10] J.C. Hardy, N. Nica, V.E. Iacob, C. Balonek, M.B.
Trzhaskovskaya, Appl. Rad. Isot. 66, 701 (2008) [11] N. Nica, J.C. Hardy, V.E. Iacob, J. Goodwin,
C. Balonek, M. Hernberg, J. Nolan, M.B.
[12] N. Nica, J.C. Hardy, V.E. Iacob, M. Bencomo, V. Horvat, H.I. Park, M. Maguire, S. Miller, M.B. Trzhaskovskaya, Phys. Rev. C 89, 014303 (2014)
[13] N. Nica, J.C. Hardy, V.E. Iacob, T.A. Werke, C.M. Folden, L. Pineda, M.B. Trzhaskovskaya Phys. Rev. C 93, 034305 (2016)
[14] J. Blachot, Nucl. Data Sheets 110, 1239 (2009) [15] E. Sch¨onfeld, H. Janssen, Nucl. Instrum. Methods
Phys. Res. A 369, 527 (1996)
[16] T. Kib´edi, T.W. Burrows, M.B. Trzhaskovskaya, P.M. Davidson, C.W. Nestor Jr., Nucl. Instrum. Meth. in Phys. Res. A 589, 202 (2008)
[17] J.C. Hardy, V.E. Iacob, M. Sanchez-Vega, R.T. Effinger, P. Lipnik, V.E. Mayes, D.K. Willis, R.G. Helmer, Appl. Radiat. Isot. 56, 65 (2002)
[18] R.G. Helmer, J.C. Hardy, V.E. Iacob, M. Sanchez-Vega, R.G. Neilson, J. Nelson, Nucl. Instrum. Methods Phys. Res. A 511, 360 (2003)
[19] R.G. Helmer, N. Nica, J.C. Hardy, V.E. Iacob, Appl. Radiat. Isot. 60, 173 (2004)
[20] J.A. Halbleib, R.P. Kemsek, T.A. Melhorn, G.D. Valdez, S.M. Seltzer, M.J. Berger, Report SAND91-16734, Sandia National Labs (1992)
[21] D. Radford, http://radware.phy.ornl.gov/
main.htmland private communication
[22] R.B. Firestone, Table of Isotopes, ed. V.S. Shirley (John Wiley & Sons Inc., New York, 1996) p. F-44 [23] Zs. N´emeth and ´A. Veres, Phys. Rev. C 35, 2294
(1987)
[24] D.C. Lu, Phys. Rev. 119, 286 (1960)
[25] Ch. Suranarayama, N. Venkateswara Rao, S. Bhuloka Reddy, G. Satyanarayana, D.L. Sastry, J. Phys. Soc. Japan 54, 4539 (1985)
[26] M.A. Listengarten, Anomalous Internal Conversion Coefficients in Electromagnetic Transitions in Atomic Nuclei, in Modern Methods in Nuclear Spectroscopy, ed. B. S. Djelepov (Nauka, Leningrad, USSR, 1985) p. 142 (in Russian)
[27] G. Kramer, S.G. Nilsson, Nucl. Phys. 35, 273 (1962) [28] J. Le Tourneux, Nucl. Phys. 74, 172 (1965)
![Figure 1. Decay scheme for the 48.5-min isomer indata are taken from Ref. [ 111Cd. The14].](https://thumb-us.123doks.com/thumbv2/123dok_us/8138492.1356578/2.595.61.275.75.335/figure-decay-scheme-isomer-indata-taken-ref-the.webp)