1
Drought forecast using standardized precipitation index and
Markov chain in Iran
Hadi Siasar1,* F.shahrdarazi2, Saeed Shojaei3 1Department of Agriculture, Payame Noor University, Iran
2Department of Math, Payame Noor University, Iran
3Department of Management the Arid and Desert Regions College of Natural Resources and Desert Yazd University, Yazd, Iran
Abstract
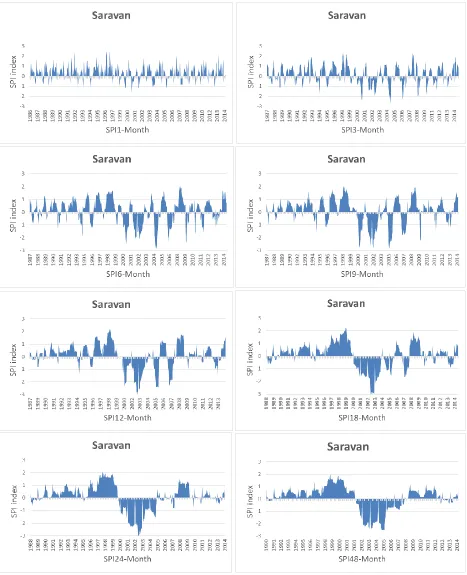
Drought is a natural disaster which occurs as a result of a lack of ambient humidity due to reduced rainfall compared to normal conditions. Successful planning and management of water in agriculture and proper use of water resources is subject to recognition of this disaster. As drought is inevitable, we can minimize its damages through monitoring and forecasting. It is therefore important to predict drought in the planning and management of water resources. In studying the status of drought in Saravan city, rain annual data of synoptic station in the period (1976-2015) and the Standardized Precipitation Index (SPI) in a twelve-month time scale have been used. Then the Markov chain model was used to calculate the probabilities of the balance of the periods of wet, dry, and normal in SPI. The results showed that the probability of balance in wet, dry, and normal periods in Saravan station is 80.2, 24.20, and 96.76 respectively. This means that the area is most of the time in normal conditions and the probability of draught is about 7 times bigger than rain.
Key words: drought, SPI index, Markov chain, Iran.
Introduction
Drought is a natural phenomenon that can happen anywhere and cause considerable losses to human and nature. Therefore, it is essential to study it. Different definitions have been provided for drought phenomenon. According to Palmer [12], drought is the lack of regular and non-normal moisture in a given time period, usually one year. Drought has many forms the first of which is meteorological drought and occurs as a result of lack of rainfall and can cause significant economic losses. This may be followed by other kinds of drought such as hydrological, agricultural, and economic drought. Drought occurs in all climatic regions ranging from arid, semi-arid, and sub-humid areas. All regions of the world temporarily, but irregularly suffer from drought conditions. However, the situation is mostly seen in those areas where the climate is unevenly affected by different climatic systems. (Raziei et.al [13]). One of the critical steps in the study of drought and rain is drought monitoring and prediction using the Standardized Precipitation Index (SPI) 2, which is one of the most comprehensive indices of drought and rain. Standardized Precipitation was used for monitoring dry periods between the years 1993 and 1994 in Colorado [11]. A large number of drought indices have been proposed so far, including PDSI1, Palmer [12] which has many applications in the United States, Deciles index by Gibbs and Maher [8] used in Australia, effective drought index (EDI2) by Byun and Wilhite [6], and RDI3 by T-Sakiris and Vangelis [15]. Among them, SPI index has been accepted as reference index by the World Meteorological Organization (WMO).
Statistical analysis are done through different methods such as time series analysis, linear and nonlinear correlation, ARMA4, and known statistical distribution such as normal distribution, Gamble, Pearson, and etc. What is used in this study is the statistical method of first order Markov chain. Markov chain model is used in different fields such as meteorological, climatology, economy, and industry. Clark and Karas [7] examined the analytical relationship between rainfall and runoff in the catchment area for a probability distribution model and used the conditional probability distribution model (Markov chain) to show the sequence of precipitation and sweating
2
in different geographical widths. Azzam et.al [4] benefitted from Markov chain model to assess the efficiency of ranges with different strategies. They examined the effects of rainfall, the number of livestock, and the way of grazing on pasture product. In Iran, Adl [1] also used first order Markov chain to determine the probabilities of water supply from Amir Kabir Lake. He concluded that the probability of water shortage in the long run is 0.2.
Jafari Bahi [9] used Markov chain to examine and analyze the probabilities of consecutive dry (non-rainy) days, and wet (rainy) days with a threshold of 0.1 mm per day for the months of November to April 1995-1965 at the stations in Bushehr, Shiraz, Isfahan, Karaj, and Bandar-e Anzali. He concluded that the stations studied fit the first order Markov chain. Alizade and Ashgar Toosi[2] studied the prediction of weather conditions in Khorasan Razavi province using SPI profile and Markov chains.
In Sistan Baloochestan province, the study of Raziei et.al [2] can be mentioned which used Markov chain in the field of random behavior of SPI. It should be noted that they did not study the anticipation but Alizadeh et al [3] used the SPI index and Markov chain to monitor and predict drought in Sistan and Baluchestan, respectively.
In this study, the SPI index and Markov chain were used to examine the possibility of long-term drought and rain for the station located in the city of Saravan. For this purpose, the amount of precipitation of the last 39 years in synoptic station of Saravan.
1. The materials and methods 1.1The studying region
3
Figure 1: the studying region of Saravan Province in Sistan and Baluchistan province 2-1 SPI drought index
SPI index is a powerful tool in rainfall data processing and its aim is to assign a numeral value to the rainfall through which areas with various weather conditions can be compared with each other. For instance, what makes drought in torrid areas is the amount of rainfall that is considered as heavy precipitation in the desert areas. In this classification, drought will appear for a period of time when SPI index is lower than -1. The end of drought term can be declared when this index gains positive amount. According to the aforementioned computing method in SPI index classification, the status of this region can be studied from the view point of drought occurrence and its process. One of the SPI advantages is that SPI computation is based on the rainfall data and it isn’t dependent on the conditions of soil humidity. A yearly rainfall amount of each station is used within a long term statistical period (at least 30 years) to specify SPI index. The main property of SPI is its flexibility in measuring drought in various time scales since drought has a widespread scope from the viewpoint of period. So, its assessment and monitoring with different kinds of time scales is essential. SPI is calculated with 2 forms of short term (1, 3, 6 and 9 months) and long term (12, 24, 48 and 72 months). In each time scale, the rainfall of the specific period is collected with the rainfall of the same period for all years in which the information is recorded. Short term SPI reflects the conditions of soil humidity and specifies the seasonal estimation of rainfall. There are more changes in this model and it shows that short term index has more sensitivity to the changes of humidity conditions and as n is lengthened, new month rainfall has less effect on the total rainfall and the index answers slowly. So, with the smallest change in monthly rainfall it goes quickly up zero and if it is negative, it goes below zero. Long term SPI reflects drought better and the amounts of SPI for this time scale is related to the flood, the level of waters and subterranean water resources. Short term time scale has more fluctuations than long term one and it is sensitive to the humidity conditions.
3-1. method of SPI index calculation
To calculate this index, Gama distribution is used for fitting long term precipitation which is done after doing necessary calculations and specifying parameters related to the SPI index. As was stated, SPI calculation includes density function fitting of Gama probability on rainfall frequency distribution for a specific station.
G(x) Gama density function is obtained by this relation:
𝑔(𝑋) = 1
βαΓ(𝛼)𝑋
(𝛼−1)e−X β⁄ (1)
In this equation, 𝛼is the parameter of the form 𝛽;: the parameter of scale x;: the amount of rain and Γ(𝛼) is Gama function that is defined as Γ(𝛼) = ∫ 𝑡∞ ∝−1𝑒−𝑡𝑑𝑡
° . Density distribution
parameters of Gama probability from the sample data is estimated by method of maximum likelihood for each station and for elective time scale and for each month of year; by using this method, McKee and coworkers estimated 𝛼 and 𝛽coefficients based on the below relation[11]
𝛼̂ = 1
4𝐴[1+ √1+
4𝐴
3] , 𝛽 =
𝑥 𝛼
̂
(2)
( 3 ) 𝐴 = ln(x) =∑ln (𝑥)
𝑛
4
n is the number of rainfall observations; furthermore, 𝑿̅is the average of aggregate rainfall for one month during a statistical period. Because Gama function is not defined for x=0 (0 mm rainfall) and rainfall distribution may have the value of zero, the total aggregate probability which also includes the value of zero is obtained by this relation:
H(X) = q + PG(X) (4)
In which q is the probability of zero rainfall amount and p=1+q. if m is the number of zero rainfall data in a time series of n, q can be obtained by this relation: 𝑞 =𝑚
𝑛
After calculating the total aggregate probability (H(X)) standard normal random variable value,
probability is calculated with the aforementioned probability which has zero average and standard deviation 1. This value is SPI index. These relations offer Z or SPI from the values of H(X).
If:( 0 < 𝐻(𝑋) ≤ 0/5) 𝑍 = 𝑆𝑃𝐼 = − [𝑡 − 𝑐°+𝑐1𝑡+𝑐2𝑡2
1+𝑑1𝑡+𝑑2𝑡2+𝑑3𝑡3]
(6)
( 0/5 < 𝐻(𝑋) ≤ 1) :
if
𝑍 = 𝑆𝑃𝐼 = + [𝑡 − 𝑐°+𝑐1𝑡+𝑐2𝑡2
1+𝑑1𝑡+𝑑2𝑡2+𝑑3𝑡3] (7)
if :0 < 𝐻(𝑋) ≤ 0.5
𝑡 = √𝑙𝑛 ( 1
𝐻(𝑋)2)
and if:0.5 < 𝐻(𝑋) ≤ 1
𝑡 = √𝑙𝑛 ( 1
1−𝐻(𝑋)2)
In these relations, c0, c1, c2, d1, d2 and d3 are fixed value and H(X) is aggregate probability. 𝑑1 = 1.432788
𝑑2 = 0.18926
𝑑3 = 0.001308
𝑐° = 2.515517 𝑐1 = 0.802853 𝑐2 = 0.010328
Drought classification is shown according to the SPI index in the table (1).
Table1. Classification of wet and arid periods according to SPI index (Mckee and coworkers 1993)
classification SPI values Probability percent
Extremely wet 2.0+ 2.3
Very wet 1.5 to 1.99 4.4
moderately wet 1.0 to 1.49 9.2
near normal -.99 to .99 68.2
moderately dry -1.0 to -1.49 9.2
Severely dry -1.5 to -1.99 4.4
5
6
7
5-1 Markov chain
Markov chains are used in hydrology and meteorology for stenciling processes like rainfall, river current, soil humidity and water supply in reservoirs. If we suppose that X (t) is a process with discrete value that starts in the time 0 and continues during time then the values of X(t) can be shown as XT (T=0, 1, …) and we have: (10)
P[x(t) = 𝑋𝑡│X(0) = X0, X(1) = 𝑋1, … , X(t − 1) = 𝑋𝑡−1] = P[X(t) = 𝑋𝑡│X(t − 1) = 𝑋𝑡−1 In the relation (10), p is conditional probability and it states that the result of each process in the time t only depends on the conditions in the time t-1. Processes which have this property are named the first order Markov chain or simple Markov chain [14].
A simple Markov chain is defined by using probability matrix (t). This matrix is a square matrix with pij(t) elements and is stated as:
𝑷𝒊𝒋(𝒕) = 𝑷[𝑿(𝒕) = 𝒋│𝐗(𝐭 − 𝟏) = 𝐢]𝑷[𝑿(𝒕−𝟏)=𝒊,𝑿(𝒕)=𝒋]
𝑷[𝑿(𝒕−𝟏)=𝒊] (11)
This chain may be changed from state i in t-1 to the state J=1 , 2, …,r in the time t for all pairs of , so, ir ,…p i2 , p i1 in the time t are shown by p i and j. so, corresponding transition probabilities
(t) = 1 i= 1,2,…,r
ij
∑𝒓𝒋=𝟏𝑷
If transition matrix p(t) doesn’t depend on time, Markov chain is called static or homogenous and we can use the p signs, pij instead of p(t) pij(t) in this case. Transition probability matrix is written as:
Main diagonal elements of matrix show stability of each status. As supposed the present chain is in the status i and is set in the state j after time phase n, the probability of transiting from state i to the state j in n phase is shown with 𝑃𝑖𝑗(𝑛)and is stated as:
(12) 𝑷𝐢𝐣(𝐧) = ∑𝒓𝒌=𝟏𝑷𝒌(𝒏−𝟏)
𝒏 > 1
i,j=1,…,r
kj
P
If n=1 then 𝑃𝑖𝑗(1)= 𝑃𝑖𝑗 is the same elements of transition probability matrix. In the relation (6) 𝑃ij(n) are n phase elements of transition probability matrix that can be obtained by multiplying n times of transition probability matrix p in itself. [5]
5-2 The method of research
8
In this study, using software Drink, which is designed for immediate monitoring and forecasting of drought, sensitivity to drought index SPI was calculated on a scale of 1, 3, 6, 9, 12, 18 and 24 months. Considering the rainfall situation of Saravan, drought in the region is categorized into five categories: extremely dry, moderately dry, slightly dry (almost normal), slightly wet (almost normal), and moderately wet. Using SPI index and Markov chain, drought monitoring and forecasting were done in the long term. For Markov chain analysis, we assume that the occurrence of one of the kinds of drought in one year just depends on what type of drought occurred in the previous year.
Based on the above information, a 5 × 5 matrix called the transition probability matrix is formed each of whose elements is related to the probability of transition from one state to another. For example, the matrix elements of the first row from left to right show the probability of drought changing from extremely dry to one of the modes of extremely dry, moderately dry, slightly dry (almost normal), slightly wet (almost normal), and moderately wet.
Table 2 shows Markov chain transition probability matrix for the annual precipitation amounts at Saravan station obtained through objective and specific enumeration investigation of corresponding states.
Table 2 Markov chain transition probability matrix for different draught situations in Saravan
P = [ 0 0 0.1053 0.091 0 0.3300 0 0.1053 0.1818 0 0.6700 0.8000 0.4210 0.5454 1 0 0.2000 0.3158 0.1818 0 0 0 0.0526 0 0 ]
To calculate the probabilities of drought in a steady state (long-term), we multiply transition probability matrix p by the elements of a hypothetical vector assume it equal to the hypothetical vector. After the transition probability matrix is multiplied n times by itself, it is fixed. In this case, the elements of each row are the elements of fixed vector. Transition probability matrix of different drought situations of Saravan was stabilized when it was multiplied 8 times by itself. The results are provided in table 3:
Table 3: probabilities of different drought situation in Saravan in the long run by using Markov chain Drought type Extremely dry Moderately dry Slightly dry Slightly wet Moderately wet probability 0.0777 0.1247 0.5333 0.2363 0.0280
Based on the table, it can be concluded that in the ong-term. The probability of drought is 20.24% and the probability of wet years is 2.80%. In other times, in 79.96% of time, the conditions are almost normal(slightly dry and slightly wet).
5-3 Analysis of drought in Saravan
9
Table 4: different possibilities of drought in Saravan city in the period 1986 to 2014
Drought type Extremely
dry Moderately
dry Slightly dry
Slightly wet Moderately
wet
probability 0.0769
0.1282 0.5128
0.2564 0.0257
By comparing the results presented in Table 3 and the results predicted by Markov chain model in Table 4, we can see clearly that the probabilities of drought in various drought types are not much different from the percentage of long-term drought conditions in the period of 1355 -1393. Since Markov chain model is a model in which the current state is dependent on the previous states, and considering the repeated dry and wet states during a 93-year statistic period, it seems the model has good accuracy and precision.
In addition, by comparing the results it can be seen that in the long run, dry years (years with a negative SPI) have increased and wet years (the year with a positive SPI) have decreased. This means that droughts will continue in the city of Saravan, in the long run. Also according to the values of the standardized precipitation index SPI in the period of 1986-2014, the most severe drought happened in 2000 by a factor of SPI of -3.28, while the most severe wet year was 1998 by a factor of SPI of 1.06. Although the Markov chain model predicts, on average, the probability of balance of normal period (76.96 percent) is higher than other situations, the fact that the probability of dry period is seven times bigger than wet period in long run reveals the fact that in Saravan, dry period is the second most frequent phenomenon after normal situation in the long run.
Conclusion
In this study, using drought index SPI, drought conditions of Saravan were investigated. Then, using the first order Markov chain, drought was anticipated. The results showed that the probability of balance in wet, dry, and normal periods in Saravan station is 80.2, 24.20, and 96.76 respectively. This means that the area is most of the time in normal conditions and the probability of draught is about 7 times bigger than wet conditions. It can be concluded that arid conditions will continue in the area. Given that currently Saravan city is facing a severe shortage of water resources, it is essential to study, identify, and predict such droughts to prevent the damages.
Resources
[1] Adl, 1991. The application of Markov chain model in studying water supply probabilities
from Amirkabir lake “scientific and technical publication of water. Number 9. Pages 1-7
[2] Alizade A. and Ashgar Toosi SH. Development of a model for monitoring and predicting
drought in Sistan Baluchistan, Geography magazine and regional development, number 15
[3] Alizadeh A., Ansary H., Ershady S., and Ashgar Sh., 1387. Monitoring and predicting drought
in Sistan and Balochistan. Geography and regional development journal, fifteenth issue.
[4] Azzam S. A. and Nielsen M. 1990. Markov Chain as shortcut method to stimate age
distributions in herds of beff cattle. Journal of Animal science, No.68, pp .5-14.
[5] Banik P. Mandal A. and Rahman M.S. 2000. Markov Chain analysis of weekly rainfall data
in determining drought proneness. Discrete dynamics in nature and society,vol. 7,pp 231-239.
[6] Byun, H.R. and Wilhite, D.A. 1996. Daily quantification of drought severity and duration.
10
[7] Clarke R. and Kara’s M. 1989. Analytical relationship between rainfall and runoff. Third
IHAS Assembly, Baltimore, No.181,pp187-193.
[8] Gibbs, W.J. and Maher, 1967. Rainfall Deciles as drought Indicators. Bureau of Meteorology
bulletin No.48. Commonwealth of Australia:Melbourn, 29.
[9] Jafari Behi KH. 1996. Statistical analysis of wet and arid rainfall in several continental
samples of Iran by using Markov chain, M.A thesis, instructing by Hojam, Sohrab. Tehran University.
[10] Maidment D.R. 1993 . Handbook of Hydrology. Chapter 19 in: Analysis and Modeling of
Hydrologic Time Series.salas J.D. Engineering Research Center Colorado state University, Fort Collins, Colorado, pp:19.1-19.39 .
[11] Mckee T. B. Doesken N. J. and Kleist I.1993. the Relationship of drought frequency and
duration to time scales. Preprints, 8th conference on Applied Climatology:179-184.
[12] Palmer, W.C., 1965. Meterorological Drought. Research Paper No. 45. U.S. Department of
Commerce Weather Bureau, Washington, DC.
[13] Razee t. Danesh Araste p. Akhtari R.V Saghafiyan b. 2008. The study of meteorological
droughts (continental) in Sistan Baluchistan state by using SPI index and Markov chain. Researches of Iran water resources 35-25: (1)3
[14] Thompson S. A. 1999. Hydrology for water management, Balkema, Rotterdam
Netherlands,pp 362.
[15] Tsakiris, G. and Vangelis, H. 2005.Establishing a drought index incorporating