James Banks Institute for Fiscal Studies and University College London
María Casanova Institute for Fiscal Studies and University College London
Amongst other things, the analysis presented in this chapter shows:
• Less than three-quarters of 55- to 59-year-old men and less than half of 60- to 64-year-old men are currently working. For women, these numbers are around 60% and 30% respectively; many working women are working part-time.
• Looking at individuals below the state pension age, there is a strong positive correlation between economic activity and health, whether health is self-reported or measured by mobility limitations.
• Concentrating just on workers, there are only relatively minor differences in hours worked and job types by health status. Similarly, there are only minor differences by health status in expectations of remaining in work.
• Looking across wealth groups, labour market inactivity rates for individuals younger than state pension age are U-shaped – the lowest wealth groups are least likely to be working, but the wealthiest individuals are also less likely to work than those in the middle of the wealth distribution.
• Single men are substantially less likely to be economically active than their married counterparts. The differences are much smaller for single and married women.
• The association of private pensions with ‘early retirement’ is stronger for defined benefit than for defined contribution pensions. This is true both for those who have already retired and for the retirement expectations of those who are still working.
• Expectations of returning to work, for those out of the labour market before the state pension age, are relatively pessimistic. Those in poor health, in particular, report low expectations of returning to work.
to work longer raises a host of complex questions about retirement possibilities and retirement choices. Important dimensions of this problem will include: health, physical functioning and the nature of work; the interaction of choices between individuals within couples; the financial incentives implicit in private pension arrangements, state pensions and state benefits; the adequacy or otherwise of wealth, which could be used to finance an extended retirement; social participation and leisure possibilities.
All these factors will vary across cohorts, and across individuals within cohorts, and, given the key importance of the retirement decision to the debate on ageing, measurements in these dimensions have therefore been one of the main aims of the ELSA questionnaire design. The degree to which we can provide the critical evidence on these issues is currently limited by the cross-sectional nature of the data collected so far. In due course, when longitudinal information is available on ELSA sample members, it will be possible to analyse in detail the causes and consequences of movements from work into retirement. At this point, we simply provide cross-sectional evidence on the current status of the older population in England and note that outcomes for older age groups are not necessarily predictive of what will happen to the younger groups, since observed differences across age groups are a combination of age and cohort effects. Nevertheless, much of the evidence provided here is the first available evidence of its type in England.
A full breakdown of many of the relevant dimensions of work, inactivity and retirement in the ELSA sample is provided in the tables in the Annex to this chapter. The text that follows refers briefly to some of those tables, but focuses mainly on a number of key findings that illustrate potentially important variation in circumstances and outcomes in the older population.
4.1 Employment and economic activity
As is becoming increasingly well known, many individuals have ceased economic activity by the time they reach the state pension age (SPA), currently 65 for men and 60 for women.1 This is true for both men and women whether economic inactivity is measured by self-reported employment status (Table 4A.1) or by actual recorded economic activity in the preceding month (Table 4A.2). The prevalence of self-reported retirement amongst women is lower than that for men, primarily as a result of a relatively large fraction choosing to report their status as ‘looking after home or family’, included in the ‘other’ category in Table 4A.1.
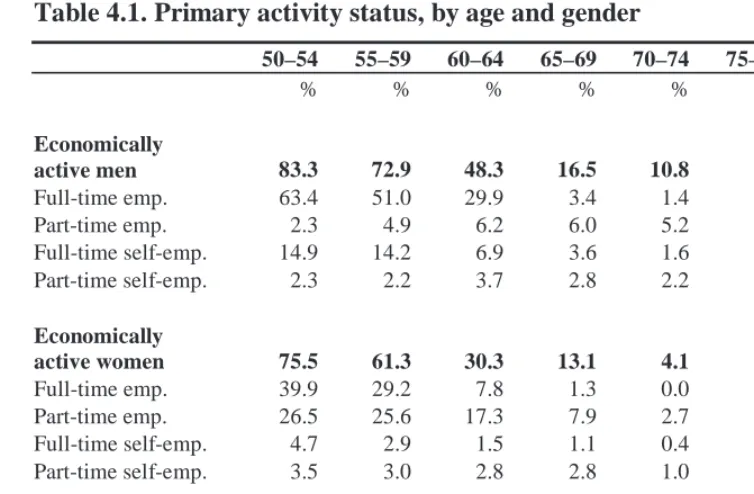
The ELSA questionnaire is designed to allow individuals to self-report their economic status separately from any questions that are asked on economic activities carried out, such as full- or part-time employment or self-employment. In addition, individuals can report multiple activities over the last month. As a result, neither Table 4A.1 nor Table 4A.2 gives a single summary of individuals’ primary economic position with regard to the labour market. Table 4.1 therefore reports individuals’ primary economic activity in
1
the last month. Less than three-quarters of men aged 55–59 did any economic activity in the month prior to the ELSA interview, and this fraction falls to less than one-half for the group aged 60–64. For women, these fractions are 61% and 30% respectively.2
Table 4.1. Primary activity status, by age and gender
50–54 55–59 60–64 65–69 70–74 75–79 80+
% % % % % % %
Economically
active men 83.3 72.9 48.3 16.5 10.8 5.1 1.1
Full-time emp. 63.4 51.0 29.9 3.4 1.4 0.0 0.0
Part-time emp. 2.3 4.9 6.2 6.0 5.2 1.5 0.4
Full-time self-emp. 14.9 14.2 6.9 3.6 1.6 2.0 0.0
Part-time self-emp. 2.3 2.2 3.7 2.8 2.2 1.4 0.7
Economically
active women 75.5 61.3 30.3 13.1 4.1 1.6 0.4
Full-time emp. 39.9 29.2 7.8 1.3 0.0 0.0 0.0
Part-time emp. 26.5 25.6 17.3 7.9 2.7 0.3 0.3
Full-time self-emp. 4.7 2.9 1.5 1.1 0.4 0.3 0.1
Part-time self-emp. 3.5 3.0 2.8 2.8 1.0 0.9 0.0
Sample size:
Men 887 1008 796 794 663 493 470
Women 1081 1157 873 901 789 585 737
Notes: Full-time is defined as individuals reporting normal hours of 30 or more per week. Numbers in bold may not be the sum of the four activity categories due to observations in the former category with missing hours information or those temporarily away from work.
What Table 4.1 also reveals, however, is that the distribution of types of economic activity within the active groups varies substantially by gender and also by age. Specifically, the proportion of the economically active in part-time work before the SPA is hugely higher for women than for men. For both men and women, older groups show considerably higher fractions of part-time work.
Such low rates of labour market participation amongst those below the SPA are an issue of some policy relevance. The remainder of the sections in this chapter discuss the evidence relating to how participation rates, typically defined according to current economic activity status as opposed to self-reported labour market status, are related to health, economic resources, the nature of work and pension arrangements. We also go on to look at how individuals expect their labour market activities to evolve in the future,
2These proportions compare well to evidence from other surveys. Disney and Hawkes (2003)
focusing on differences between those currently active and those currently inactive.
4.2 Economic activity and health
Two summary measures of health will be used to explore the relationship between health and activity status. These correspond to different dimensions of general health – self-reported status and limitations in activities of daily living (ADLs) – which might, in theory, be associated differently with an individual’s economic activity state. Nevertheless, these two summary measures represent only a small fraction of the possible relationships that can be explored in the ELSA data. Our interest here is simply in providing broad gradients relating health to economic activity. Needless to say, such gradients cannot and should not be interpreted causally.
Figure 4.1. Percentage economically active, by age, gender and self-reported health
0 20 40 60 80 100
m 50-54 m 55-59 m 60-64 m 65+ f 50-54 f 55-59 f 60-64 f 65+
all excellent/very good/good fair/poor
Tables 4A.3 to 4A.6 show that both self-reported employment status and labour market participation rates are lower for individuals in poorer health.3 This is the case for all age groups independently of the health measure considered. The association of low activity rates with lower health status is particularly evident when individuals are classified according to their self-reported health status. As can be seen in Figure 4.1, men before the SPA who report being in excellent, very good or good health are between 35 and 40 percentage points more likely to be active than those who are in fair or poor health. Women who have not reached the SPA are between 30 and 40 percentage points less likely to be active if they are in fair or poor health than if their health is very good or excellent. When economic activity is measured
3This is consistent with findings from the British Retirement Survey for previous cohorts of
by self-reported activity status (Table 4A.3), there is also a lower percentage of people describing themselves as employed or self-employed amongst lower health status groups.
Whether or not individuals have any mobility limitation is also a good predictor of activity status. Table 4A.6 shows that the probability of having been economically active in the preceding month is considerably lower for both men and women reporting difficulties with one or more limitation.4
For active individuals, there is not a clear association between health and work hours. Tables 4A.7 and 4A.8 show no evidence of a decreasing pattern – consistent across health measures and age groups – in the number of hours worked by active men amongst lower health status groups. In the case of women, those in poorer health and below the SPA seem to be less likely to work full-time, but the differences between them and those in better health are small. The relationship between health and job type is not very strong, but Table 4A.9 shows that individuals in fair or poor health are, in most cases, less likely to have a sedentary job, and generally more likely to have a physical or heavy manual job.
The data suggest, therefore, that health is strongly associated with the labour market participation decisions and/or opportunities. Nevertheless, once we look only at those who are participating in the labour market, work hours seem to be independent of health, and the association between health and type of job is not particularly marked.
Self-reported health status is correlated with occupational class as measured by the SOC 2000 classification of occupational categories (SOC) (Table 4A.10). This could be due to occupations on the lower end of the SOC scale having a detrimental effect on health, but could also be the consequence of unobserved wealth effects – since SOC is correlated with wealth and there are strong links between health and wealth.
Table 4A.11 shows that people in physical or heavy manual jobs generally report higher expectations of their health limiting their ability to work before they reach 65.5 This may be taken as an indication of the higher demands on health inherent in physical and heavy manual work, although, once again, the lower chances of observing wealthy people in these types of jobs must also be taken into account when interpreting the results.
Understanding the implications of Tables 4A.10 and 4A.11 requires a multivariate analysis. As more waves become available, the information contained in the ELSA data will allow for the relationships among the different variables to be considered at the same time.
4For more details on the measurement of mobility limitation, see Chapter 7.
5These expectations are collected using the ‘percentage chance’ methodology described
4.3 Economic inactivity and wealth
Previous sections have discussed the correlation between economic activity, both employment and self-employment, by age, gender and health. We now move on to look at correlations with levels of wealth. Rather than focus simply on whether an individual is in paid work or not, however, we begin to look more deeply at those who are not economically active and, in particular, focus on the distinction between those who are ‘retired’ and those who are not in paid employment but not yet retired (according to their own self-reported assessment of their labour market status).
Table 4A.12 shows that there are strong patterns in economic activity and inactivity rates by wealth. The table reports the proportion retired (self-reported definition) and the proportion inactive within each five-year age group and by wealth quintile within this five-year age group.6 Concentrating first on those who report themselves as retired (or semi-retired), Figure 4.2 takes the numbers for men from Table 4A.12 and shows that ‘early retirement’ is clearly associated with high wealth levels – the proportion retired amongst the highest wealth quintiles is strikingly higher than that amongst the lower wealth groups.
Figure 4.2. Percentage ‘retired’, by age and wealth quintile: men
0 20 40 60 80
50-54 55-59 60-64
poorest quintile 2 quintile 3 quintile 4 richest
Figure 4.3 shows that these patterns look remarkably different when we consider a broader measure of labour market inactivity. Inactivity rates are highest in the lowest wealth group, and overall demonstrate a U-shaped pattern by wealth. The lowest two wealth groups are likeliest to be inactive, but not retired. The highest two wealth groups are likeliest to be inactive and retired. It is those in the middle of the wealth distribution who are least likely to be economically inactive – that is, who are most likely to be in paid work.
6The wealth definition used to create wealth groups corresponds to the total non-pension
Figure 4.3. Percentage economically inactive, by age and wealth quintile: men
0 20 40 60 80
50-54 55-59 60-64
poorest quintile 2 quintile 3 quintile 4 richest
`
Table 4A.12 also shows that, by later ages, the association between retirement or inactivity and wealth flattens out considerably. Indeed, by the oldest ages, the pattern has reversed – although the proportions in paid work are almost negligibly small, those who are working are concentrated at either extreme of the wealth distribution. Members of the wealthiest group presumably do not need to remain active at these later ages for financial reasons, so such activity rates presumably reflect preferences for work, which in turn probably contribute to the high accumulated wealth levels. Table 4A.12 also demonstrates that these patterns, at both younger and older ages, are present for women as well as men, although the fraction self-reporting retired is lower on average, as discussed earlier.
These differences across wealth groups, particularly at younger ages, accord well with expectations, given the positive correlation between health and wealth and the negative correlation between health and work, both discussed previously. Full separation of the contributions of health and wealth, amongst other variables, in explaining labour market activity rates is clearly a priority for research as more waves of ELSA data become available.
4.4 Labour market outcomes within couples
Figure 4.4. Percentage economically active, by marital status, gender and age group 0 20 40 60 80 100 m 5 0 -5 4 f 5 0 -5 4 m 5 5 -5 9 f 55-59 m 6 0 -6 4 f 6 0 -6 4 m 6 5 -6 9 f 65-69 m 7 0 + f 7 0 + single married
A number of possible stories could explain this phenomenon, one of which is a selection effect as opposed to a labour supply effect – the average characteristics of older single men relative to married men may be different from those for women. The full explanation is likely to be more complicated, however. In reality, single men in their 50s are a heterogeneous group, with some not employed and in poor health, and some in full-time paid employment, and these composition effects may feed through into outcomes other than employment status. Indeed, Chapter 3 (Figure 3.2, for example) demonstrated that for income or wealth measures, the relativities of single men to their married counterparts are on a comparable scale to those for women.
Higher overall inactivity rates of single men who have not yet reached the SPA are accompanied by a higher probability of being unemployed or long-term sick or disabled, compared with married men (Table 4A.13). Other forms of economic inactivity – mainly retirement – have a similar prevalence among married and single men in these age groups. In the years after the SPA, these differences vanish, as the majority of men in both groups are retired.
Table 4A.13 also shows that married women below the SPA are slightly less likely to report themselves as retired than single women but that the differences widen in the years following the SPA, since a higher proportion of married women include themselves in the category ‘other’, mostly reporting themselves as ‘looking after home or family’, as discussed earlier.
or at least economic activity outcomes, should be studied jointly in future research.
4.5 Retirement
In this section, we consider the characteristics of individuals who self-report themselves as ‘retired’ or ‘semi-retired’, focusing on those below the SPA. In particular, we distinguish this group from the broader group, identified in previous sections, who are economically inactive. Throughout this section, it should be remembered that the early retired are only one subgroup of the older population who are not in paid work. As Figure 4.2 showed, they are typically a high-wealth subgroup.
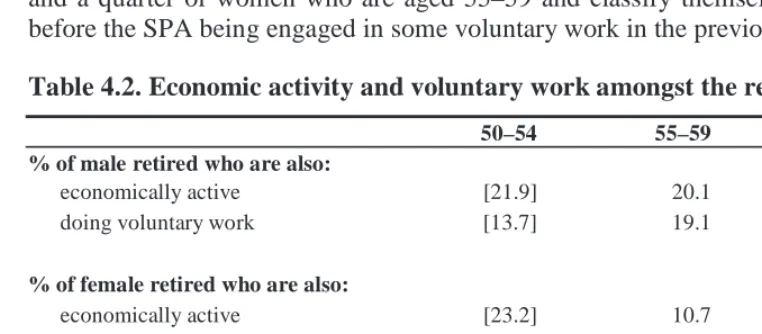
As discussed previously, the ELSA survey allows individuals to report their labour market status separately from their labour market activity and hence it is possible that not all those who consider themselves retired are inactive. Indeed, such a situation would be in accord with the idea that retirement has, for many, become a gradual process of withdrawal from the labour market, as opposed to a discrete switch from full-time work into complete labour market inactivity. Table 4.2 shows that, amongst those who say they are retired, a non-negligible fraction actually carried out some form of paid economic activity – either employment or self-employment – in the month previous to the interview. The same is true for voluntary work, with around a fifth of men and a quarter of women who are aged 55–59 and classify themselves retired before the SPA being engaged in some voluntary work in the previous month.
Table 4.2. Economic activity and voluntary work amongst the retired
50–54 55–59 60–64
% of male retired who are also:
economically active [21.9] 20.1 12.7
doing voluntary work [13.7] 19.1 16.7
% of female retired who are also:
economically active [23.2] 10.7 8.4
doing voluntary work [19.0] 25.0 18.9
Sample size:
Male 49 133 280
Female 38 137 494
For those who are retired and not economically active, the expectation of returning to work in the future is extremely low. Section 4.6, which looks at expectations of work in the future, shows, for example, that for 75% of retired inactive men aged 50–59 and 74% of retired inactive women aged 55–59, the reported chance of working after age 60 is zero (see Table 4.3).
other assets and wealth levels. In what follows, we go on to look in more detail at private pension arrangements and how they vary with labour market activity, both before and after the SPA.
Table 4A.16 shows current and lifetime private pension status by age, gender and labour market activity, and differentiates between defined contribution (DC) and defined benefit (DB) schemes.7 Individuals of all ages are more likely to have contributed to a DB scheme at some point in their lifetime than to a DC scheme. Looking at current contributions, however, men below the SPA are actually more likely to be currently contributing to a DC scheme than to a DB scheme. This could be a result of individuals making current contributions to a plan of which they have not been a member over their entire working life, or due to those with DB plans leaving the labour market before the SPA and hence discontinuing their contributions. The following analysis shows that each of these stories has a role to play in explaining the data.
As preliminary evidence of the importance of pensions in retirement decisions, Table 4A.17 shows that around a third of those with private pensions who retired before the normal retirement age (NRA) in their pension plan reported that they were offered reasonable financial terms to do so and that this was relevant to their retirement decision. The table also shows that many early retirements are not voluntary – with ill health and redundancy both high on the list of reasons for retirement for those retiring before either the SPA or the NRA in their private pension plan. Table 4A.17 also offers some preliminary evidence on joint retirement within couples. However, an asymmetry between men and women is apparent, with many more women than men reporting reasons relating to ‘joint’ retirement (i.e. ‘in order to retire at the same time as partner’, ‘ill health of a relative or friend’, ‘to spend more time with partner/family’).
Further evidence on the importance of pensions in retirement decisions is presented in Table 4A.18, where we look at the fraction of men and women within each five-year age band who report themselves as retired, and break the analysis down by whether or not individuals have a private pension and, if so, whether they have solely DB, solely DC or some other combination of private pensions. Figures 4.5, 4.6 and 4.7 present the key findings from this table. For both men and women, there is a positive association between retirement before the SPA and membership of a private pension. The differences are most marked in the 55-59 age group, where those with private pensions are twice as likely to be retired as those without.
It is worth noting here that, when looking at private pension membership defined over an individual’s entire working life, there are relatively few who have no private pension rights at all, particularly amongst men. Those without private pension rights are typically poorer and are in fact considerably more likely than those with private pensions to be economically inactive.
7A defined contribution pension scheme is one where money is invested in a fund and the size
Figure 4.5. Percentage retired, by age and private pension status: men
0 20 40
50-54 55-59 60-64 all 50-64
No Private Pension Private Pension
Figure 4.6. Percentage retired, by age and private pension status: women
0 20 40 60
50-54 55-59 60-64 all 50-64
No Private Pension Private Pension
Figure 4.7. Percentage retired, by age and private pension type: men with private pensions
0 20 40 60
50-54 55-59 60-64 all 50-64
Defined Benefit Defined Contribution Other
Note: ‘Other’ category includes those who have contributed to both types of pension over their working life and those who have a private pension but do not know whether their pension is DB or DC.
4.6 Expectations of work and retirement
The retirement behaviour of older cohorts is not necessarily a good predictor of the retirement patterns that will be observed when younger generations reach retirement age. Due to differences in life expectancy, work and pension contribution histories, private saving profiles, flexibility in the choice of retirement age or just the economic or policy environment they face, there is no reason to expect current workers’ outcomes to be similar to those of their predecessors.
The answers to ELSA questions on individual expectations for the future may provide a more accurate predictor of future behaviour. The use of numerical questions to elicit an individual’s expectations of various events or circumstances occurring at some point in the future represents one of the most innovative aspects of the ELSA questionnaire. In due course, since the same respondents are repeatedly observed, we will be able to see how accurate these expectations turn out to be. At present, however, we can use the expectations data to bring together the themes of the previous sections and look at the way a younger respondent’s expectations of leaving work, or remaining in work, vary by the themes identified above: health, type of job, and current and past pension arrangements.
The first set of columns in Table 4A.19 show the subjective probabilities of being in paid work after age 60, by self-reported health status, for male respondents who are currently economically active and aged 50–59. The average probability across all health groups is around 66%, implying that more than 30% of current male workers expect to be inactive at least five years before they reach the SPA. The average probability of working after age 65 for men aged 60–64 is 47%. So, in addition to the fact that, as shown earlier, a substantial fraction of men aged 55–64 are already out of the labour market, a significant further fraction are also intending or expecting to leave early.
For both age groups, the probability of being in paid work in the future is lower for individuals in fair or poor health (Figure 4.8), although the differences across health categories are very small. This accords with the finding in Section 4.2 that, conditional on labour market participation, health does not have a strong effect on work hours or job type.
Figure 4.8. Expectations of being in paid employment at 60/65/55/60, by health, gender and age group: economically active individuals
0 20 40 60 80 100
men 50 to 59 men 60 to 64 women 50 to 54 women 55 to 59
all excellent/very good/good fair/poor
Note: Men below age 60 are asked the chances of their being in paid employment at or after age 60; those between ages 60 and 64 are asked the same question with reference to age 65. Women below age 55 are asked the chances of their being in paid employment at or after age 55; those between ages 55 and 59 are asked the same question with reference to age 60.
The proportion of active women aged 50–54 who expect to be inactive before 55 is close to 20% (Table 4A.19). The average probability that women aged 55–59 will still be active after the SPA is around 52%, slightly higher than the corresponding one for men (47%), although for this cohort the SPA is still different for men and women. Figure 4.8 shows again that those in poorer health are less likely to expect to remain in work but these differences are almost negligible for most groups.
early, as shown in Figure 4.9. This is consistent with the evidence in Section 4.5, where the proportion of individuals with a DB pension who are retired was found to be much higher than that of individuals with a DC pension.
Figure 4.9. Percentage reporting ‘low’ chances of paid employment after age 60, by private pension type: economically active men aged 50–59
0 10 20 30 40
None Other Defined
Contribution
Defined Benefit
Notes: ‘Low’ chance of working defined as subjective probability less than 40%. ‘Other’ category includes those who have contributed to both types of pension over their working life and those who have a private pension but do not know whether their pension is DB or DC.
The category ‘other’ in Table 4A.21 includes individuals who have contributed to both DB and DC pensions and also those who do not know the type of private pension they are contributing to or have ever contributed to. Figure 4.9 shows that the subjective probability of early retirement for men aged 50–59 in this category is very similar to that for men in the DC category. Again, there could be a variety of potential explanations, but one contributing factor is that 70% of this category comprises men who are currently contributing to a DC pension, having contributed to a DB plan in the past. To the extent that there are retirement incentives inherent in DB plans, these will typically not affect those who were members of the DB plan at some point earlier in their work history.
Table 4.3. Expected chances of returning to paid employment for economically inactive individuals below SPA
Sample size
Fraction reporting zero chance of working in future
Average percentage chance of returning to work
% %
Men, 50–59
All inactive 409 64.5 14.8
Inactive and retired 141 74.5 8.9
Men, 60–64
All inactive 404 82.9 5.5
Inactive and retired 240 83.5 5.0
Women, 50–54
All inactive 270 63.8 14.5
Inactive and retired 29 – –
Women, 55–59
All inactive 440 74.2 8.7
Inactive and retired 122 73.9 8.2
Note: See Note to Figure 4.8.
Figure 4.10. Expectations of being in paid employment at 60/65/55/60, by health, gender and age group: all economically inactive individuals
0 5 10 15 20 25
men 50 to 59 men 60 to 64 women 50 to 54 women 55 to 59
all excellent/very good/good fair/poor
4.7 Conclusions
The economic activity of older individuals, and particularly those aged 50–64, is a key policy issue. The analysis here has shown important differences between ‘retirement’ and other forms of labour market inactivity, and systematic patterns in both measures when the population is analysed by gender, health, wealth, marital status or pension status. The key to providing further evidence for the policy debate is to disentangle these various relationships to establish the effects, other things being equal, of variation in any one dimension. Over the longer term, as future waves of data on the same sample of individuals become available, this is precisely what the ELSA data have been designed to do.
By using repeated observations on the same individuals and households, future analysis will be able to compare the labour market outcomes that result from changes in health or wealth, for example, or compare an individual’s expectations of future work patterns with what actually transpires as their retirement evolves. In addition, the detailed measurement of health and functioning and pension status in particular, much of which has not been exploited in the analysis above, will provide the opportunity for a much more precise understanding of individual circumstances and how work and retirement experiences differ within the population.
References
Banks, J., Blundell, R., Disney, R. and Emmerson, C. (2002), Retirement, Pensions and the Adequacy of Saving: A Guide to the Debate, Briefing Note 29, London: Institute for Fiscal Studies (www.ifs.org.uk/pensions/bn29.pdf).
Disney, R. and Hawkes, D. (2003), ‘Why has employment recently risen among older workers in Britain?’, in R. Dickens, P. Gregg and J. Wadsworth (eds), The Labour Market under New Labour: The State of Working Britain II, Basingstoke: Palgrave.