Article
1
A mechatronic platform for computer aided detection
2
of nodules in anatomopathological analyses via
3
stiffness and ultrasound measurements
4
Luca Massari1, Andrea Bulletti2*, Sahana Prasanna1*, Marina Mazzoni2,3, Francesco Frosini4, Elena
5
Vicari1, Marcello Pantano1, Fabio Staderini4, Gastone Ciuti1, Fabio Cianchi4, Luca Messerini4,
6
Lorenzo Capineri2, Arianna Menciassi1, Calogero Maria Oddo1.
7
8
1 Sant’Anna School of Advanced Studies, The BioRobotics Institute, 56025 Pisa, Italy;
9
[email protected] (L.M.); [email protected] (S.P.); [email protected]
10
(E.V.); [email protected] (M.P); [email protected] (G.C.);
11
[email protected] (A.M.); [email protected] (C.M.O.).
12
2 Department of Information Engineering, Università degli studi di Firenze, 50121 Florence, Italy;
13
[email protected] (A.B; [email protected] (L.C.).
14
3 Consiglio Nazionale delle Ricerche of Italy, Istituto di Fisica Applicata “Nello Carrara”, 50121 Florence,
15
Italy; [email protected] (M.M.).
16
4 Azienda Ospedaliera Careggi University Hospital of Florence and University of Florence;
17
[email protected] (F.F.); [email protected] (F.S); [email protected] (F.C.);
18
[email protected] (L.Me.).
19
20
*These authors share second authorship based on equal contribution
21
**Correspondence: [email protected]; [email protected].
22
23
Abstract: This study presents a platform for ex-vivo detection of cancer nodules, addressing
24
automation of medical diagnoses in surgery and associated histological analyses. The proposed
25
approach takes advantage of the property of cancer to alter the mechanical and acoustical properties
26
of tissues, because of changes in stiffness and density. A force sensor and an ultrasound probe were
27
combined to detect such alterations during force-regulated indentations. To explore the specimens,
28
regardless of their orientation and shape, a scanned area of the test sample was defined using shape
29
recognition applying optical background subtraction to the images captured by a camera. The
30
motorized platform was validated using seven phantom tissues, simulating the mechanical and
31
acoustical properties of ex-vivo diseased tissues, including stiffer nodules that can be encountered
32
in pathological conditions during histological analyses. Results demonstrated the platform’s ability
33
to automatically explore and identify the inclusions in the phantom. Overall, the system was able to
34
correctly identify up to 90.3% of the inclusions by means of stiffness in combination with ultrasound
35
measurements, paving pathway towards robotic palpation during intraoperative examinations.
36
Keywords: cancer nodules detection, phantom, stiffness analysis, ultrasound analysis, visual
37
analysis, automatic robotic platform, remote support for pathologists.
38
39
1. Introduction
40
Cancer is an abnormal and uncontrolled cell growth that invades healthy tissues, and that can
41
spread via metastases to other locations in the body [1]. Various cancer treatments involve chemical
42
and radiation therapies or surgery [2–4]. Following surgical intervention, biopsy is performed on the
43
lymph nodes excised from the tissue to properly characterize cancer spread and examine whether it
44
has developed the ability to spread to other lymph nodules or organs too. The accuracy in estimating
45
the amount of spread of cancer is extremely important to avoid complications caused by an extensive
46
2
resection of healthy lymph nodes and tissues. Accurate localization of tumors in tissues resected
47
during surgery can also allow the surgeon to decide and modify in itinere the planned intervention
48
so to remove malignant tissues missed in pre-operative imaging. Stiffness of human tissue is higher
49
for tumor nodules with respect to healthy tissues [5–10]. Hence, inspecting the mechanical properties
50
of cancerous tissues can contribute to the detection of nodules. Intraoperative palpations of the
51
resected malignant tissue provide essential information about the presence of abnormalities [11].
52
Indeed, such investigation is part of the general practice performed by a specialist through manual
53
palpation to retrieve several information about cancer nodules [12]. The reliable confidence of
54
medical practitioners to detect tumors is achieved with rigorous training before they reach proper
55
expertise in examining various organs and detecting abnormalities [13]. The human capability to
56
detect lumps in the tissues, however, degrades with increasing lump depth, decreased compliance of
57
the tissue, deformation of the finger pad induced by the lump itself, and the finger indentation
58
velocity [14,15]. Ultrasound analysis [16] can complement stiffness data because of the different
59
acoustic properties of cancer nodules, as demonstrated by intraoperative ultrasonography recordings
60
having reported influence (varying from 2.7% up to 73%) on the surgical procedures that were
61
preoperatively planned [17–20].
62
In this study, we combined stiffness and ultrasound data to aid the intraoperative histological exams
63
performed on tissues excised during surgery. Such an examination is crucial in case of misdiagnosis
64
or in case of unforeseeable diagnostic queries that might arise during surgery. Results from the
65
examination may be used as a guide for surgical resection and decision-making to modify the surgical
66
procedure (Figure 1)
67
68
69
Figure 1: Block diagram of the histological procedure. Grey: traditional manual procedure. Green:
semi-70
automatic procedure as modified by the introduction of the developed platform.
71
With instrumented tools, automatic classification of tumors in tissues can be addressed by machine
72
learning techniques: supervised-unsupervised classification, clustering and learnt neural networks
73
[21,22]. The proposed system aims at reproducing the activity of pathologists in intraoperative tumor
74
identification using feedback from vision, stiffness [23] and ultrasound measurements [24]. Using a
75
robotic platform, and machine learning techniques for classification, the focus of this work is to detect
76
and localize nodules buried in phantoms mimicking the elastic and ultrasound properties of excised
77
human tissues. Specifically, the experimental evaluation was carried out by means of Agar-based
78
Preprints (www.preprints.org) | NOT PEER-REVIEWED | Posted: 1 April 2019 doi:10.20944/preprints201904.0013.v1
phantoms suited to mimic liver, cardiac, brain and soft tissues [25–27], either in their acoustic and
79
mechanical properties and temperature dependency [28,29].
80
The paper is organized as follows. Section II describes the experimental setup, the technical
81
specifications of the used phantoms, the experimental protocol and data analysis methods. Results
82
are presented in section III, showing the results of stiffness and ultrasound data analyses both
83
separately and merging them together. The last section concludes with the discussion of the entire
84
work and presents potential future investigations.
85
2. Materials and Methods
86
2.1. Platform design
87
A platform was developed to detect embedded rigid inclusions surrounded by a soft matrix. The
88
automated system consists of the following components (Figure 2):
89
i) Three motorized translational stages and one rotational stage allowing to move the sample.
90
A commercial stage (8MTF-102LS05, STANDA, Vilnius, Lithuania) with 10 cm of travel
91
range and a resolution of 2.5 µm was used for the X and Y axes, while another translational
92
stage (8MVT120-25-4247) was used to indent the sample along the Z axis, having a travel
93
range of 2.5 cm and a resolution of 5 µm. Additionally, a fourth stage was mounted on the
94
mechatronic platform (8MR190-2-28) in order to enable the rotation of the sample. Such
95
stage had 360° rotation range with 0.01° resolution.
96
ii) An ultrasound probe (Sonomed, mod. 2014059, Warsaw, Poland), with 16 MHz central
97
frequency, a fractional bandwidth equal to 0.25 at -6 dB, used in pulse-echo mode. The
98
needle-type probe, 3 mm in diameter, was selected for directly contacting and indenting
99
the sample. A 30 Vpp pulsed excitation was delivered to the probe via a transmitter
(US-100
Key, Lecoeur-Electronique, Chuelles, France) connected to a PC via USB2. The
101
experimental setup was completed with the ultrasound data acquisition device, NI
102
FlexRIO (National Instruments Corp., Austin, TX, USA), for acquisitions at high frequency
103
(1.6 GHz).
104
iii) A load cell (Nano 43, ATI Industrial Automation, Apex, NC, USA) to collect interaction
105
forces, up to 18N with 0.004N resolution along normal axis, arising at the interface between
106
the ultrasound probe and the sample, also used in the control loop of the translation stages
107
in order to operate force-controlled indentations. The developed software used this force
108
data to calculate the stiffness and to trigger the high frequency US data collection at the
109
threshold point of contact (0.2 N).
110
iv) A waterproof HD-camera (Hero5 Session, GoPro, San Mateo, California, U.S.) with 10 MP
111
and 4K resolution, integrated to perform the sample shape recognition and to create a
112
matrix of points to be indented.
113
v) A stainless-steel disk fixed on the top of the motorized stages for the positioning of the
114
sample, but also to permit the reflection of the ultrasound signal back to the probe. The
115
disk had a diameter of 16 cm and a thickness of 1 cm.
116
The software routines for controlling the platform and the automatic scan of the samples and for
117
performing data acquisition, as well as the graphical user interfaces were developed in LabVIEW,
118
LabVIEW Real-Time and LabVIEW FPGA (National Instruments Corp., Austin, TX, USA), while the
119
data analyses were performed using MATLAB (The MathWorks, Inc., Natick, Massachusetts, United
120
4
122
Figure 2: A. Block diagram of the experimental setup. B. Experimental setup showing the different components.
123
2.2. Phantom of healthy tissue and inclusions
124
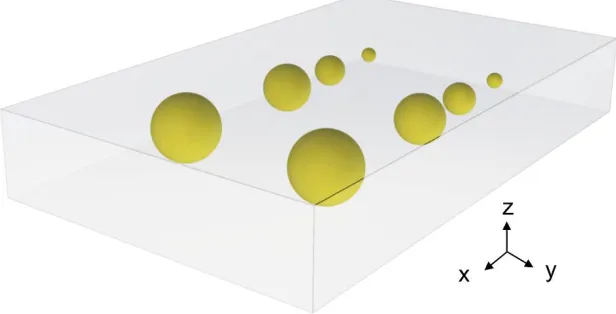
Tests were performed on seven Agar block-shaped phantoms, realized to mimic both the
125
mechanical and the acoustic properties of diseased human tissues. Each phantom had a soft
126
surrounding matrix representing the human healthy tissue and hard inclusions embedded inside to
127
represent tumor nodules. Each fabricated phantom was nominally 60 mm wide, 100 mm long and 15
128
mm thick, while the buried spherical inclusions had different diameters ranging from 3 mm to 12 mm.
129
The volume of the phantom was large enough to introduce up to 8 inclusions, 2 per each diameter, in
130
different X-Y positions with adequate separation distance (Figure 3) in order to execute computer-aided
131
detection trials.
132
133
134
Figure 3: Rendering of the Agar phantom used during the experimental acquisition. The spherical inclusions are
135
marked in yellow (∅ 12-9-6-3 mm). The volume of the phantom is 100x60x15 mm3.
136
Agar-based phantoms were prepared using a predefined concentration of Agar in distilled water.
137
Changing the concentration of Agar resulted in a variation of both the mechanical and acoustic
138
properties. A concentration of 2 g of Agar in 100 ml of water was used to represent a healthy human
139
tissue (fabricating a phantom entirely with this concentration results in 1.59 MRayl acoustic impedance,
140
1457 m/s speed of sound and 0.33 N/mm mechanical impedance). A concentration of 8 g of Agar in 100
141
ml of water was used for simulating a tumor tissue (fabricating a phantom entirely with this
142
concentration results in 1.92 MRayl acoustic impedance, 1534 m/s speed of sound and 4.6 N/mm
143
mechanical impedance).
144
145
146
Preprints (www.preprints.org) | NOT PEER-REVIEWED | Posted: 1 April 2019 doi:10.20944/preprints201904.0013.v1
2.3. Experimental protocol
147
The experimental protocol consisted in an automatic scan of the sample. The procedure was
148
divided in two steps:
149
i) visual analysis;
150
ii) stiffness and ultrasound analysis.
151
The purpose of the automatic visual analysis was to recognize the shape of the sample by acquiring its
152
boundaries and to create the indentation matrix, namely the points to be analyzed. Such analysis is
153
crucial when dealing with real tissues, where the shape and size is unknown or irregular, so that the
154
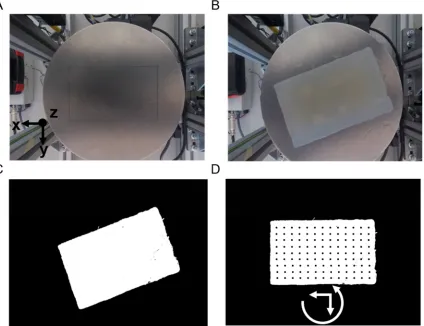
scan can be defined automatically. The visual part (Figure 4) consisted in subtracting the background
155
image from the sample image, thus obtaining the shape, the size and the orientation. Starting from this
156
new image (Figure 4C), a set of indentation points was created with a 2 mm step along the X-Y axes.
157
158
Figure 4: Visual part: positioning of the sample, boundary detection and creation of the indentation matrix. A.
159
Background. B. Sample in an arbitrary position. C. Background subtraction. D. Positioning by rotation of the
160
sample and creation of the indentation matrix.
161
Once the visual analysis was completed, it was possible to start the acquisition of the compression force
162
and ultrasound signals. Per each X-Y point of the indentation matrix, the phantom was indented along
163
the Z axis at constant speed (0.5 mm/s). The compression force was recorded and, at a low threshold
164
(0.2 N, to avoid damaging the phantom), a trigger signal was generated for ultrasonic pulse
165
6
167
Figure 5: A. Experimental protocol involving indentation of the ultrasound probe under regulation of the contact
168
force. B. Normal force. C. Z position. D. Ultrasound signal reflected from the steel metal plate. E. Detail of the
169
propagating ultrasonic pulse shown in panel D.
170
2.4. Data analysis
171
The detection and localization of the different inclusions was based on the elaboration of
172
indentation force (FZ), vertical position (Z) and ultrasound signals. The stiffness parameter k for each
173
indentation was calculated according to Equation (1).
174
175
k = (∆FZ) ⁄ ∆Z (1)
176
The ultrasound technique used for the detection of the inclusions was based on the reflectometric
177
method. In fact, we considered more reliable to work with the variation of the signal reflected from the
178
reference steel plate (which was interfaced with the bottom of the phantom) than considering the very
179
low-amplitude signal reflected from the inclusion (the reflection coefficient was less than 1%). The
180
ultrasonic analysis consisted in the processing of the signal detected in each point of the indentation
181
matrix using the Correlation Index Amplitude (CIA) parameter [30], which was defined in Equation (2)
182
as :
183
184
CIA = 1 -
∑ , ∑
∑ , ∑
(2)
185
In equation (2), Si and Sref denote the signal acquired in each point and the reference signal, respectively.
186
The reference signal was acquired in a position outside the region with inclusions but inside the
tissue-187
like matrix. The CIA assumed values between 0 and 1. A high CIA indicates the detection of an inclusion
188
since the two signals become poorly correlated. For each indented point, a colour map was created both
189
for stiffness and for correlation index amplitude. An unsupervised classifier, called Fuzzy C-mean
190
Preprints (www.preprints.org) | NOT PEER-REVIEWED | Posted: 1 April 2019 doi:10.20944/preprints201904.0013.v1
(FCM) clustering, was used to classify each indentation of the scan on the phantom. Such unsupervised
191
classification system, starting from the elaborated data, enabled the categorization of the point and the
192
subsequent organization into different clusters. In this way, it was possible to divide the data into two
193
classes: (a) tumor class, which were the sites classified as inclusions, and (b) healthy class, which were
194
the sites classified as non-inclusions. From the wrong classification prediction, we obtained the number
195
of false positive, i.e., soft matrix points classified as inclusions, and the false negative number, i.e.,
196
inclusions classified as soft matrix. Furthermore, new datasets were obtained and classified by merging
197
the stiffness and the ultrasound data using AND-OR logics. In the AND case, we considered tumor
198
only the points identified as inclusion in both the datasets simultaneously, thus we expected an increase
199
in the total number of false negatives. In the OR case, we considered tumour all the points classified as
200
inclusion in either the stiffness dataset or the ultrasound dataset, thus we expected an increase of the
201
number of false positives and reduced false negatives. The results of the OR logic are crucial to include
202
all of the cancerous tissues. Through a confusion matrix, the accuracy and the misclassification rate
203
were calculated for all the datasets and methods.
204
3. Results
205
All the experimental results presented in this section have been repeated over seven replicas of
206
the developed phantoms.
207
3.1. Results from stiffness measurements
208
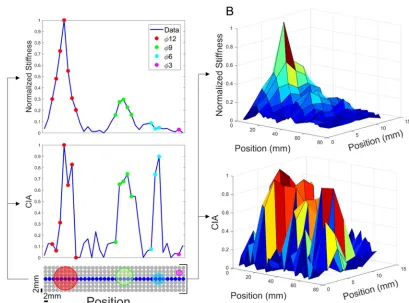
An elaboration example of the stiffness analysis, for one of the seven phantoms, is shown in the
209
top parts of Figure 6. The bottom part of Figure 6A shows the positions of the inclusions inside the
210
indentation matrix. Since the inclusions were embedded into a soft matrix, their stiffness was
211
depending not only on the materials properties, but also on the dimensions of the buried inclusions.
212
The stiffness values indeed increased with the dimension of the inclusions. Stiffness analysis was
213
clearly capable to detect the bigger inclusions, namely 12 mm and 9 mm. Figure 6B, showing the
214
results for the whole indentation matrix, confirmed this trend. A visual inspection of the image allows
215
8
217
Figure 6: A. (Top) Graph showing stiffness as a function of position, calculated as ΔFz/ΔZ, for the central row.
218
(Bottom) Graph showing ultrasound signal processing of CIA index. B. (Top) 3D graph showing stiffness across
219
the whole indentation matrix. (Bottom) 3D graph showing ultrasound signal processing of CIA index.
220
The results of the identification based on stiffness measurements are shown in Figure 7A, obtained
221
by the Fuzzy C-mean (FCM) clustering. The results of this unsupervised classification system
222
confirmed the ability of the stiffness measurement system to recognize all the points belonging to the
223
big inclusions, thus without false negatives. Such performances were evident from the high number
224
of true positive (green points) for 12 mm and 9 mm inclusions. However, stiffness analysis was not
225
able to reliably identify the smallest inclusions, as pointed out by the high number of false negatives
226
(red points) for 6 mm and 3 mm inclusions (Figure 7A).
227
228
Figure 7: Classification (TP-TN-FP-FN) of all the points of the indentation matrix for the analyses with stiffness
229
(A) and ultrasound (B) measurements.
230
3.2. Results from ultrasound measurements
231
According to the ultrasound data analysis, shown in Figure 6 (bottom part), we can observe in
232
Figure 6A, that the CIA index increases consistently in correspondence of the inclusions. But, unlike
233
Preprints (www.preprints.org) | NOT PEER-REVIEWED | Posted: 1 April 2019 doi:10.20944/preprints201904.0013.v1
the stiffness measurements, higher CIA values were observed also for the smaller inclusions. Thanks
234
to the high CIA peak recorded for each inclusion, this approach led to the detection of all the
235
inclusions buried in the phantom. Figure 6B, showing the results for the whole indentation matrix,
236
confirmed this trend. As for the stiffness measurement part, Figure 7B shows the results of the FCM
237
clustering, highlighting the ability of the ultrasound system to detect each inclusion. The trend is
238
visible in Figure 7B where true positives (in green) are present in each inclusion. Remarkably, false
239
positives (in yellow) and false negatives (in red) were obtained in the area at the boundary between
240
the inclusion and the soft matrix, confirming the high specificity in identifying the area to focus on
241
for histological analyses.
242
243
3.3. AND-OR logics to merge stiffness and ultrasound measurements
244
With the aim to improve the detection performance (true positives vs false negatives), new
245
datasets were obtained and classified by merging stiffness and ultrasound measurements using
246
AND-OR logics and the corresponding results are shown in Figure 8. The AND logics (Figure 8A)
247
turned out in an increase of false negatives and decrease of false positives. The growth of false
248
negative predictions can lead to the worst-case scenario, since might bring to a loss of identified
249
tumors. Instead, the OR logics demonstrated to be a safer approach since it turned out in an
250
acceptable increase of false positives and a consistent decrease of false negatives. As shown in Figure
251
8B, the OR logics between stiffness and ultrasound measurements was able to correctly discriminate
252
all the inclusions, even the smaller ones. Such results were achieved thanks to the complementarity
253
of the two systems. The stiffness analysis was better in localizing bigger inclusions, whereas the
254
ultrasound analysis was better for the detection of smaller inclusions (compare Figure 7A and Figure
255
7B).
256
257
Figure 8: Classification (TP-TN-FP-FN) for all the points of the indentation matrix following the AND-OR logics
258
of stiffness- and ultrasound-based classifications shown in Figure 7.
259
This behavior was further confirmed by the confusion matrices obtained with the seven
260
experimented phantoms and with all the identification techniques, i.e., based on just stiffness
261
10
263
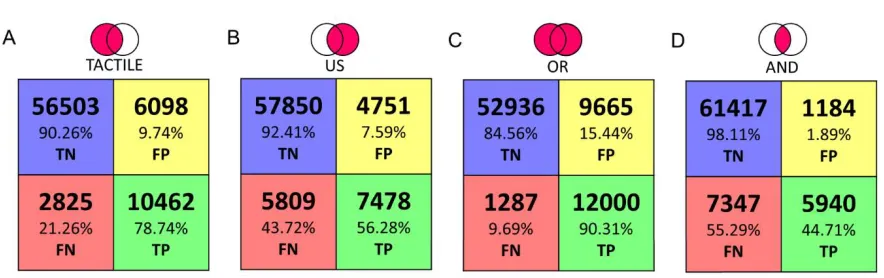
Figure 9: Confusion Matrix with classification based on A. Stiffness measurements. B. Ultrasound
264
measurements. C. Stiffness OR ultrasound measurements. D. Stiffness AND ultrasound measurements.
265
4. Discussion
266
In this work we present a platform aiming at identifying cancer nodules in ex-vivo tissues. Such
267
tool, oriented towards the automation of diagnostic procedures during surgery, has the scope of
268
increasing the effectiveness of histopathological evaluations. Such exams need to be performed as
269
correctly as possible because the report may lead in a modification of the surgical procedure. The
270
human capability to detect these lumps with characteristic dimension of few mm, depends on the
271
pathologist expertise and tactile capabilities. To achieve this goal, the presented platform combines
272
three different measurements, such as camera vision, stiffness calculations via force-position sensing
273
and ultrasound recordings to perform an automatic scan and evaluation of the indented tissue. In
274
this paper the tests were performed in a laboratory environment using seven Agar phantoms that
275
mimicked the mechanical and acoustic properties of human ex-vivo tissues. The phantoms integrated
276
eight spherical inclusions with different diameters (from 3 mm up to 12 mm) to reproduce tumors
277
inside healthy tissues. The results, for all phantoms, summarized in the confusion matrices,
278
demonstrated the ability of the platform to automatically identify the inclusions, particularly when
279
complementing stiffness with ultrasound measurements via OR logics. In particular, as reported in
280
the confusion matrix, the tactile analysis presents valuable classification results in detecting the
281
inclusions as reflected from the 78.73% of TP and 90.26% of TN. Moreover, it shows a low percentage
282
of FP and FN, 9.74% and 21.27%, respectively. We observe that the tactile analysis provides
283
satisfactory shape recognition and tumor detection for inclusions up to 6 mm in diameter. On the
284
other hand, it missed the smaller inclusions that were buried deeper into the softer matrix. The
285
ultrasound analysis can be a very good guiding tool for localization and detection of tumors,
286
including the smaller ones, because the ultrasound resolution is much higher than the size of the
287
inclusion and the difference in the acoustic impedance along z axis is sufficient to generate an
288
amplitude variation than can be detected from noise. The ultrasound data presents high amount of
289
TN of 92.41% and a low FP of 7.59%. However, the ultrasound alone shows a high number of FN of
290
43.72%. To improve the performance, the classified datasets were logically merged using the OR and
291
AND logic. As expected, the results of OR logic gave evidence of a higher rate of inclusions
292
recognition (i.e. 90.3% of TP and 84.56% TN), while maintaining low error rates (i.e. 9.68% FN and
293
15.44% FP). Interestingly, the AND logic localizes the bigger inclusions with an increased TN rate of
294
98.10%and reduced the FP rate to 1.90%, but the TP rate of 44.70% and FN rate of 55.30% missed the
295
correct shape and smaller tumors entirely.
296
In addition, we found that the ultrasound method was also sensitive to the presence of air bubbles
297
formed in the agar inclusions and modified the amplitude of the reflected signal from the bottom
298
interface. Tactile data, however, were not sensitive to these air bubbles inside the inclusions,
299
reproducing their shape a more faithfully in the OR logic. Within the present work, we adopted a
300
scan resolution with step of 2 mm inspired by the 16 MHz needle probe diameter (i.e. 3 mm). To keep
301
a balance between the scan speed and area, we decided to scan with step of 2 mm. Lesser resolution
302
values lead to insufficient data points in the scanned area, while higher values would introduce
303
unaffordable scan time and oversampling.
304
Preprints (www.preprints.org) | NOT PEER-REVIEWED | Posted: 1 April 2019 doi:10.20944/preprints201904.0013.v1
The phantoms we used were the simplistic versions of the biological tissues. Hence, further
305
developments will address the experimentation of the robotic platform on ex-vivo tissues. After this
306
validation step, we can envisage that the sensorized platform placed in the operating theatre, will
307
enable the pathologist to access data remotely with the purpose of assisting the surgeon in adapting
308
the procedures during surgery. Information obtained from the platform can also be used to provide
309
haptic feedback to the pathologist by means of wearable interfaces [31–34]. The analysis of vision
310
data, now used only for detecting the boundary of the tissue and thus to define the indentation
311
matrix, can be improved to provide a visual report too. Such a new procedure will target the
312
extraction of several features from the pictures of both healthy and tumorous tissues to learn their
313
differences via artificial intelligence methods and thus complement stiffness and ultrasound
314
measurements. Finally, the results will be translated in an electronic report and integrated with the
315
management software (e.g., HL7) of the healthcare system.
316
Author Contributions: L.M. developed the mechatronic platform, integrated the experimental setup,
co-317
designed the experimental protocol, performed the experimental protocol, analyzed the data, discussed the
318
results and edited the paper ; A.B. realized the phantom, co-designed the experimental protocol, performed the
319
experimental protocol, analyzed the data, discussed the results and edited the paper; S.P. realized the phantom,
320
co-designed the experimental protocol, performed the experimental protocol, analyzed the data, discussed the
321
results and edited the paper; M.M. realized the phantom, co-designed the experimental protocol, performed the
322
experimental protocol, discussed the results; F.F. handled the project administration, discussed the results and
323
revised the paper; V.M. realized the phantom and performed the experimental protocol; E.V. analyzed the data
324
and discussed the results; M.P developed the visual analysis and discussed the results; F.S., F.C., L.Me, provided
325
medical background, co-designed the experimental protocol, contributed to perform the experimental protocol
326
and revised the paper; G.C. co-supervised the development of the mechatronic platform, co-designed the
327
experimental protocol and revised the paper; L.C. and A.M. co-supervised the development of the mechatronic
328
platform, co-designed the experimental protocol, contributed to data analysis, discussed the results and revised
329
the paper; C.M.O. designed and supervised the study, supervised the development of the mechatronic platform,
330
co-designed the experimental protocol, contributed to data analysis, discussed the results and revised the paper.
331
Funding: This work was supported in part by the Tuscany Region within the FAS-Salute call, via the IMEROS
332
project (CUPD66D16000120002).
333
Acknowledgments: This paper is a result of a collaborative project involving different institutes and entities.
334
The authors thank all the collaborators for their valuable contributions.
335
Conflicts of Interest: The authors submitted a patent on the platform presented in the present study. The funders
336
had no role in the design of the study; in the collection, analyses, or interpretation for data; in the writing of the
337
manuscript, or in the decision to publish the results.
338
References
339
1. Pierangelo, A.; Benali, A.; Antonelli, M.-R.; Novikova, T.; Validire, P.; Gayet, B.; Martino, A. De Ex-vivo
340
characterization of human colon cancer by Mueller polarimetric imaging. Opt Express 2011, 19, 1582,
341
doi:10.1364/OE.19.001582.
342
2. Adam, R. Chemotherapy and surgery: new perspectives on the treatment of unresectable liver
343
metastases. Ann. Oncol. 2003, 14, ii13-ii16, doi:10.1093/annonc/mdg731.
344
3. Nagai, T.; Niikura, H.; Okamoto, S.; Nakabayashi, K.; Matoda, M.; Utsunomiya, H.; Nagase, S.;
345
Watanabe, M.; Takeshima, N.; Yaegashi, N. A new diagnostic method for rapid detection of lymph node
346
metastases using a one-step nucleic acid amplification (OSNA) assay in endometrial cancer. Ann. Surg.
347
Oncol. 2015, 22, 980–986, doi:10.1245/s10434-014-4038-2.
348
4. Candefjord, S.; Ramser, K.; Lindahl, O.A. Technologies for localization and diagnosis of prostate cancer.
349
J. Med. Eng. Technol. 2009, 33, 585–603, doi:10.3109/03091900903111966.
350
5. Krouskop, T.A.; Wheeler, T.M.; Kallel, F.; Garra, B.S.; Hall, T. Elastic moduli of breast and prostate
351
tissues under compression. Ultrason. Imaging 1998, 20, 260–274.
352
12
inversion-technique-based investigation of 169 samples. Phys. Med. Biol. 2007, 52, 1565.
354
7. Zhang, M.; Nigwekar, P.; Castaneda, B.; Hoyt, K.; Joseph, J. V; di Sant’Agnese, A.; Messing, E.M.; Strang,
355
J.G.; Rubens, D.J.; Parker, K.J. Quantitative characterization of viscoelastic properties of human prostate
356
correlated with histology. Ultrasound Med. Biol. 2008, 34, 1033–1042.
357
8. Raveh Tilleman, T.; Tilleman, M.M.; Neumann, H.A.M. The elastic properties of cancerous skin:
358
Poisson’s ratio and Young’s modulus. Optim. Incisions Cutan. Surg. Incl. Mohs’ Microgr. Surgery. 2004,
359
105.
360
9. Winstone, B.; Melhuish, C.; Pipe, T.; Callaway, M.; Dogramadzi, S. Toward Bio-Inspired Tactile Sensing
361
Capsule Endoscopy for Detection of Submucosal Tumors. IEEE Sens. J. 2017, 17, 848–857,
362
doi:10.1109/JSEN.2016.2627798.
363
10. Carter, F.J.; Frank, T.G.; Davies, P.J.; McLean, D.; Cuschieri, A. Measurements and modelling of the
364
compliance of human and porcine organs. Med. Image Anal. 2001, 5, 231–236,
doi:10.1016/S1361-365
8415(01)00048-2.
366
11. Konstantinova, J.; Li, M.; Mehra, G.; Dasgupta, P.; Althoefer, K.; Nanayakkara, T. Behavioral
367
characteristics of manual palpation to localize hard nodules in soft tissues. IEEE Trans. Biomed. Eng. 2014,
368
61, 1651–1659.
369
12. Wells, P.N.T.; Liang, H.-D. Medical ultrasound: imaging of soft tissue strain and elasticity. J. R. Soc.
370
Interface 2011, 8, 1521–1549.
371
13. Carson, W.C.; Gerling, G.J.; Krupski, T.L.; Kowalik, C.G.; Harper, J.C.; Moskaluk, C.A. Material
372
characterization of ex vivo prostate tissue via spherical indentation in the clinic. Med. Eng. Phys. 2011,
373
33, 302–309.
374
14. Gwilliam, J.C.; Yoshioka, T.; Okamura, A.M.; Hsiao, S.S. Neural coding of passive lump detection in
375
compliant artificial tissue. J. Neurophysiol. 2014, 112, 1131–1141.
376
15. Yau, J.M.; Kim, S.S.; Thakur, P.H.; Bensmaia, S.J. Feeling form: the neural basis of haptic shape
377
perception. J. Neurophysiol. 2015, 115, 631–642.
378
16. Nam, K.; Rosado-Mendez, I.M.; Wirtzfeld, L.A.; Pawlicki, A.D.; Kumar, V.; Madsen, E.L.; Ghoshal, G.;
379
Lavarello, R.J.; Oelze, M.L.; Bigelow, T.A. Ultrasonic attenuation and backscatter coefficient estimates of
380
rodent-tumor-mimicking structures: comparison of results among clinical scanners. Ultrason. Imaging
381
2011, 33, 233–250.
382
17. Hoch, G.; Croise-Laurent, V.; Germain, A.; Brunaud, L.; Bresler, L.; Ayav, A. Is intraoperative ultrasound
383
still useful for the detection of colorectal cancer liver metastases? HPB 2015, 17, 514–519.
384
18. Hata, S.; Imamura, H.; Aoki, T.; Hashimoto, T.; Akahane, M.; Hasegawa, K.; Bekku, Y.; Sugawara, Y.;
385
Makuuchi, M.; Kokudo, N. Value of visual inspection, bimanual palpation, and intraoperative
386
ultrasonography during hepatic resection for liver metastases of colorectal carcinoma. World J. Surg.
387
2011, 35, 2779–2787.
388
19. Ferrero, A.; Langella, S.; Giuliante, F.; Viganò, L.; Vellone, M.; Zimmitti, G.; Ardito, F.; Nuzzo, G.;
389
Capussotti, L. Intraoperative liver ultrasound still affects surgical strategy for patients with colorectal
390
metastases in the modern era. World J. Surg. 2013, 37, 2655–2663.
391
20. Chou, R.; Cuevas, C.; Fu, R.; Devine, B.; Wasson, N.; Ginsburg, A.; Zakher, B.; Pappas, M.; Graham, E.;
392
Sullivan, S.D. Imaging techniques for the diagnosis of hepatocellular carcinoma: a systematic review and
393
meta-analysis. Ann. Intern. Med. 2015, 162, 697–711.
394
21. Baker, A.R.; Windsor, C.G. The classification of defects from ultrasonic data using neural networks: The
395
Hopfield method. NDT Int. 1989, 22, 97–105.
396
Preprints (www.preprints.org) | NOT PEER-REVIEWED | Posted: 1 April 2019 doi:10.20944/preprints201904.0013.v1
22. Jain, A.K. Data clustering: 50 years beyond K-means. Pattern Recognit. Lett. 2010, 31, 651–666.
397
23. Ahn, B.-M.; Kim, J.; Ian, L.; Rha, K.-H.; Kim, H.-J. Mechanical property characterization of prostate cancer
398
using a minimally motorized indenter in an ex vivo indentation experiment. Urology 2010, 76, 1007–1011.
399
24. Barr, R.G.; Ferraioli, G.; Palmeri, M.L.; Goodman, Z.D.; Garcia-Tsao, G.; Rubin, J.; Garra, B.; Myers, R.P.;
400
Wilson, S.R.; Rubens, D. Elastography assessment of liver fibrosis: society of radiologists in ultrasound
401
consensus conference statement. Radiology 2015, 276, 845–861.
402
25. Li, W.; Belmont, B.; Greve, J.M.; Manders, A.B.; Downey, B.C.; Zhang, X.; Xu, Z.; Guo, D.; Shih, A.
403
Polyvinyl chloride as a multimodal tissue-mimicking material with tuned mechanical and medical
404
imaging properties. Med. Phys. 2016, 43, 5577–5592.
405
26. Culjat, M.O.; Goldenberg, D.; Tewari, P.; Singh, R.S. A review of tissue substitutes for ultrasound
406
imaging. Ultrasound Med. Biol. 2010, 36, 861–873.
407
27. Cafarelli, A.; Verbeni, A.; Poliziani, A.; Dario, P.; Menciassi, A.; Ricotti, L. Tuning acoustic and
408
mechanical properties of materials for ultrasound phantoms and smart substrates for cell cultures. Acta
409
Biomater. 2017, 49, 368–378.
410
28. Cao, R.; Huang, Z.; Varghese, T.; Nabi, G. Tissue mimicking materials for the detection of prostate cancer
411
using shear wave elastography: A validation study. Med. Phys. 2013, 40.
412
29. Manickam, K.; Machireddy, R.R.; Seshadri, S. Study of ultrasound stiffness imaging methods using
413
tissue mimicking phantoms. Ultrasonics 2014, 54, 621–631.
414
30. Bulletti, A.; Giannelli, P.; Calzolai, M.; Capineri, L. An integrated acousto/ultrasonic structural health
415
monitoring system for composite pressure vessels. IEEE Trans. Ultrason. Ferroelectr. Freq. Control 2016,
416
63, 864–873.
417
31. Sorgini, F.; Massari, L.; D’Abbraccio, J.; Palermo, E.; Menciassi, A.; Petrovic, P.B.; Mazzoni, A.; Carrozza,
418
M.C.; Newell, F.N.; Oddo, C.M. Neuromorphic vibrotactile stimulation of fingertips for encoding object
419
stiffness in telepresence sensory substitution and augmentation applications. Sensors (Switzerland) 2018,
420
18, doi:10.3390/s18010261.
421
32. Massari, L.; D’Abbraccio, J.; Baldini, L.; Sorgini, F.; Farulla, G.A.; Petrovic, P.; Palermo, E.; Oddo, C.M.
422
Neuromorphic haptic glove and platform with gestural control for tactile sensory feedback in medical
423
telepresence applications. In 2018 IEEE International Symposium on Medical Measurements and Applications
424
(MeMeA); IEEE, 2018; pp. 1–6.
425
33. Sorgini, F.; Mazzoni, A.; Massari, L.; Caliò, R.; Galassi, C.; Kukreja, S.L.; Sinibaldi, E.; Carrozza, M.C.;
426
Oddo, C.M. Encapsulation of piezoelectric transducers for sensory augmentation and substitution with
427
wearable haptic devices. Micromachines 2017, 8, 270.
428
34. D'Abbraccio, J.; Massari, L.; Prasanna, S.; Baldini, L.; Sorgini, F.; Airò Farulla, G.; Bulletti, A.; Mazzoni,
429
M.; Capineri, L.; Menciassi, A.; Petrovic, P.; Palermo, E.; Oddo, C.M. Haptic glove and platform with
430
gestural control for neuromorphic tactile sensory feedback in medical telepresence, Sensors 2019, 19(3),
431
641; doi: 10.3390/s19030641