Real
W
and
Z
bosons production at HERA
Takuya Nobe1,aon behalf of H1 and ZEUS Collaborations
1Department of Physics, Tokyo Institute of Technology, 152-8551 Japan
Abstract.The production of realWandZ bosons has been studied inepcollisions at HERA. A combined analysis is performed with the data taken with the H1 and ZEUS de-tectors corresponding to 0.98 fb−1of integrated luminosity to search for events containing an isolated electron or muon and missing transverse momentum, which is dominated by singleW production. The total singleWboson production cross section is measured as 1.06±0.16(stat.)±0.07(sys.) pb, in agreement with the Standard Model (SM) expec-tation of 1.26±0.19 pb. The production ofZ bosons has been studied in the reaction
ep →eZp(∗), wherep(∗)stands for a proton or a low-mass nucleon resonance, using a
data sample collected with the ZEUS detector amounting to 0.5 fb−1. TheZis measured in the hadronic decay mode. The cross section of the reactionep→eZp(∗)is measured
to be 0.13±0.06(stat.)±0.01(syst.) pb, in agreement with the SM prediction of 0.16 pb.
1 Introduction
The Standard Model (SM) of particle physics has been tested for a long time by many experiments, and good agreement with data has been reported. In particular, excellent agreement in electro-weak sector,
which is mediated byW andZ/γ(∗)bosons, has been found. An important motivation of the HERA1
physics program is to figure out the electro-weak interactions inep collisions in measurements of
deep-inelastic scattering (DIS). The cross sections of charged current (CC) and neutral current (NC)
DIS were measured precisely with the H1 and ZEUS detectors2at HERA [1–3]. The HERA
centre-of-mass energy of 318 GeV allowed measurement of them at high–Q2region up to 104GeV2, whereQ2is
the momentum transfer between the electron3and proton. In various experimental conditions, H1 and
ZEUS reported that measured cross sections agree well with the SM predictions in wholeQ2range.
These results proved the calculations of the virtual exchanges ofWandZbosons inepcollisions in a
wideQ2range. On the other hand, realW andZbosons can be produced only from lepton or quark
lines inepcollisions with the conservation ofL andB numbers. Therefore, the cross sections are
expected to be very small. Examples of the tree-level diagrams are shown in Fig. 1. Measurement of
theW andZbosons cross sections is important as a test of the SM. Another motivation is that these
ae-mail: nobe@hep.phys.titech.ac.jp
1HERA is the world’s onlyepcollider, operated by DESY during 1992 to 2007.
2H1 and ZEUS are general-purpose detectors at HERA, which consist of tracking systems surrounded by electro-magnetic
and hadronic calorimeters and muon detectors, covering approximately 4πsr in the solid angle. Thex–yplane is called the transverse plane andφis the azimuthal angle. The pseudo-rapidityηis defined asη=−ln tan (θ/2), whereθis the polar angle measured with respect to the proton beam direction (denoted as the forward direction).
3The term electron also refers to positrons if not stated otherwise.
DOI: 10.1051/
C
Owned by the authors, published by EDP Sciences, 2014
/2 01
epjconf 4 7100099
q
W+
ν q’
e+ e+
+
_
Figure 1.Examples of tree level diagrams ofW(left) [7] andZ(right) [5] boson production inepcollisions.
are background processes for some physics beyond the SM. This note reports on the results of theW
andZ bosons cross-section measurements inepcollisions at HERA. More details of both analyses
can be found in [4] and [5].
2
W
boson production measurement
2.1 Strategy of the analysis
Measurement of theWboson cross section has been performed in events with high transverse
momen-tum (pT) isolated lepton (electron or muon) and large missing transverse momentum,pmissT . Full data
samples available to both H1 and ZEUS corresponding to 0.98 fb−1of integrated luminosity are
ana-lyzed. This mode is interesting since existence of physics beyond the SM, e.g. anomalous triple gauge coupling and flavor changing neutral current single top production, may enhance events containing an
additional hadronic final state of high transverse momentum,pXT. Therefore, in addition to the total
singleWproduction cross section, the differential cross section as a function ofpXTis measured.
The EPVEC [6] Monte Carlo (MC) event generator is used to calculate the singleW production
cross section. The main reaction isep → eWX. Its cross section is calculated including quantum
chromodynamics correction at next–to–leading order and its uncertainty is 15%, which arises from the uncertainties in the parton densities and scale at which the calculation is performed. The contribution
of ep → νeWX events to the total singleW production cross section is approximately 7%. The
ep→eZ(→νν)Xprocess has similar event topology with the signal, but is negligible in this analysis
(<3% contribution). The total cross section of singleW production at HERA predicted by EPVEC is
1.26±0.19 pb.
The main background processes are NC DIS events (ep → eX) with mis-measured pmiss
T and
CC DIS events (ep → νeX) with fake isolated leptons. A contribution of lepton pair production
(ep → el+l−X) is considered, via events where one lepton escapes detection and/or measurement
errors cause apparent missing momentum. A small contribution to the background in the electron
channel arises from QED Compton events (ep → eγX) when mis-measurement leads to apparent
missing momentum. The background contribution to theWproduction measurement from
photopro-duction is negligible. All background processes are estimated by the MC.
2.2 Experimental method
We require that there is at least one isolated electron or muon which is defined as the following.
• pT>10 GeV;
• 15◦< θl<120◦, whereθlis lepton polar angle;
• Dl; jet>1.0 andD(l;trk)>0.5, whereD(l; X) is distance from nearest jet (track) inη–φplane.
To avoid the overlap of two analyses, the electron channel should not include isolated muon.
The missing pT is required to be greater than 12 GeV. To ensure a high trigger efficiency, pT
measured in the calorimeter, pcalo
T is also required to be greater than 12 GeV. The energy deposited
by muons in the calorimeter is small, so thepcalo
T requirement is effectively a cut on pXT. Thus, a cut
pX
T >12 GeV is applied only for the muon channel.
In order to reduce the remaining SM background (mainly NC events), events are required to satisfy the following cuts:
• Vap/Vp <0.5, whereVap/Vp is the ratio of the anti-parallel to parallel momentum components of
all measured calorimetric clusters with respect to the direction of the total calorimetric transverse momentum.
• Vap/Vp <0.15 ifpXT <25 GeV;
• Δφl−X<160◦(170◦) for electron (muon) channel, whereΔφl−Xis the azimuthal difference between
lepton and the hadronic system, to reject back–to–back like SM backgrounds; • Ml
T>10 GeV, whereMlTis the transverse mass reconstructed by lepton andpmissT .
• For the electron channel:
– 5 < δmiss < 50 GeV, whereδmiss =2Ee0−iEi−pZ,i; E0e is beam electron energy,Eiis the
energy of thei-th calorimeter cell and the sum runs over all cells.δmissis zero for an event where
only momentum in the proton direction is undetected.
– ζ2
e =4EeEe0cos2θe/2>5000 GeV2for pcaloT <25 GeV, whereEeis the energy of the final state
electron andθeis its polar angle. For NC events, where the scattered electron is identified as the
isolated high transverse momentum electron,ζ2
e is equal to the four momentum transfer squared
Q2
e, as measured by the electron method [9].
The overall H1(ZEUS) selection efficiency in the common phase space is estimated using EPVEC to
be 30% (31%) for SMW →eνevents and 11% (9%) for SMW →μνevents.
2.3 Results
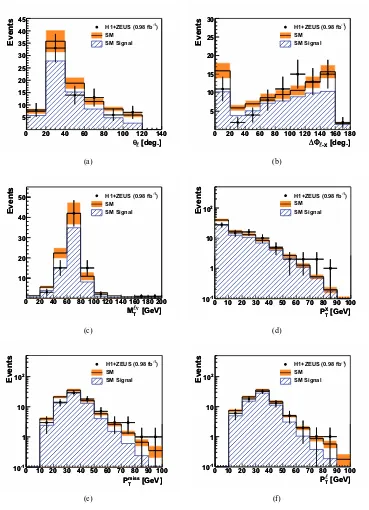
After the all selections, 81 events are observed in the final sample, while 87.8±11.0 events are
ex-pected. Fig. 2 shows good agreement between the observed data and MC in all kinematic distributions. The contribution from signal processes to the total H1 (ZEUS) SM expectation in the electron channel is 76% (65%) and in the muon channel 93% (83%). The total systematic uncertainties determined in the combined analysis are found to be the same as those derived by the individual experiments. A detailed list of systematic uncertainties considered can be found in the respective publications [7, 8].
The totalWboson production cross section at HERA is measured as:
σ(ep→WX)=1.06±0.16 (stat.)±0.07sys.pb, (1)
in agreement with the SM prediction of 1.26±0.19 pb.
At large hadronic transverse momentum region ofpXT >25 GeV, 29 events are observed, which is
comparable with the SM prediction of 24.0±3.2. The differential cross section as a function of pTX
is shown in Fig. 3, which is calculated by taking into account the acceptance bin by bin using MC. It
[deg.]
θ 0 20 40 60 80 100 120 140
Events 5 10 15 20 25 30 35 40 45 [deg.] θ 0 20 40 60 80 100 120 140
Events 5 10 15 20 25 30 35 40 45 SM SM Signal ) -1
H1+ZEUS (0.98 fb
[deg.]
θ 0 20 40 60 80 100 120 140
Events 5 10 15 20 25 30 35 40 45 (a) [deg.] -X Φ Δ
0 20 40 60 80 100 120 140 160 180
Events 5 10 15 20 25 30 [deg.] -X Φ Δ
0 20 40 60 80 100 120 140 160 180
Events 5 10 15 20 25 30 SM SM Signal ) -1
H1+ZEUS (0.98 fb
[deg.]
-X
Φ Δ
0 20 40 60 80 100 120 140 160 180
Events 5 10 15 20 25 30 (b) [GeV] ν T M
0 20 40 60 80 100 120 140 160 180 200
Events 10 20 30 40 50 [GeV] ν T M
0 20 40 60 80 100 120 140 160 180 200
Events 10 20 30 40 50 SM SM Signal ) -1
H1+ZEUS (0.98 fb
[GeV] ν
T
M
0 20 40 60 80 100 120 140 160 180 200
Events 10 20 30 40 50 (c) [GeV] X T P
0 10 20 30 40 50 60 70 80 90 100
Events -1 10 1 10 2 10 [GeV] X T P
0 10 20 30 40 50 60 70 80 90 100
Events -1 10 1 10 2
10 SMSM Signal
)
-1
H1+ZEUS (0.98 fb
[GeV]
X T
P
0 10 20 30 40 50 60 70 80 90 100
Events -1 10 1 10 2 10 (d) [GeV] miss T P
0 10 20 30 40 50 60 70 80 90 100
Events -1 10 1 10 2 10 [GeV] miss T P
0 10 20 30 40 50 60 70 80 90 100
Events -1 10 1 10 2
10 SMSM Signal
)
-1
H1+ZEUS (0.98 fb
[GeV]
miss T
P
0 10 20 30 40 50 60 70 80 90 100
Events -1 10 1 10 2 10 (e) [GeV] T P
0 10 20 30 40 50 60 70 80 90 100
Events -1 10 1 10 2 10 [GeV] T P
0 10 20 30 40 50 60 70 80 90 100
Events -1 10 1 10 2
10 SMSM Signal
)
-1
H1+ZEUS (0.98 fb
[GeV]
T
P
0 10 20 30 40 50 60 70 80 90 100
Events -1 10 1 10 2 10 (f)
Figure 2.Distributions of kinematic variables of events with an isolated electron or muon and missing transverse momentum in the full HERAe±pdata [4]. Shown are: the polar angle of the leptonθl (a), the difference in the azimuthal angle of the lepton and the hadronic systemΔφ(b), the lepton-neutrino transverse massMTlν (c), the hadronic transverse momentumpXT (d), the missing transverse momentum pmiss
T (e) and the transverse
[GeV]
X T
P
0 10 20 30 40 50 60 70 80 90 100
[fb/GeV]
X T
/dP
W
σ
d
1 10
2
10
[GeV]
X T
P
0 10 20 30 40 50 60 70 80 90 100
[fb/GeV]
X T
/dP
W
σ
d
1 10
2
10 H1+ZEUS (0.98 fb-1)
SM
Single W Production at HERA
[GeV]
X T
P
0 10 20 30 40 50 60 70 80 90 100
[fb/GeV]
X T
/dP
W
σ
d
1 10
2
10
Figure 3.The singleWproduction cross section as a function of the hadronic transverse momentum, pTX, mea-sured using the combined H1 and ZEUS data [4]. The inner error bar represents the statistical error and the outer error bar indicates the statistical and systematic uncertainties added in quadrature. The shaded band represents the uncertainty on the SM prediction.
3
Z
boson production measurement
3.1 Analysis overview
The production ofZ bosons has been measured using data collected with the ZEUS detector
corre-sponding to 0.5 fb−1. TheZ cross section is much smaller thanW, so the hadronic decay mode is
chosen because of the large branching ratio. It allows the excellent resolution of the ZEUS hadronic
calorimeter to be exploited to the full. The analysis is restricted to elastic and quasi-elasticZ
produc-tion in order to suppress QCD multi-jet background. The selected process isep(∗) → eZp(∗), where
p(∗)stands for a proton (elastic process) or a low-mass nucleon resonance (quasi-elastic process). In
such events, there are at least two hadronic jets with high transverse energies, and no hadronic energy deposits around the forward direction, in contrast to what would be expected in inelastic collisions.
SingleZ production simulated events are generated by the same MC event generator as used for
Wproduction, EPVEC. The cross section in the (quasi-) elastic reaction (ep(∗) →eZp(∗)) is calculated
to be 0.16 pb and those of DIS (γ∗p → ZX) and resolved photoproduction (γp → (qq¯→Z)X) is
0.24 pb. The difference betweene+pande−pcross sections is negligible for this analysis (<1% for
the DIS process).
A reliable prediction of the background events with the signal topology, which are predominantly
due to the diffractive photoproduction of jets of high transverse momentum, is currently not available.
Therefore, the background shape of the invariant-mass distribution is estimated with a data-driven method. The normalization is determined by a fit to the data.
3.2 Event selection
• at least two jets in the event withET>25GeV, whereETis the jet transverse energy;
• Δφj >2.0 rad, whereΔφjis the azimuthal difference between the first and second highest-ETjet,
as the two leading jets from theZ boson decays are expected to be nearly back-to-back in thex–y
plane.
The invariant mass,Mjetsis reconstructed by using all of jets withET >4GeV and|η|<2.0.
The following cuts are applied to suppress low-Q2NC and direct photoproduction backgrounds:
• ERCAL<2GeV, whereERCALis the total energy deposit in rear calorimeter;
• −5 < δmiss <9GeV: as explained in Sec. 2.2,δmissis zero for an event where only momentum in
the proton direction is undetected;
• There is at most one electron withθe<80◦, to take into account that beam electron is back scattered
to the forward calorimeter or forward beam pipe due to large mass of the producedZboson.
Finally, in order to require elastic and quasi-elastic scattering, a condition ofηmax<3.0 is required,
whereηmax is the maximum pseudo-rapidity of the calorimeter energy deposits. This requirement
largely suppress the inelastic background events, in whichηmax of much larger than 3.0 is given by
the calorimeter deposits due to the proton remnant.
After all selection cuts, 54 events remain. The total selection efficiency is estimated by the MC
simulation to be 22% for elastic and quasi-elastic processes and less than 1% for DIS and resolved photoproduction events. The number of expected signal events in the final sample, as predicted by EPVEC, is 18.3. The purity of elastic and quasi-elastic processes is 98%.
3.3 Background estimation
Figure 4 (a) shows the Mjets distribution after all the selection criteria except for the ηmax
require-ment. Figs. 4 (b)-(d) show theMjetsdistributions in variousηmaxslices after the same selection. No
significant dependence onηmaxof theMjetsdistribution beyond that caused by statistical fluctuations
is observed in the non-signal region. In addition, the shape of theMjetsdistribution outside of theZ
mass window in the signal region (ηmax <3.0) is found to be consistent with that in the non-signal
region (Fig. 5). Therefore, the shape of theMjetsdistribution in the non-signal region is adopted as a
background template in a fit to the data in the signal region.
3.4 Cross-section extraction
The cross section is obtained by the fitting the sum of the signal and a background template for the
Mjetsdistribution to the observed data. The templateNref,iis defined according to:
Nref,i=aNsgMC,i()+bNdatabg,i, (2)
whereiis the bin number of theMjetsdistribution. The parameter accounts for a possible energy
shift, i.e. Mjets =(1+)MjetsMC, whereMjetsMCis the invariant mass distribution of signal MC.NsgMC,i is
the number of signal expectation after the all selection cuts quoted by the MC.Ndatabg,iis the number of
events observed inηmax > 3.0 region. The parameters ‘a’ and ‘b’ are normalization factors for the
signal and background, and treated as free parameters in a binned maximum likelihood fit. Theis
also the fitting parameter, and a possible shift of theZ mass peak byof 3% is taken into account
in the likelihood. The best fit parametera is determined to be 0.82+0.38
−0.35. Figure 5 shows the Mjets
(GeV)
jets
M
40 60 80 100 120 140
E
vents
0 200 400 600
(GeV)
jets
M
40 60 80 100 120 140
E
vents
0 200 400 600
-1 ZEUS 496 pb
(a) region
max η
All
5257 events
(GeV)
jets
M
40 60 80 100 120 140
E
vents
0 50 100
(GeV)
jets
M
40 60 80 100 120 140
E
vents
0 50
100 (b) 3.0 < ηmax < 4.0
918 events
(GeV)
jets
M
40 60 80 100 120 140
E
vents
0 100 200
(GeV)
jets
M
40 60 80 100 120 140
E
vents
0 100
200 (c) < 4.2
max η
4.0 <
1743 events
(GeV)
jets
M
40 60 80 100 120 140
E
vents
0 100 200 300
(GeV)
jets
M
40 60 80 100 120 140
E
vents
0 100 200
300 (d) > 4.2
max η
2542 events
ZEUS
Figure 4.The reconstructedZmass distribution of the data (a) after all selection criteria, except for theηmaxcut,
(b-d) in severalηmaxslices [5].
uncertainty comes from the difference of the shapes ofηmaxdistributions between data and MC. The
total systematic uncertainty is (+7.2, -6.2)%. More details can be found in [5]. The observed cross
section of the reactionep→eZp(∗)obtained by the fit is:
σep→eZp(∗)=0.13±0.06 (stat.)±0.01 (sys.), (3)
in agreement with the SM prediction of 0.16 pb.
4 Conclusion
Measurements of cross sections ofW andZ bosons inep collisions have been performed. These
processes are important not only to test the Standard Model but also to understand the background
processes for physics beyond the Standard Model. The totalWboson cross section is measured in the
search for events with isolated lepton and missing transverse momentum to be 1.06±0.16 (stat.)±
0.07sys.pb, using combined data of H1 and ZEUS experiments amounting to 0.98 fb−1of integrated
(GeV) jets M
40 60 80 100 120 140
Events
0 2 4 6 8
10 ZEUS 496 pb-1
signal + b.g. ) 0
Fit ( Z
Fit ( b.g. ) +7.0
= 15.0
obs
N
6.4ZEUS
Figure 5.The reconstructedZmass distribution and the fit result [5]. The data are shown as points, and the fitting result of signal+background (background component) is shown as solid (dashed) line. The error bars represent the approximate Poisson 68% C.L. intervals, calculated as±√n+0.25+0.5 for a given entryn.
section in elastic or quasi-elastic scattering is obtained as 0.13±0.06 (stat.)±0.01sys.pb. TheZ
is measured in the hadronic decay mode, using 0.5 fb−1data collected with ZEUS. Both results are in
good agreement with the Standard Model predictions.
References
[1] H. Abramowicz et al., ZEUS Collaboration, Phys. Rev.D87, 052014 (2013).
[2] F. D. Aaron et al., H1 Collaboration, JHEP09, 061 (2012).
[3] H. Abramowicz et al., ZEUS Collaboration, Eur. Phys. J. C70, 945-963 (2010).
[4] F. D. Aaron et. al., H1 and ZEUS Collaborations, JHEP3, 1-19 (2010).
[5] H. Abramowicz et al., ZEUS Collaboration, Phys. Lett.B718, 915-921 (2013).
[6] U. Baur, J. A. M. Vermaseren and D. Zeppenfeld, Nucl. Phys.B375, 3 (1992).
[7] F. D. Aaron et al., H1 Collaboration, Eur. Phys. J.C64, 251-271 (2009).
[8] S. Chekanov et al., ZEUS Collaboration, Phys. Lett.B672106 (2009).
[9] F. Jacquet and A. Blondel, proceedings of "Study of anepFacility for Europe", (U. Amaldi ed.),
![Figure 1. Examples of tree level diagrams of W (left) [7] and Z (right) [5] boson production in ep collisions.](https://thumb-us.123doks.com/thumbv2/123dok_us/8200662.1369785/2.482.92.381.79.177/figure-examples-level-diagrams-right-boson-production-collisions.webp)
![Figure 3. The single W production cross section as a function of the hadronic transverse momentum, pXT, mea-sured using the combined H1 and ZEUS data [4]](https://thumb-us.123doks.com/thumbv2/123dok_us/8200662.1369785/5.482.123.362.79.276/figure-production-section-function-hadronic-transverse-momentum-combined.webp)
![Figure 4. The reconstructed Z mass distribution of the data (a) after all selection criteria, except for the ηmax cut,(b-d) in several ηmax slices [5].](https://thumb-us.123doks.com/thumbv2/123dok_us/8200662.1369785/7.482.82.397.80.404/figure-reconstructed-distribution-selection-criteria-hmax-hmax-slices.webp)
![Figure 5. The reconstructed Z mass distribution and the fit result [5]. The data are shown as points, and the fittingresult of signal+background (background component) is shown as solid (dashed) line](https://thumb-us.123doks.com/thumbv2/123dok_us/8200662.1369785/8.482.137.346.81.294/figure-reconstructed-distribution-ttingresult-background-background-component-dashed.webp)
