Mixture Model-based Minimum Bayes Risk Decoding using Multiple
Machine Translation Systems
Nan Duan
1School of Computer Science and Technology
Tianjin University
[email protected]
Mu Li, Dongdong Zhang, Ming Zhou
Microsoft Research Asia
[email protected]
[email protected]
[email protected]
Abstract
We present Mixture Model-based Mini-mum Bayes Risk (MMMBR) decoding, an approach that makes use of multiple SMT systems to improve translation ac-curacy. Unlike existing MBR decoding methods defined on the basis of single SMT systems, an MMMBR decoder re-ranks translation outputs in the combined search space of multiple systems using the MBR decision rule and a mixture dis-tribution of component SMT models for translation hypotheses. MMMBR decod-ing is a general method that is indepen-dent of specific SMT models and can be applied to various commonly used search spaces. Experimental results on the NIST Chinese-to-English MT evaluation tasks show that our approach brings significant improvements to single system-based MBR decoding and outperforms a state-of-the-art system combination method. 1
1
Introduction
Minimum Bayes Risk (MBR) decoding is be-coming more and more popular in recent Statis-tical Machine Translation (SMT) research. This approach requires a second-pass decoding pro-cedure to re-rank translation hypotheses by risk scores computed based on model’s distribution.
Kumar and Byrne (2004) first introduced MBR decoding to SMT field and developed it on the N-best list translations. Their work has shown that MBR decoding performs better than Maximum a Posteriori (MAP) decoding for dif-ferent evaluation criteria. After that, many
1
This work has been done while the author was visiting Microsoft Research Asia.
cated efforts have been made to improve the per-formances of SMT systems by utilizing MBR-inspired methods. Tromble et al. (2008) pro-posed a linear approximation to BLEU score (log-BLEU) as a new loss function in MBR de-coding and extended it from N-best lists to lat-tices, and Kumar et al. (2009) presented more efficient algorithms for MBR decoding on both lattices and hypergraphs to alleviate the high computational cost problem in Tromble et al.’s
work. DeNero et al. (2009) proposed a fast con-sensus decoding algorithm for MBR for both linear and non-linear similarity measures.
All work mentioned above share a common setting: an MBR decoder is built based on one and only one MAP decoder. On the other hand, recent research has shown that substantial im-provements can be achieved by utilizing consen-sus statistics over multiple SMT systems (Rosti
et al., 2007; Li et al., 2009a; Li et al., 2009b; Liu et al., 2009). It could be desirable to adapt MBR decoding to multiple SMT systems as well.
The rest of the paper is organized as follows: In Section 2, we first review traditional MBR decoding method and summarize various search spaces that can be utilized by an MBR decoder. Then, we describe how a mixture model can be used to combine distributions of multiple SMT systems for Bayes risk computation. Lastly, we present detailed MMMBR decoding model on multiple systems and make comparison with single system-based MBR decoding methods. Section 3 describes how to optimize different types of parameters. Experimental results will be shown in Section 4. Section 5 discusses some related work and Section 6 concludes the paper.
2
Mixture Model-based MBR Decoding
2.1 Minimum Bayes Risk Decoding
Given a source sentence , MBR decoding aims to find the translation with the least expected loss under a probability distribution. The objec-tive of an MBR decoder can be written as:
(1)
where denotes a search space for hypothesis selection; denotes an evidence space for Bayes risk computation; denotes a function that measures the loss between and ; is the underlying distribution based on .
Some of existing work on MBR decoding fo-cused on exploring larger spaces for both and , e.g. from N-best lists to lattices or hypergraphs (Tromble et al., 2008; Kumar et al., 2009). Various loss functions have also been investigated by using different evaluation crite-ria for similarity computation, e.g. Word Error Rate, Position-independent Word Error Rate, BLEU and log-BLEU (Kumar and Byrne, 2004; Tromble et al., 2008). But less attention has been paid to distribution . Currently, many SMT systems based on different paradigms can yield similar performances but are good at mod-eling different inputs in the translation task (Koehn et al., 2004a; Och et al., 2004; Chiang, 2007; Mi et al., 2008; Huang, 2008). We expect to integrate the advantages of different SMT models into MBR decoding for further im-provements. In particular, we make depth in-vestigation into MBR decoding concentrating on
the translation distribution by leveraging a mixture model based on multiple SMT systems.
2.2 Summary of Translation Search Spaces
There are three major forms of search spaces that can be obtained from an MAP decoder as a byproduct, depending on the design of the de-coder: N-best lists, lattices and hypergraphs.
An N-best list contains the most probable translation hypotheses produced by a decoder. It only presents a very small portion of the entire search space of an SMT model.
A hypergraph is a weighted acyclic graph which compactly encodes an exponential num-ber of translation hypotheses. It allows us to represent both phrase-based and syntax-based systems in a unified framework. Formally, a hypergraph is a pair , where is a set of hypernodes and is a set of hyperedges. Each hypernode corresponds to transla-tion hypotheses with identical decoding states, which usually include the span of the words being translated, the grammar symbol for that span and the left and right boundary words of hypotheses for computing language model (LM) scores. Each hyperedge cor-responds to a translation rule and connects a head node and a set of tail nodes . The number of tail nodes is called the arity of the hyperedge and the arity of a hypergraph is the maximum arity of its hyperedges. If the arity of a hyperedge is zero, is then called a
source node. Each hypergraph has a unique root node and each path in a hypergraph induces a translation hypothesis. A lattice (Ueffing et al., 2002) can be viewed as a special hypergraph, in which the maximum arity is one.
2.3 Mixture Model for SMT
We first describe how to construct a general dis-tribution for translation hypotheses over multiple SMT systems using mixture modeling for usage in MBR decoding.
(2)
In Equation 2, are system weights which hold following constraints: and , is the th distri-bution estimated on the search space based on the log-linear formulation:
where is the score function of the th system for translation , is a scaling factor that determines the flatness of the distri-bution sharp ( ) or smooth ( ).
Due to the inherent differences in SMT mod-els, translation hypotheses have different distri-butions in different systems. A mixture model can effectively combine multiple distributions with tunable system weights. The distribution of a single model used in traditional MBR can be seen as a special mixture model, where is one.
2.4 Mixture Model for SMT
Let denote machine translation systems, denotes the search space produced by system in MAP decoding procedure. An MMMBR decoder aims to seek a translation from the combined search space that maximizes the expected gain score based on a mixture model . We write the objec-tive function of MMMBR decoding as:
(3)
For the gain function , we follow Trom-ble et al. (2008) to use log-BLEU, which is scored by the hypothesis length and a linear function of n-gram matches as:
In this definition, is a reference translation, is the length of hypothesis , is an n -gram presented in , is the number of times that occurs in , and is an indi-cator function which equals to 1 when occurs in and 0 otherwise. are model parameters, where is the maximum order of the n-grams involved.
For the mixture model , we replace it by Equation 2 and rewrite the total gain score for hypothesis in Equation 3:
(4)
In Equation 4, the total gain score on the com-bined search space can be further decom-posed into each local search space with a specified distribution . This is a nice property and it allows us to compute the total gain score as a weighted sum of local gain scores on different search spaces. We expand the local gain score for computed on search space
with using log-BLEU as:
We make two approximations for the situations when : the first is and the second is In fact, due to the differences in ge-nerative capabilities of SMT models, training data selection and various pruning techniques used, search spaces of different systems are al-ways not identical in practice. For the conveni-ence of formal analysis, we treat all as ideal distributions with assumptions that all systems work in similar settings, and translation candidates are shared by all systems.
The method for computing n-gram posterior probability in Equation 5 depends on different types of search space :
When is an N-best list, it can be com-puted immediately by enumerating all trans-lation candidates in the N-best list:
When is a hypergraph (or a lattice) that encodes exponential number of hypotheses, it is often impractical to compute this proba-bility directly. In this paper, we use the al-gorithm presented in Kumar et al. (2009) which is described in Algorithm 12:
counts the edge with n-gram that has the highest edge posterior proba-bility relative to predecessors in the entire graph , and is the edge posterior probability that can be efficiently computed with standard inside and outside probabili-ties and as:
where is the weight of hyperedge in , is the normalization factor that equals to the inside probability of the root node in .
Algorithm 1: Compute n-gram posterior proba-bilities on hypergraph (Kumar et al., 2009)
1: sort hypernodes topologically
2: compute inside/outside probabilities and for each hypernode
3: compute edge posterior probability for each hyperedge
4: for each hyperedge do
5: merge n-grams on and keep the highest probability when n-grams are duplicated 6: apply the rule of edge to n-grams on and
propagate gram prefixes/suffixes to 7: for each n-gram introduced by do
8: if then
9:
10: else
11:
12: end if
13: end for
14: end for
15: return n-gram posterior probability set
2
We omit the similar algorithm for lattices because of their homogenous structures comparing to hypergraphs as we discussed in Section 2.2.
Thus, the total gain score for hypothesis on can be further expanded as:
where is a mixture n -gram posterior probability. The most important fact derived from Equation 6 is that, the mixture of different distributions can be simplified to the weighted sum of n-gram posterior probabilities on different search spaces.
We now derive the decision rule of MMMBR decoding based on Equation 6 below:
(7)
We also notice that MAP decoding and MBR decoding are two different ways of estimating the probability and each of them has advantages and disadvantages. It is desirable to interpolate them together when choosing the fi-nal translation outputs. So we include each sys-tem’s MAP decoding cost as an additional fea-ture further and modify Equation 7 to:
′
(8)
where is the model cost as-signed by the MAP decoder for hypothesis . Because the costs of MAP decoding on different SMT models are not directly comparable, we utilize the MERT algorithm to assign an appro-priate weight for each component system.
Compared to single system-based MBR de-coding, which obeys the decision rule below:
MMMBR decoding has a similar objective func-tion (Equafunc-tion 8). The key difference is that, in MMMBR decoding, n-gram posterior probabili-ty is computed as based on an ensemble of search spaces; meanwhile, in single system-based MBR decoding, this quanti-ty is computed locally on single search space . The procedure of MMMBR decoding on mul-tiple SMT systems is described in Algorithm 2.
Algorithm 2: MMMBR decoding on multiple SMT systems
1: for each component system do
2: run MAP decoding and generate the correspond-ing search space
3: compute the n-gram posterior probability set
for based on Algorithm 1
4: end for
5 compute the mixture n-gram posterior probability
for each :
6: for each unique n-gram appeared in do 7: for each search space do
8
9: end for 10: end for
11: for each hyperedge in do
12: assign to the edge for all contained in
13: end for
14: return the best path according to Equation 8
3
A Two-Pass Parameter Optimization
In Equation 8, there are two types of parameters: parameters introduced by the gain function and the model cost , and system weights introduced by the mixture model . Because Equation 8 is not a linear function when all pa-rameters are taken into account, MERT algo-rithm (Och, 2003) cannot be directly applied to optimize them at the same time. Our solution is to employ a two-pass training strategy, in which we optimize parameters for MBR first and then system weights for the mixture model.
3.1 Parameter Optimization for MBR
The inputs of an MMMBR decoder can be a combination of translation search spaces with arbitrary structures. For the sake of a general and convenience solution for optimization, we utilize the simplest N-best lists with proper sizes as approximations to arbitrary search spaces to optimize MBR parameters using MERT in the first-pass training. System weights can be set
empirically based on different performances, or equally without any bias. Note that although we tune MBR parameters on N-best lists, n-gram posterior probabilities used for Bayes risk computation could still be estimated on hypergraphs for non N-best-based search spaces.
3.2 Parameter Optimization for Mixture Model
After MBR parameters optimized, we begin to tune system weights for the mixture model in the second-pass training. We rewrite Equation 8 as:
′
For each , the aggregated score surrounded with braces can be seen as its feature value. Eq-uation 9 now turns to be a linear function for all weights and can be optimized by the MERT.
4
Experiments
4.1 Data and Metric
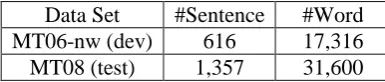
We conduct experiments on the NIST Chinese-to-English machine translation tasks. We use the newswire portion of the NIST 2006 test set (MT06-nw) as the development set for parameter optimization, and report results on the NIST 2008 test set (MT08). Translation performances are measured in terms of case-insensitive BLEU scores. Statistical significance is computed using the bootstrap re-sampling method proposed by Koehn (2004b). Table 1 gives data statistics.
Data Set #Sentence #Word MT06-nw (dev) 616 17,316 MT08 (test) 1,357 31,600
Table 1. Statistics on dev and test data sets
A 5-gram language model is trained on the English side of all bilingual data plus the Xinhua portion of LDC English Gigaword Version 3.0.
4.2 System Description
We use two baseline systems. The first one (SYS1) is a hierarchical phrase-based system (Chiang, 2007) based on Synchronous Context Free Grammar (SCFG), and the second one (SYS2) is a phrasal system (Xiong et al., 2006) based on Bracketing Transduction Grammar (Wu, 1997) with a lexicalized reordering com-ponent based on maximum entropy model. Phrasal rules shared by both systems are ex-tracted on all bilingual data, while hierarchical rules for SYS1 only are extracted on a selected data set, including LDC2003E07, LDC2003E14, LDC2005T06, LDC2005T10, LDC2005E83, LDC2006E26, LDC2006E34, LDC2006E85 and LDC2006E92, which contain about 498,000 sen-tence pairs. Translation hypergraphs are generat-ed by each baseline system during the MAP de-coding phase, and 1000-best lists used for MERT algorithm are extracted from hyper-graphs by the k-best parsing algorithm (Huang and Chiang, 2005). We tune scaling factor to optimize the performance of HyperGraph-based MBR decoding (HGMBR) on MT06-nw for each system (0.5 for SYS1 and 0.01 for SYS2).
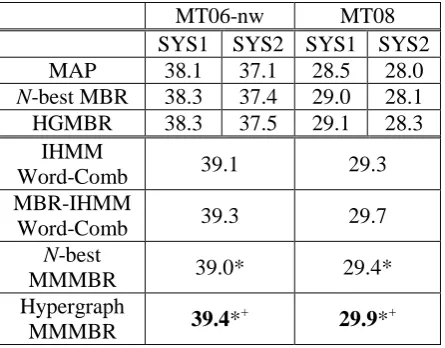
4.3 MMMBR Results on Multiple Systems
We first present the overall results of MMMBR decoding on two baseline systems.
To compare with single system-based MBR methods, we re-implement N-best MBR, which performs MBR decoding on 1000-best lists with the fast consensus decoding algorithm (DeNero
et al., 2009), and HGMBR, which performs MBR decoding on a hypergraph (Kumar et al., 2009). Both methods use log-BLEU as the loss function. We also compare our method with
IHMM Word-Comb, a state-of-the-art word-level system combination approach based on incre-mental HMM alignment proposed by Li et al.
(2009b). We report results of MMMBR decod-ing on both N-best lists (N-best MMMBR) and hypergraphs (Hypergraph MMMBR) of two baseline systems. As MBR decoding can be used for any SMT system, we also evaluate MBR-IHMM Word-Comb, which uses N-best lists generated by HGMBR on each baseline systems.
The default beam size is set to 50 for MAP de-coding and hypergraph generation. The setting of N-best candidates used for (MBR-) IHMM Word-Comb is the same as the one used in Li et al. (2009b). The maximum order of n-grams in-volved in MBR model is set to 4. Table 2 shows the evaluation results.
MT06-nw MT08
SYS1 SYS2 SYS1 SYS2 MAP 38.1 37.1 28.5 28.0
N-best MBR 38.3 37.4 29.0 28.1 HGMBR 38.3 37.5 29.1 28.3
IHMM
Word-Comb 39.1 29.3
MBR-IHMM
Word-Comb 39.3 29.7
N-best
MMMBR 39.0* 29.4*
Hypergraph
MMMBR 39.4*
+
29.9*+
Table 2. MMMBR decoding on multiple sys-tems (*: significantly better than HGMBR with ; +: significantly better than IHMM Word-Comb with )
From Table 2 we can see that, compared to MAP decoding, N-best MBR and HGMBR only improve the performance in a relative small range (+0.1~+0.6 BLEU), while MMMBR de-coding on multiple systems can yield significant improvements on both dev set (+0.9 BLEU on
N-best MMMBR and +1.3 BLEU on Hyper-graph MMMBR) and test set (+0.9 BLEU on N -best MMMBR and +1.4 BLEU on Hypergraph MMMBR); compared to IHMM Word-Comb,
N-best MMMBR can achieve comparable results on both dev and test sets, while Hypergraphs MMMBR can achieve even better results (+0.3 BLEU on dev and +0.6 BLEU on test); com-pared to MBR-IHMM Word-Comb, Hypergraph MMMBR can also obtain comparable results with tiny improvements (+0.1 BLEU on dev and +0.2 BLEU on test). However, MBR-IHMM Word-Comb has ability to generate new hypo-theses, while Hypergraph MMMBR only choos-es translations from original search spacchoos-es.
IHMM Word-Comb with the same candidate size and HGMBR with the same beam size. We list the results of MAP decoding for comparison. The comparative results on MT08 are shown in Figure 1, where X-axis is the size used for all methods each time, Y-axis is the BLEU score, MAP- and HGMBR- stand for MAP decoding and HGMBR decoding for the th system.
Figure 1. MMMBR vs. (MBR-) IHMM Word-Comb and HGMBR with different sizes
From Figure 1 we can see that, MMMBR de-coding performs consistently better than both (MBR-) IHMM Word-Comb and HGMBR on all sizes. The gains achieved are around +0.5 BLEU compared to IHMM Word-Comb, +0.2 BLEU compared to MBR-IHMM Word-Comb, and +0.8 BLEU compared to HGMBR. Com-pared to MAP decoding, the best result (30.1) is obtained when the size is 100, and the largest improvement (+1.4 BLEU) is obtained when the size is 50. However, we did not observe signifi-cant improvement when the size is larger than 50.
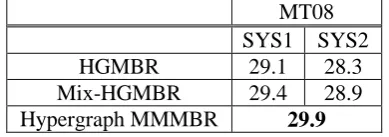
We then setup an experiment to verify that the mixture model based on multiple distributions is more effective than any individual distributions for Bayes risk computation in MBR decoding. We use Mix-HGMBR to denote MBR decoding performed on single hypergraph of each system in the meantime using a mixture model upon distributions of two systems for Bayes risk com-putation. We compare it with HGMBR and Hypergraph MMMBR and list results in Table 3.
MT08 SYS1 SYS2
HGMBR 29.1 28.3
Mix-HGMBR 29.4 28.9 Hypergraph MMMBR 29.9
Table 3. Performance of MBR decoding on dif-ferent settings of search spaces and distributions
It can be seen that based on the same search space, the performance of Mix-HGMBR is sig-nificantly better than that of HGMBR (+0.3/+0.6 BLEU on dev/test). Yet the performance is still not as good as Hypergraph, which indicates the fact that the mixture model and the combination of search spaces are both helpful to MBR decod-ing, and the best choice is to use them together.
We also empirically investigate the impacts of different system weight settings upon the per-formances of Hypergraph MMMBR on dev set in Figure 2, where X-axis is the weight for SYS1, Y-axis is the BLEU score. The weight for SYS2 equals to as only two systems involved. The best evaluation result on dev set is achieved when the weight pair is set to 0.7/0.3 for SYS1/SYS2, which is also very close to the one trained automatically by the training strategy presented in Section 3.2. Although this training strategy can be processed repeatedly, the per-formance is stable after the 1st round finished.
Figure 2. Impacts of different system weights in the mixture model
4.4 MMMBR Results on Identical Systems with Different Translation Models
Inspired by Macherey and Och (2007), we ar-range a similar experiment to test MMMBR de-coding for each baseline system on an ensemble of sub-systems built by the following two steps.
Firstly, we iteratively apply the following procedure 3 times: at the th time, we randomly sample 80% sentence pairs from the total bilin-gual data to train a translation model and use it to build a new system based on the same decod-er, which is denoted as sub-system- . Table 4 shows the evaluation results of all sub-systems on MT08, where MAP decoding (the former ones) and corresponding HGMBR (the latter ones) are grouped together by a slash. We set all beam sizes to 20 for a time-saving purpose.
27.5 28.0 28.5 29.0 29.5 30.0 30.5
10 20 50 100 150
MAP-1
MAP-2
HGMBR-1
HGMBR-2
IHMM
MBR-IHMM
MMMBR
38.5 38.7 38.9 39.1 39.3 39.5
0.1 0.2 0.3 0.4 0.5 0.6 0.7 0.8 0.9
MT08
SYS1 SYS2
Baseline 28.4/29.0 27.6/27.8 sub-system-1 28.1/28.5 26.8/27.3 sub-system-2 28.3/28.4 27.0/27.1 sub-system-3 27.7/28.0 27.3/27.6
Table 4. Performance of sub-systems
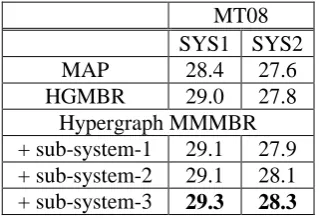
Secondly, starting from each baseline system, we gradually add one more sub-system each time and perform Hypergraph MMMBR on hypergraphs generated by current involved sys-tems. Table 5 shows the evaluation results.
MT08 SYS1 SYS2 MAP 28.4 27.6 HGMBR 29.0 27.8
Hypergraph MMMBR + sub-system-1 29.1 27.9 + sub-system-2 29.1 28.1 + sub-system-3 29.3 28.3
Table 5. Performance of Hypergraph MMMBR on multiple sub-systems
We can see from Table 5 that, compared to the results of MAP decoding, MMMBR decod-ing can achieve significant improvements when more than one sub-system are involved; however, compared to the results of HGMBR on baseline systems, there are few changes of performance when the number of sub-systems increases. One potential reason is that the translation hypotheses between multiple sub-systems under the same SMT model hold high degree of correlation, which is discussed in Macherey and Och (2007).
We also evaluate MBR-IHMM Word-Comb on N-best lists generated by each baseline sys-tem with its corresponding three sub-syssys-tems. Evaluation results are shown in Table 6, where Hypergraph MMMBR still outperforms MBR-IHMM Word-Comb on both baseline systems.
MT08 SYS1 SYS2 MBR-IHMM Word-Comb 29.1 28.0
Hypergraph MMMBR 29.3 28.3
Table 6. Hypergraph MMMBRvs. MBR-IHMM Word-Comb with multiple sub-systems
5
Related Work
Employing consensus between multiple systems to improve machine translation quality has made rapid progress in recent years. System combina-tion methods based on confusion networks (Ros-ti et al., 2007; Li et al., 2009b) have shown state-of-the-art performances in MT benchmarks. Different from them, MMMBR decoding me-thod does not generate new translations. It main-tains the essential of MBR methods to seek translations from existing search spaces. Hypo-thesis selection method (Hildebrand and Vogel, 2008) resembles more our method in making use of n-gram statistics. Yet their work does not be-long to the MBR framework and treats all sys-tems equally. Li et al. (2009a) presents a co-decoding method, in which n-gram agreement and disagreement statistics between translations of multiple decoders are employed to re-rank both full and partial hypotheses during decoding. Liu et al. (2009) proposes a joint-decoding me-thod to combine multiple SMT models into one decoder and integrate translation hypergraphs generated by different models. Both of the last two methods work in a white-box way and need to implement a more complicated decoder to integrate multiple SMT models to work together; meanwhile our method can be conveniently used as a second-pass decoding procedure, without considering any system implementation details.
6
Conclusions and Future Work
In this paper, we have presented a novel MMMBR decoding approach that makes use of a mixture distribution of multiple SMT systems to improve translation accuracy. Compared to single system-based MBR decoding methods, our method can achieve significant improve-ments on both dev and test sets. What is more, MMMBR decoding approach also outperforms a state-of-the-art system combination method. We have empirically verified that the success of our method comes from both the mixture modeling of translation hypotheses and the combined search space for translation selection.
References
Chiang David. 2007. Hierarchical Phrase Based Translation. Computational Linguistics, 33(2): 201-228.
DeNero John, David Chiang, and Kevin Knight. 2009.
Fast Consensus Decoding over Translation Forests. In Proc. of 47th Meeting of the Associa-tion for ComputaAssocia-tional Linguistics, pages 567-575.
Hildebrand Almut Silja and Stephan Vogel. 2008.
Combination of Machine Translation Systems via Hypothesis Selection from Combined N-best lists. In Proc. of the Association for Machine Translation in the Americas, pages 254-261.
Huang Liang and David Chiang. 2005. Better k-best Parsing. In Proc. of 7th International Conference on Parsing Technologies, pages 53-64.
Huang Liang. 2008. Forest Reranking: Discrimin-ative Parsing with Non-Local Features. In
Proc. of 46th Meeting of the Association for Com-putational Linguistics, pages 586-594.
Koehn Philipp. 2004a. Phrase-based Model for SMT.Computational Linguistics, 28(1): 114-133.
Koehn Philipp. 2004b. Statistical Significance Tests for Machine Translation Evaluation. In
Proc. of Empirical Methods on Natural Language Processing, pages 388-395.
Kumar Shankar and William Byrne. 2004. Minimum Bayes-Risk Decoding for Statistical Machine Translation. In Proc. of the North American Chapter of the Association for Computational Lin-guistics, pages 169-176.
Kumar Shankar, Wolfgang Macherey, Chris Dyer, and Franz Och. 2009. Efficient Minimum Error Rate Training and Minimum Bayes-Risk De-coding for Translation Hypergraphs and Lat-tices. In Proc. of 47th Meeting of the Association for Computational Linguistics, pages 163-171.
Li Mu, Nan Duan, Dongdong Zhang, Chi-Ho Li, and Ming Zhou. 2009a. Collaborative Decoding: Partial Hypothesis Re-Ranking Using Trans-lation Consensus between Decoders. In Proc. of 47th Meeting of the Association for Computa-tional Linguistics, pages 585-592.
Liu Yang, Haitao Mi, Yang Feng, and Qun Liu. 2009.
Joint Decoding with Multiple Translation Models. In Proc. of 47th Meeting of the Associa-tion for ComputaAssocia-tional Linguistics, pages 576-584.
Li Chi-Ho, Xiaodong He, Yupeng Liu, and Ning Xi. 2009b. Incremental HMM Alignment for MT system Combination. In Proc. of 47th Meeting of the Association for Computational Linguistics, pages 949-957.
Mi Haitao, Liang Huang, and Qun Liu. 2008. Forest-Based Translation. In Proc. of 46th Meeting of the Association for Computational Linguistics, pages 192-199.
Macherey Wolfgang and Franz Och. 2007. An Em-pirical Study on Computing Consensus Trans-lations from multiple Machine Translation Systems. In Proc. of Empirical Methods on Natu-ral Language Processing, pages 986-995.
Och Franz. 2003. Minimum Error Rate Training in Statistical Machine Translation. In Proc. of 41th Meeting of the Association for Computational Linguistics, pages 160-167.
Och Franz and Hermann Ney. 2004. The Alignment template approach to Statistical Machine Translation. Computational Linguistics, 30(4): 417-449.
Rosti Antti-Veikko, Spyros Matsoukas, and Richard Schwartz. 2007. Improved Word-Level System Combination for Machine Translation. In Proc. of 45th Meeting of the Association for Computa-tional Linguistics, pages 312-319.
Roy Tromble, Shankar Kumar, Franz Och, and Wolf-gang Macherey. 2008. Lattice Minimum Bayes-Risk Decoding for Statistical Machine Trans-lation. In Proc. of Empirical Methods on Natural Language Processing, pages 620-629.
Ueffing Nicola, Franz Och, and Hermann Ney. 2002.
Generation of Word Graphs in Statistical Ma-chine Translation. In Proc. of Empirical Me-thods on Natural Language Processing, pages 156-163.
Wu Dekai. 1997. Stochastic Inversion Transduc-tion Grammars and Bilingual Parsing of Pa-rallel Corpora. Computational Linguistics, 23(3): 377-404.
Xiong Deyi, Qun Liu, and Shouxun Lin. 2006. Max-imum Entropy based Phrase Reordering Model for Statistical Machine Translation. In