318
Automatic Assessment of Conceptual Text Complexity
Using Knowledge Graphs
Sanja ˇStajner and Ioana Hulpus¸
Data and Web Science Group University of Mannheim, Germany
{sanja,ioana}@informatik.uni-mannheim.de
Abstract
Complexity of texts is usually assessed only at the lexical and syntactic levels. Although it is known that conceptual complexity plays a significant role in text understanding, no attempts have been made at assessing it automatically. We propose to automatically estimate the conceptual complexity of texts by exploiting a number of graph-based measures on a large knowledge base. By using a high-quality language learners corpus for English, we show that graph-based measures of individual text concepts, as well as the way they relate to each other in the knowledge graph, have a high discriminative power when distinguishing between two versions of the same text. Furthermore, when used as features in a binary classification task aiming to choose the simpler of two versions of the same text, our measures achieve high performance even in a default setup.
1 Introduction
A text can be complex on various levels. It can contain many infrequent words that are unknown to the reader (lexical complexity). It can contain long sentences with difficult syntactic structures or syntactic structures unknown to the reader (syntactic complexity), especially in the case of children or non-native language learners. A much less studied level of text complexity is the conceptual or semantic level, which accounts for the amount of background knowledge required to understand the meaning of the text. While many methods have been proposed so far for automatic assessment of lexical and syntactic text complexity (Vajjala and Meurers, 2014; Vajjala and Meurers, 2015; Ambati et al., 2016), automatic assessment of conceptual text complexity has never been attempted so far. Similarly, in the task of automatic text simplification, only two systems attempted at simplifying the overall text structure by eliminating irrelevant pieces of information (Narayan and Gardent, 2014; ˇStajner and Glavaˇs, 2017).
Texts that are conceptually complex tend to contain difficult and abstract concepts which are not easy to relate to each other, or they mention numerous entities which are not closely related, requiring substantial background knowledge. Kintsch and van Dijk (1978) distinguish between the micro- and macrostructure of text semantics. The former takes into account the individual concepts and their local relations, while the latter considers their organization at a global level. Conceptual complexity is reflected in both those components and thus conceptual simplification must also be performed on both levels.
Conceptual complexity is especially important for low-knowledge readers, who might have problems accessing their prior knowledge (Denton et al., 2015; McNamara et al., 2012). They benefit particularly from texts that require less inferences, and not so much from simplifications at the linguistic level (Arf´e et al., 2017). The amount of inferences that readers need to make in order to fill in the gaps in text coherence, and the effort needed to understand the text is a measure of cognitive or conceptual text complexity (Arf´e et al., 2017).
Our work sets up a new task of automatic assessment of conceptual complexity. We define conceptual complexity as the level of background knowledge necessary to understand the text. We pose a number of hypotheses on how structured encyclopedic knowledge bases can be used for this task, and propose a number of graph-based features (Section 4) which capture both micro- and macrostructure of conceptual
text complexity. Our experiments, carried out over documents from a high-quality language learners corpus for English, show that the graph structure of encyclopedic knowledge can be leveraged in order to accurately assess conceptual complexity of informational text (i.e. news stories). This is particularly important as simplification of such texts improves social inclusion of many target audiences (Carroll et al., 1998; Alu´ısio and Gasperin, 2010; Saggion et al., 2011; ˇStajner et al., 2014).
2 Knowledge Graphs for Measuring Conceptual Complexity
Language as a networked system has been vastly researched over the last decades, especially with the purpose of capturing word semantics (Borge-Holthoefer and Arenas, 2010). One of the core concepts that have been proposed is that of semantic networks. Various types of semantic networks have been studied, with the aim of explaining the organization of human semantic knowledge: hierarchical net-works (Collins and Quillian, 1969), associative netnet-works (Nelson et al., 2004), thesauri such as Roget’s thesaurus (Jarmasz and Szpakowicz, 2012), terminological ontologies such as WordNet (Miller, 1995), as well as word networks resulted from corpus analysis, e.g. co-occurrence networks (Stubbs, 1996).
Most of these networks were shown to have very similar large-scale structures, and furthermore, also similar to the structure of the World-Wide-Web (Steyvers and Tenenbaum, 2005). Especially in the case of associative networks which are built based on human memory tasks, and corpus based networks that are based on language use, their similarity to the structure of online information networks is very promising as it enables the analysis of information networks as a proxy for human memory.
In this direction, Griffithset al. (2007) hypothesize that if the knowledge in human memory is orga-nized similarly to the knowledge on the World-Wide-Web, then the retrieval processes solve the same problem: identifying items that are relevant to a query from a large network of interconnected pieces of information. They show that PageRank (Brin and Page, 1998), the web page ranking measure, when ap-plied to words in semantic networks, is correlated with prominence of concepts in human memory (Grif-fiths et al., 2007). This provides us with the intuition that texts that refer to concepts that have high PageRank in semantic networks are easier to understand on a conceptual level.
Grounding our work on those previous findings, we go even further and hypothesize that the back-ground knowledge required during text reading, and which impacts the conceptual complexity of the text, can be estimated by analyzing such networked knowledge resources. However, news articles are well known for their abundance in named entities, therefore semantic networks based on lexical resources cannot cover much of the required background knowledge for news understanding. We address this by focusing on a particular type of semantic networks, specificallyknowledge graphs. Like all semantic networks, knowledge graphs represent human knowledge by means of a network. But while traditional semantic networks represent knowledge starting from use of language, having nodes as words and rela-tions as untyped word associarela-tions, knowledge graphs capture real world concepts and entities, related by facts. We therefore propose a series of measures that leverage the background knowledge graph in order to assess conceptual text complexity.
We focus on a particular knowledge graph that is freely available, DBpedia1, a network representation of Wikipedia. Its purpose is to provide Wikipedia knowledge in a structured, automatically queryable format. At its core lies the DBpedia Ontology (Bizer et al., 2009), which contains more than 4 million entities, structured based on a hierarchy of 685 classes and 2795 properties. The DBpedia entities corre-spond to Wikipedia articles. The entities are connected by relations extracted from the Wikipedia article Infobox sections, resulting in a networked structure.
An important characteristic of DBpedia that renders it particularly suitable for conceptual text com-plexity of informational text such as news, is the fact that, having been created out of Wikipedia’s human created Infoboxes, it covers a very broad range of topics. Moreover, being backed by a very active community of Wikipedia editors, Wikipedia’s set of article entries is very up-to-date, which is another advantage it has over alternative knowledge bases when dealing with news articles. This makes DBpedia very promising for the task of assessing the amount of required background knowledge for informational text understanding.
Knowledge graphs such as DBpedia have been widely and successfully used in a series of language understanding tasks such as computing semantic relatedness / similarity between words (Milne and Wit-ten, 2008; Zhu and Iglesias, 2017), word-sense disambiguation and entity linking (Usbeck et al., 2014; Hulpus¸ et al., 2015), topic/cluster labeling (Hulpus¸ et al., 2013), document similarity (Schuhmacher and Ponzetto, 2014), etc.
In this paper, we propose to use knowledge graphs for automatically assessing conceptual complexity of text. We argue that the amount of required background knowledge can be estimated by analyzing the parts of knowledge graph that are activated by the text.
3 Easy-to-read Texts
Many initiatives have proposed guidelines for producing plain, easy to read text, which would be more accessible to wider audiences. The “Federal Plain Language Guidelines”2 instruct how to write gov-ernmental documents for the general public. “Make it Simple” guidelines (Freyhoff et al., 1998) assist writers in producing texts for people with intellectual disabilities and other people who cannot read complex texts. These guidelines were proven to improve efficiency (search and reading time) and effec-tiveness (comprehension scores) in both intellectually disabled people, and the control group (Karreman et al., 2007). Some of the main advises, that appear in all guidelines are: (1) omit unnecessary words; (2) cover only one main idea per sentence; (3) avoid abstract concepts; (4) and avoid definitions as much as possible by removing or replacing a complicated concept, unless the concept is crucial for document understanding.
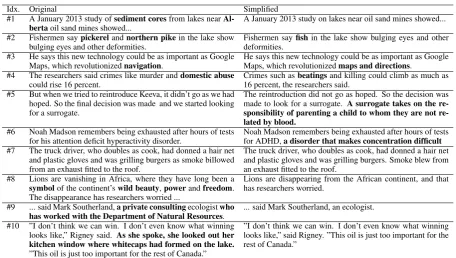
Ideas from such guidelines are also incorporated in instructions for manual simplification of al-ready existing texts for autistic readers (Orasan et al., 2013), people with Down syndrome (Saggion et al., 2011), or language learners (Newsela, 2016). Several examples of such simplifications found in Newsela’s articles are presented in Table 1.
We notice that the above mentioned text requirements resonate with structural properties of knowledge graphs-based representations of text. This motivates the graph-based measures proposed in the next section for assessing text conceptual complexity.
4 Graph-Based Features for Capturing Conceptual Complexity
In our aim for devising features for measuring conceptual complexity, an important objective is to make them independent of syntactical and lexical complexity measures. For instance, one indicator of syntac-tical complexity is the length of sentences. The length of a sentence influences the number of concepts in the sentence. Therefore, we suggest only measures that are not influenced by the number of concepts in the sentence.
With respect to lexical complexity, the use of an entity linker (see Section 5.2), ensures that purely lexical transformations, that for instance replace a less common word with a more common synonym (e.g. murder → killing, in example #4 in Table 1) are not captured by our measures (as they link to the same entity3). In contrast, the conceptual simplification in which a concept is replaced with a more common and more general concept (e.g.domestic abuse→beating, in example #4 in Table 1) is captured by our features, as those two words link to different concepts in DBpedia.4
We explore three types of graph-based measures, each focusing on capturing different particularities of conceptual complexity.
4.1 Single Node Measures
The first type of graph measures that we analyze refers to single concepts.5 These measures target three types of transformations that occur during simplification: (i) removal of non-essential concepts that demand more background knowledge (example #1in Table 1), (ii) replacement of non-essential
2http://www.plainlanguage.gov 3
http://dbpedia.org/resource/Murder
4
http://dbpedia.org/resource/Domestic violence and http://dbpedia.org/page/Strike (attack)
Idx. Original Simplified #1 A January 2013 study ofsediment coresfrom lakes near
Al-bertaoil sand mines showed...
A January 2013 study on lakes near oil sand mines showed...
#2 Fishermen saypickerelandnorthern pikein the lake show bulging eyes and other deformities.
Fishermen sayfishin the lake show bulging eyes and other deformities.
#3 He says this new technology could be as important as Google Maps, which revolutionizednavigation.
He says this new technology could be as important as Google Maps, which revolutionizedmaps and directions.
#4 The researchers said crimes like murder anddomestic abuse could rise 16 percent.
Crimes such asbeatingsand killing could climb as much as 16 percent, the researchers said.
#5 But when we tried to reintroduce Keeva, it didn’t go as we had hoped. So the final decision was made and we started looking for a surrogate.
The reintroduction did not go as hoped. So the decision was made to look for a surrogate. A surrogate takes on the sponsibility of parenting a child to whom they are not re-lated by blood.
#6 Noah Madson remembers being exhausted after hours of tests for his attention deficit hyperactivity disorder.
Noah Madson remembers being exhausted after hours of tests for ADHD,a disorder that makes concentration difficult #7 The truck driver, who doubles as cook, had donned a hair net
and plastic gloves and was grilling burgers as smoke billowed from an exhaust fitted to the roof.
The truck driver, who doubles as cook, had donned a hair net and plastic gloves and was grilling burgers. Smoke blew from an exhaust fitted to the roof.
#8 Lions are vanishing in Africa, where they have long been a symbolof the continent’swild beauty,powerandfreedom. The disappearance has researchers worried ...
Lions are disappearing from the African continent, and that has researchers worried.
#9 ... said Mark Southerland,a private consultingecologistwho has worked with the Department of Natural Resources.
... said Mark Southerland, an ecologist.
#10 ”I don’t think we can win. I don’t even know what winning looks like,” Rigney said. As she spoke, she looked out her kitchen window where whitecaps had formed on the lake. ”This oil is just too important for the rest of Canada.”
[image:4.595.72.529.59.317.2]”I don’t think we can win. I don’t even know what winning looks like,” said Rigney. ”This oil is just too important for the rest of Canada.”
Table 1: Examples of original and simplified text snippets (Newsela, 2016)
demanding concepts with more commonly known ones (examples#2,#3and#4in Table 1), and (iii) avoidance of abstract concepts (example#8).
We claim that these edits lead to nodes with different graph properties being favored in simplified texts. There are multiple node properties that come to mind, but we chose to focus on a few most commonly used ones in the network analysis literature.
Node degree is one of the most straightforward measures that describe the popularity of a concept in a network. In knowledge graphs, this translates to the number of concepts that have a direct relation to the concept in question. When referring to the node degree, we consider both incoming and outgoing edges. Under the assumption that the concepts with high degree are more commonly known, our hypothesis is thatwhen texts are simplified, the high degree nodes are kept, while the lower degree nodes might be omitted, resulting in a higher average node degree in simplified texts (H1).
Node clustering coefficient computes how many of the node’s neighbors are directly connected among themselves. Therefore, ifDis the number of neighbors of a node (equal to its degree), then the clus-tering coefficient is computed as 2×#related neighborsD(D−1) The nodes with a low clustering coefficient can be assumed to be more general, since their neighbors tend to be unrelated. Our hypothesis is thatsimpler texts tend to favor nodes with low clustering coefficient (H2).
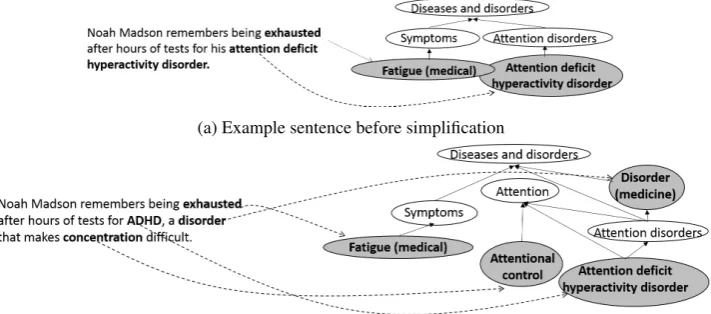
(a) Example sentence before simplification
[image:5.595.123.479.65.222.2](b) Example sentence after simplification
Figure 1: Example of simplification through explicitly defining complex but crucial concepts. The sim-plification leads to a reduced average pairwise shortest path length between the text concepts. The graphs shown in this illustration are drastically reduced, as the complete graphs would be much too complex for visual analysis.
4.2 Pairwise Measures
Besides the properties of the individual entities found in texts, we find it of interest to understand how the entities found within the same sentence or paragraph relate to each other, therefore capturing the microstructureof conceptual complexity. We expect that in simpler texts, as a result of the simplification process, the concepts that occur in the same sentence/paragraph are more semantically related.
One transformation that is targeted by these measures is that of adding definitions to difficult but essential concepts (examples#5and#6in Table 1). The intuition is that when definitions are provided, these explanations usually contain terms that are strongly related to the term they define, increasing the overall relatedness of the simplified text segment.
Another transformation targeted by the pairwise similarity measures is the sentence splitting, that follows the “one main idea per sentence” principle (see Section 3). Each newly formed sentence has a reduced scope, referring to closely related concepts. This is illustrated in the example #7in Table 1. The original sentence was split so that the smoke topic is mentioned in its own sentence. As a result, the newly formed sentence maintains the particularly high relatedness between its conceptssmokeand exhaust, while separating these concepts from the ones they are not related to such asdriver, cook, hair net, gloves, burger.
To study those phenomena, we extract the following two measures.
Length of the shortest path is a straightforward measure that we expect to be negatively correlated to two entities’ semantic relatedness. When we refer to the paths in the knowledge graph, we consider them undirected. Given a text segment, we compute the length of the shortest path in the knowledge graph between all pairs of entities found in it, and hypothesize thatin a simpler text, the average shortest path lengths between concepts occurring in the same sentence or paragraph tend to be shorter than in conceptually more complex texts (H4).Figures 1a and 1b visualize the paths between the main concepts extracted from example#6. As shown, by adding a short definition, the average length of shortest path between seed nodes (concepts referred to by the text) becomes shorter: from4.00in Figure 1a, to3.16
in Figure 1b.
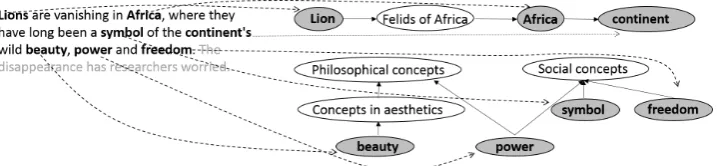
relat-(a) An original sentence (Newsela, 2016) producing a graph with two disconnected components.
[image:6.595.123.482.63.146.2](b) A simplified sentence (Newsela, 2016) with an entire graph connected component removed.
Figure 2: Example of simplification that leads to removal of a connected component from the text seg-ment graph. The graphs shown in this illustration are drastically reduced, as the complete graphs would be much too complex for visual analysis.
edness between two nodes is revealed by more paths between them, not just the shortest path, but the weights of paths are governed by alength decayparameter. Using this semantic relatedness measure, our hypothesis is thatthe pairwise semantic relatedness between concepts that occur in the same sentence or paragraph tends to be higher in simpler texts (H5).
4.3 Global Properties of the Graph
The last type of properties of the text segments that we compute over the knowledge graph, refers to the global properties of the graph which is formed by extracting all the paths, up to a certain length, that connect all the entities of the text segment. The resulting graph is calledtext segment graph. The intuition is that the way all the entities of the text segment are connected, including the connecting entities and relation paths, can provide insights into how complex the text is. These features aim to capture the microstructureof the conceptual complexity of text, as they analyze the graph produced by concepts that occur in the same sentence/paragraph.
They target similar transformations as the pairwise measures, as well as the removal of abstract con-cepts and text segments that are not essential for following the main story thread (examples #8, #9, and#10). The graphs that the removed concepts produce are usually disconnected from, or very weakly connected to, the concepts of the main story. Their removal thus results in a more tightly connected graph corresponding to the simplified text. This phenomenon is illustrated in Figures 2a and 2b, using the example#8in Table 1. We assess the connectivity of the graph by extracting three features.
Number of connected components is the number of groups of interconnected nodes, such that paths exist between all pairs of nodes within the groups, but no paths exists between the nodes in different groups. Multiple connected components usually appear when the text segment deals with very distinct topics resulting in a higher cognitive load on the readers, since they must keep in memory all these dis-connected topics simultaneously. For example, the original text in Figure 2a contains two components, and the simplification completely removes one component as seen in Figure 2b. This leads to our hypoth-esis thattexts whose sentences or paragraphs produce graphs that contain more connected components, are conceptually more complex (H6).
Average local clustering coefficient computes the mean clustering coefficient of all the nodes in a graph. We compute this measure on the text segment graph. The intuition is similar to that behind the node’s clustering coefficient. If the nodes of the text segment graph have high clustering coefficients, they might be quite specific, and hence uncommon. We hypothesize thus thattext segment graphs with low average clustering coefficient tend to be the result of conceptually simpler texts (H7).
be-tween the same two concepts, when we compute this measure, we do not count the number of effective relations, but the number of related pairs of concepts. The intuition behind using this measure is quite straightforward, since a denser text segment graph can be interpreted as a text in which all concepts are highly related, and accessible from multiple directions. Our hypothesis is therefore thatthe denser the graph of a text segment, the simpler the text (H8).
5 Experimental Setup
5.1 Data
For our experiments, we use the freely available English portion of Newsela language learners cor-pus (Newsela, 2016). Unlike the original Wikipedia and Simple English Wikipedia corcor-pus (Coster and Kauchak, 2011), where the simplified version is not the result of a direct simplification of the original article, the simplified Newsela articles are direct simplifications of the original articles, manually simpli-fied by trained human editors following strict simplification guidelines (Xu et al., 2016). This ensured the quality of simplifications in the Newsela dataset. More importantly, as the target readers are children and second language learners, and each text is provided in five different difficulty levels, conceptual sim-plification is expected to be an important component in the Newsela dataset. Additionally, the Newsela dataset allows us to control for the topic in our experiments, which is particularly important in order to isolate the effect of simplification from the influence of the story topics. Different topics naturally lead to different parts of the knowledge graph being activated, thus affecting graph properties and diluting the actual effect of conceptual simplification that we are trying to capture.
5.2 Implementation Details
Entity Linking. The first prerequisite for analyzing the knowledge graph behind text concepts is that the words in the text are linked to the concepts in the knowledge graph. Multiple systems capable of linking words to knowledge graphs, particularly DBpedia, have been researched and are freely available. In this work, we have chosen to use Kan-Dis (Hulpus¸ et al., 2015) because it links both common nouns and named entities. However, the ideas and measures that make the contribution of this paper do not depend on the linking process, so any linker can be used instead.
Outlier removal. Entity linking must often disambiguate the words, a process that can lead to errors in linking. Mistakes from the entity linking system are capable of affecting our measures, since properties of wrong concepts are then analyzed. To minimize the effects of linking mistakes, we remove from the linked entities those concepts that have a very weak relatedness to the other concepts, under the assumption that this will target particularly wrongly linked concepts. The threshold value chosen for deciding outliers was set empirically to10−6, computed with exclusivity based relatedness. This outlier
removal strategy also makes the analysis less influenced by extreme cases, even if they are correct.
Text Segment Graph Extraction. For the extraction of the text segment graph, we focus on the paths that connect the linked concepts. For all pairs of linked concepts (by the entity linker), we extract all the paths that connect them in the knowledge graph, of length at most four. Most previous work that employs knowledge graphs have converged to the conclusion that a path length of at most four between concepts is sufficient for extracting valuable information about the concepts (Zhu and Iglesias, 2017). Additionally, for all the extracted nodes, we also include in the graph all the direct relations that exist between them.
6 Results
To test our hypotheses (H1–H8), we extract all proposed features on 200 original English Newsela arti-cles and their four manually simplified versions, and examine:
• Whether our features can be used for automatically choosing the conceptually simpler of the two given versions of the same text (Section 6.2).
1 2 3 4
0 +103% +83% +238% +326%
1 +40% +75% +106%
2 +77% +138%
3 +138%
(a) Page Rank
1 2 3 4
0 +124% +103% +327% +431%
1 +45% +86% +120%
2 +86% +150%
3 +150%
(b) Seed Degree
1 2 3 4
0 +5% +8% +3% +2%
1 +2% −3% −4%
2 0% 0%
3 0%
(c) Seed Cl. Coef.
1 2 3 4
0 +1% −1% −3% −4%
1 −1% −3% −4%
2 −1% −2%
3 −2%
(d) Pairwise Distance in Sent.
1 2 3 4
0 +18% +39% +78% +100%
1 +34% +182% +156%
2 +148% +129%
3 +129%
(e) Pairwise SemRel in Sent.
1 2 3 4
0 −1% −6% −13% −17%
1 −2% −8% −14%
2 −4% −9%
3 −9%
(f) Avg Local Cl. Coef. of Sent.
1 2 3 4
0 −1% −2% −4% −6%
1 −1% −3% −6%
2 −2% −4%
3 −4%
(g) Pairwise Distance in Paragraphs
1 2 3 4
0 +15% +38% +80% +122%
1 +28% +62% +106%
2 +35% +68%
3 +68%
(h) Pairwise SemRel in Paragraphs
1 2 3 4
0 +4% +2% −1% −3%
1 +2% 0% −3%
2 +3% −1%
3 −1%
(i) Avg Local Cl. Coef. of Paragraphs
1 2 3 4
0 +25% +42% +51% +59%
1 +24% +30% +38%
2 +13% +17%
3 +17%
(j) Graph Density of Sent.
1 2 3 4
0 −4% −6% −12% −15%
1 −2% −8% −11%
2 −6% −9%
3 −9%
(k) Graph ConnComp of Sent.
1 2 3 4
0 −2% −3% −6% −6%
1 0% −3% −3%
2 −2% −2%
3 −2%
(l) Graph ConnComp of Paragraphs
1 2 3 4
0 +43% +51% +91% +111%
1 +37% +64% +96%
2 +37% +64%
3 +64%
[image:8.595.78.526.108.492.2](m) Graph Density of Paragraphs
Table 2: The average change in the feature value (represented as a percentage of the initial value) for each pair of Newsela complexity levels (the original stories belong to the level 0, while the simplest versions belong to the level 4). The cases in which the mean value of the feature was significantly (at a 0.01 level of significance) different (Wilcoxon’s signed rank test for paired samples in SPSS) in the two corresponding levels are presented in bold.
6.1 Pairwise Comparison of Texts on Different Complexity Levels
The goal of this analysis is to explore the discriminative power of our features to distinguish across different versions of the same text. For each two versions of the same story, we compute the average change in feature value (as a percentage of the feature value in initial/more complex text). The results are presented in Table 2, where each cell(m, n)corresponds to the change in feature value when simplifying from the complexity level m to the complexity level n. Those cases in which the mean value of the feature is significantly different (at a 0.01 level of significance, measured by Wilcoxon’s test for repeated measures) in the corresponding two levels are presented in bold.
of the Newsela texts, when computed over DBpedia graph, resides especially in the way the concepts relate to one another (microstructure), rather than in the particular properties of the concepts taken one by one (macrostructure). As expected, the differences are significant especially between the far away levels such as 0-3, 0-4, 1-3 and 1-4, while many measures have a problem to discriminate between the nearby levels, particularly the levels 3-4.6
Single node measures. Among the single node measures, the hypothesis H1 and H3 have been proven correct for the distant level pairs, showing the biggest discriminative power for the seed degree (H1) followed by the PageRank (H3). Nevertheless, none of the measures can capture the subtle differences between the nearby levels. This is to be expected since during the simplification of texts the omission or replacement of concepts are measures to be taken very cautiously as the original meaning of the texts should not be noticeably altered. A too abrupt change in this set of measures would rather be indicative of flawed simplification. Regarding the clustering coefficient of the seeds (H2), no trend can be established.
Pairwise graph-based measures. The pairwise graph-based measures perform similarly on both sen-tences and paragraphs, and are good at distinguishing between any two text complexity levels. Both hypotheses H4 and H5 have been proven to hold.
Global graph-based measures. Regarding the global graph-based measures, we notice that in gen-eral, all three measures perform better when computed over sentences than over paragraphs. Computed over sentences, these measures are able to discriminate between the nearby levels, while computed over paragraphs, this does not always hold. This might be due to the fact that, in general, the grouping of the concepts over sentences changes during simplification, but their grouping over paragraphs does not. The global graph-based measure that shows the best discriminative power between each two text com-plexity levels is the number of connected components of the sentence graph, followed closely by the average local clustering coefficient of the sentence graph. Our hypotheses related to global-graph based measures (H6, H7, and H8) have been proven to hold, except H7 (concerned with the average clustering coefficient) over paragraphs, which only holds for the faraway complexity levels.
This analysis has allowed us to draw conclusions as to how sensitive the proposed measures are to the complexity level of texts. Given the very promising results, in the next section we analyze how these measures perform in a pairwise text classification task.
6.2 Classification Experiments
We perform the pairwise comparison of each two documents corresponding to the same story to assign the label “simpler” if the first document is simpler than the second, and “more complex” if otherwise.
Features. For this binary classification task, each instance has 26 features, obtained by concatenating 13 features of the second text to the 13 features of the first text. Additionally, for each document, we compute a baseline feature as the ratio of unique entities over mentions. On purpose, we avoid using any features which are influenced by the length of the text segment (sentence, paragraph, or entire text). We do so as we are only interested in discriminating texts according to their conceptual complexity, and features that reflect syntactic complexity (i.e. any features that include text segment length) could blur the results.
Dataset. We construct the dataset by pairing texts with the same title and different Newsela complexity level. As we have 200 titles in our collection, that results in a total of 2000 instances (ten for each title, i.e. levels 0-1, 0-2, 0-3, 0-4, 1-2, 1-3, 1-4, 2-3, 2-4, 3-4). To have balanced classes, we randomize the order of the two texts in each pair. This resulted in having 1025 instances in which the first text is simpler than the second, and 975 instances in which the first text is more complex than the second (according to their Newsela complexity levels).
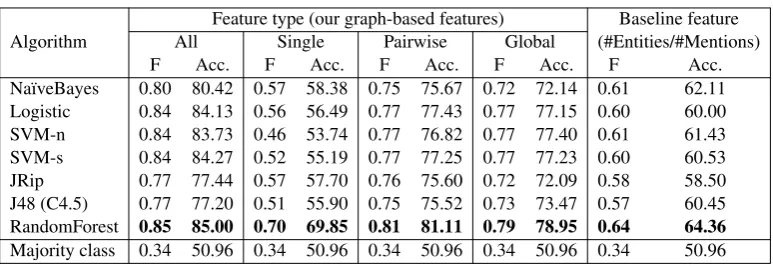
Algorithm
Feature type (our graph-based features) Baseline feature All Single Pairwise Global (#Entities/#Mentions) F Acc. F Acc. F Acc. F Acc. F Acc. Na¨ıveBayes 0.80 80.42 0.57 58.38 0.75 75.67 0.72 72.14 0.61 62.11 Logistic 0.84 84.13 0.56 56.49 0.77 77.43 0.77 77.15 0.60 60.00 SVM-n 0.84 83.73 0.46 53.74 0.77 76.82 0.77 77.40 0.61 61.43 SVM-s 0.84 84.27 0.52 55.19 0.77 77.25 0.77 77.23 0.60 60.53 JRip 0.77 77.44 0.57 57.70 0.76 75.60 0.72 72.09 0.58 58.50 J48 (C4.5) 0.77 77.20 0.51 55.90 0.75 75.52 0.73 73.47 0.57 60.45 RandomForest 0.85 85.00 0.70 69.85 0.81 81.11 0.79 78.95 0.64 64.36
Majority class 0.34 50.96 0.34 50.96 0.34 50.96 0.34 50.96 0.34 50.96
Table 3: The weighted F-measure (F) and accuracy (Acc.) for the binary classification task (10-fold cross-validation with 10 repetitions). The best results for each set of features are presented in bold. All classifiers significantly (paired t-test) outperform the majority class baseline.
Algorithms. Our goal is to demonstrate that our feature set has good predictive power in such tasks, and not to build the highest performing classification system. Therefore, we experiment with a range of classification algorithms, and use them in their default parameter setup (without any tuning). We use a ten-fold cross-validation setup with ten repetitions in Weka Experimenter (Hall et al., 2009) to train and test seven classification algorithms: Na¨ıve Bayes (John and Langley, 1995), Logistic (le Cessie and van Houwelingen, 1992), Support Vector Machines (Keerthi et al., 2001) with normalisation (SVM-n) or standardisation (SVM-s), JRip rule learner (Cohen, 1995), J48 - a Weka implementation of the C4.5 decision tree (Quinlan, 1993), and Random Forest (Breiman, 2001).
Results. The results of this set of experiments are presented in Table 3. As can be seen, even without any parameter tuning or feature selection, our set of 13 graph-based conceptual complexity features lead to high performances, both in terms of the weighted F-measure and the accuracy, always significantly (paired t-test at a 0.01 level of significance) outperforming the baseline feature. We also observe that the single node features (Single) perform significantly (paired t-test at 0.01 level of significance) worse than the full set of features, or even any of the other two subsets of features (Pairwise and Global).
7 Conclusion
Text complexity plays an important role in text accessibility. Apart from the usually addressed lexical and syntactic complexity, recent studies emphasize the importance of conceptual complexity, both on micro- and macrostructural levels. Building up on those findings, we set up a new task of automatic assessment of conceptual complexity.
We proposed to measure conceptual complexity by leveraging the structure of knowledge graphs such as DBpedia. We found that properties of individual concepts, as well as the way concepts relate to each other in the graph, successfully capture the conceptual complexity of text. Furthermore, our experiments show that our graph-based measures perform well when used as features in a binary classification task for automatically choosing the simpler of two versions of the same text.
Our research sets a new field and benchmarks the task of automatic assessment of conceptual text complexity. It also shows that knowledge graphs can successfully be used for this task, thus combining recent advances across multiple research areas.
In our future work, we plan to analyze the impact of the entity linking step over the proposed measures, as well as to extend our analysis to other knowledge graphs such as ConceptNet7 and WikiData8. We also plan to explore additional measures for computing conceptual complexity, as well as measures for scoring the relevance of background knowledge facts with respect to making a given text more or less complex. This would naturally lead to methods for extraction of knowledge base facts that would help users understand complex texts.
7
http://conceptnet.io/
[image:10.595.106.493.59.192.2]References
Sandra Maria Alu´ısio and Caroline Gasperin. 2010. Fostering digital inclusion and accessibility: The porsimples project for simplification of portuguese texts. In Proceedings of YIWCALA Workshop at NAACL HLT 2010, pages 46–53.
Bharat Ram Ambati, Siva Reddy, and Mark Steedman. 2016. Assessing Relative Sentence Complexity using an Incremental CCG Parser. InProceedings of NAACL-HLT, pages 1051–1057.
Barbara Arf´e, Lucia Mason, and Inmaculada Fajardo. 2017. Simplifying informational text structure for struggling readers. Reading and Writing, Oct.
Christian Bizer, Jens Lehmann, Georgi Kobilarov, Sren Auer, Christian Becker, Richard Cyganiak, and Sebastian Hellmann. 2009. Dbpedia - a crystallization point for the web of data. Web Semantics: Science, Services and Agents on the World Wide Web, 7(3):154 – 165. The Web of Data.
Javier Borge-Holthoefer and Alex Arenas. 2010. Semantic networks: Structure and dynamics. Entropy, 12(5):1264–1302.
Leo Breiman. 2001. Random Forests.Machine Learning, 45(1):5–32.
Sergey Brin and Lawrence Page. 1998. The anatomy of a large-scale hypertextual web search engine. In Proceed-ings of the Seventh International Conference on World Wide Web 7, WWW7, pages 107–117, Amsterdam, The Netherlands, The Netherlands. Elsevier Science Publishers B. V.
John Carroll, Guido Minnen, Yvonne Canning, Siobhan Devlin, and John Tait. 1998. Practical Simplification of English Newspaper Text to Assist Aphasic Readers. In Proceedings of AAAI-98 Workshop on Integrating Artificial Intelligence and Assistive Technology, pages 7–10.
William W. Cohen. 1995. Fast Effective Rule Induction. InProceedings of the Twelfth International Conference on Machine Learning, pages 115–123.
Allan M. Collins and M. Ross Quillian. 1969. Retrieval time from semantic memory.Journal of Verbal Learning and Verbal Behavior, 8(2):240 – 247.
William Coster and David Kauchak. 2011. Simple English Wikipedia: a new text simplification task. In Proceed-ings of ACL&HLT, pages 665–669.
Carolyn A. Denton, Mischa Enos, Mary J. York, David J. Francis, Marcia A. Barnes, Paulina A. Kulesz, Jack M. Fletcher, and Suzanne Carter. 2015. Text-processing differences in adolescent adequate and poor compre-henders reading accessible and challenging narrative and informational text. Reading Research Quarterly, 50(4):393–416.
Geert Freyhoff, Gerhard Hess, Linda Kerr, Bror Tronbacke, and Kathy Van Der Veken, 1998.Make it Simple, Eu-ropean Guidelines for the Production of Easy-toRead Information for People with Learning Disability. ILSMH European Association, Brussels.
Thomas L. Griffiths, Mark Steyvers, and Alana Firl. 2007. Google and the mind: Predicting fluency with pagerank.
Psychological Science, 18(12):1069–1076. PMID: 18031414.
Mark Hall, Eibe Frank, Geoffrey Holmes, Bernhard Pfahringer, Peter Reutemann, and Ian H. Witten. 2009. The weka data mining software: an update. SIGKDD Explor. Newsl., 11:10–18.
Ioana Hulpus¸, Conor Hayes, Marcel Karnstedt, and Derek Greene. 2013. Unsupervised graph-based topic la-belling using dbpedia. In Proceedings of the Sixth ACM International Conference on Web Search and Data Mining, WSDM ’13, pages 465–474, New York, NY, USA. ACM.
Ioana Hulpus¸, Narumol Prangnawarat, and Conor Hayes. 2015. Path-based semantic relatedness on linked data and its use to word and entity disambiguation. InThe Semantic Web - ISWC 2015, pages 442–457, Cham. Springer International Publishing.
Mario Jarmasz and Stan Szpakowicz. 2012. Roget’s thesaurus and semantic similarity. CoRR, abs/1204.0245.
George. H. John and Pat Langley. 1995. Estimating Continuous Distributions in Bayesian Classifiers. In Proceed-ings of the Eleventh Conference on Uncertainty in Artificial Intelligence, pages 338–345.
Sathiya. S. Keerthi, Shirish. K. Shevade, Chiranjib Bhattacharyya, and Krishna R. K. Murthy. 2001. Improvements to Platt’s SMO Algorithm for SVM Classifier Design. Neural Computation, 13(3):637–649.
Walter Kintsch and Teun A. van Dijk. 1978. Towards a model of text comprehension and production. Psycholog-ical Review, 85:363–394.
Saskia le Cessie and Johannes C. van Houwelingen. 1992. Ridge Estimators in Logistic Regression. Applied Statistics, 41(1):191–201.
Danielle S. McNamara, Arthur Graesser, and Max Louwerse, 2012.Sources of text difficulty: Across the ages and genres. Lanham, MD: Rowman & Littlefield Education.
George A. Miller. 1995. Wordnet: A lexical database for english. Commun. ACM, 38(11):39–41, November.
David Milne and Ian H. Witten. 2008. An effective, low-cost measure of semantic relatedness obtained from wikipedia links. InIn Proceedings of AAAI 2008.
Shashi Narayan and Claire Gardent. 2014. Hybrid simplification using deep semantics and machine translation. In Proceedings of the 52nd Annual Meeting of the Association for Computational Linguistics (ACL), pages 435–445.
Douglas L. Nelson, Cathy L. McEvoy, and Thomas A. Schreiber. 2004. The university of south florida free asso-ciation, rhyme, and word fragment norms. Behavior Research Methods, Instruments, & Computers, 36(3):402– 407, Aug.
Newsela. 2016. Newsela article corpus.https://newsela.com/data. Version: 2016-01-29.
Constantin Orasan, Richard Evans, and Iustin Dornescu, 2013. Towards Multilingual Europe 2020: A Romanian Perspective, chapter Text Simplification for People with Autistic Spectrum Disorders, pages 287–312. Roma-nian Academy Publishing House, Bucharest.
Ross Quinlan. 1993.C4.5: Programs for Machine Learning. Morgan Kaufmann Publishers, San Mateo, CA.
Horacio Saggion, Elena G´omez Mart´ınez, Alberto Anula, Lorena Bourg, and Esteban Etayo. 2011. Text Simplifi-cation in Simplext: Making Text More Accessible. Revista de la Sociedad Espa˜nola para el Procesamiento del Lenguaje Natural, 47:341–342.
Michael Schuhmacher and Simone Paolo Ponzetto. 2014. Knowledge-based graph document modeling. In Pro-ceedings of the 7th ACM International Conference on Web Search and Data Mining, WSDM ’14, pages 543– 552, New York, NY, USA. ACM.
Mark Steyvers and Joshua B. Tenenbaum. 2005. The large scale structure of semantic networks: Statistical analyses and a model of semantic growth. Cognitive Science, 29(1):41–78.
Michael Stubbs. 1996. Text and Corpus Analysis: Computer Assisted Studies of Language and Culture.
Ricardo Usbeck, Axel-Cyrille Ngonga Ngomo, Michael R¨oder, Daniel Gerber, Sandro Athaide Coelho, S¨oren Auer, and Andreas Both. 2014. Agdistis - graph-based disambiguation of named entities using linked data. In Peter Mika, Tania Tudorache, Abraham Bernstein, Chris Welty, Craig Knoblock, Denny Vrandeˇci´c, Paul Groth, Natasha Noy, Krzysztof Janowicz, and Carole Goble, editors,The Semantic Web – ISWC 2014, pages 457–471, Cham. Springer International Publishing.
Sowmya Vajjala and Detmar Meurers. 2014. Assessing the relative reading level of sentence pairs for text simpli-fication. InProceedings of the EACL 2014, pages 288–297.
Sowmya Vajjala and Detmar Meurers. 2015. Readability-based Sentence Ranking for Evaluating Text Simplifica-tion. Unpublished technical report, arXiv:1603.06009 [cs.CL].
Sanja ˇStajner and Goran Glavaˇs. 2017. Leveraging event-based semantics for automated text simplification.
Expert Systems With Applications, Elsevier, 82:383–395.
Wei Xu, Courtney Napoles, Ellie Pavlick, Quanze Chen, and Chris Callison-Burch. 2016. Optimizing statistical machine translation for text simplification. Transactions of the Association for Computational Linguistics, 4:401–415.
Ganggao Zhu and Carlos. A. Iglesias. 2017. Computing semantic similarity of concepts in knowledge graphs.