IMPROVED PATTERN EXTRACTION SCHEME FOR CLUSTERING MULTIDIMENSIONAL DATA
AINA MUSDHOLIFAH
IMPROVED PATTERN EXTRACTION SCHEME FOR CLUSTERING MULTIDIMENSIONAL DATA
AINA MUSDHOLIFAH
A thesis submitted in fulfilment of the requirements for the award of the degree of
Doctor of Philosophy (Computer Science)
Faculty of Computing Universiti Teknologi Malaysia
iii
DEDICATION
iv
ACKNOWLEDGEMENTS
In preparing this thesis, I was in contact with many people, researchers, and
academicians. They have contributed towards my understanding and thoughts. In
particular, I wish to express my sincere appreciation to my main thesis supervisor,
PM. Dr. Siti Zaiton Mohd Hashim, for encouragement, guidance, and critics.
I am also indebted to Ministry of Science and Technology of Malaysia
(MOSTI) and Universiti Teknologi Malaysia (UTM) for funding my Ph.D. study.
Universitas Gadjah Mada (UGM) also deserves special thanks for generous support
of my Ph.D. study.
My fellow Indonesian Students should also be recognized for their support.
My sincere appreciation also extends to all my sisters, colleagues and others who
have provided assistance at various occasions. Their views and tips are useful indeed.
Unfortunately, it is not possible to list all of them in this limited space. I am grateful
v
ABSTRACT
Multidimensional data refers to data that contains at least three attributes or dimensions. The availability of huge amount of multidimensional data that has been collected over the years has greatly challenged the ability to digest the data and to gain useful knowledge that would otherwise be lost. Clustering technique has enabled the manipulation of this knowledge to gain an interesting pattern analysis that could benefit the relevant parties. In this study, three crucial challenges in extracting the pattern of the multidimensional data are highlighted: the dimension of huge multidimensional data requires efficient exploration method for the pattern extraction, the need for better mechanisms to test and validate clustering results and the need for more informative visualization to interpret the “best” clusters. Density-based clustering algorithms such as density-Density-based spatial clustering application with noise (DBSCAN), density clustering (DENCLUE) and kernel fuzzy C-means (KFCM) that use probabilistic similarity function have been introduced by previous works to determine the number of clusters automatically. However, they have difficulties in dealing with clusters of different densities, shapes and size. In addition, they require many parameter inputs that are difficult to determine. Kernel-nearest-neighbor (KNN)-density-based clustering including kernel-nearest-Kernel-nearest-neighbor-based clustering (KNNClust) has been proposed to solve the problems of determining smoothing parameters for multidimensional data and to discover cluster with arbitrary shape and densities. However, KNNClust faces problem on clustering data with different size. Therefore, this research proposed a new pattern extraction scheme integrating triangular kernel function and local average density technique called TKC to improve KNN-density-based clustering algorithm. The improved scheme has been validated experimentally with two scenarios: using real multidimensional spatio-temporal data and using various classification datasets. Four
different measurements were used to validate the clustering results; Dunn and
Silhouette index to assess the quality, F-measure to evaluate the performance of approach in terms of accuracy, ANOVA test to analyze the cluster distribution, and processing time to measure the efficiency. The proposed scheme was benchmarked with other well-known clustering methods including KNNClust, Iterative Local
Gaussian Clustering (ILGC), basic k-means, KFCM, DBSCAN and DENCLUE. The
results on the classification dataset demonstrated that TKC produced clusters with higher accuracy and more efficient than other clustering methods. In addition, the analysis of the results showed that the proposed TKC scheme is capable of handling
multidimensional data, validated by Silhouette and Dunn index which was close to
vi
ABSTRAK
Data multidimensi merujuk kepada data yang mengandungi sekurang-kurangnya tiga atribut atau dimensi. Dengan adanya sejumlah besar data multidimensi yang telah dikumpul sejak bertahun-tahun, keupayaan mencerna data dan mendapatkan pengetahuan yang berguna semakin mencabar. Teknik penggugusan membolehkan proses manipulasi pengetahuan ini membolehkan analisis pola menarik yang boleh memberi manfaat kepada pihak yang berkenaan. Dalam kajian ini, tiga cabaran penting dalam mengekstrak pola data multidimensi diketengahkan: dimensi data multidimensi yang besar yang memerlukan kaedah penjelajahan yang cekap sebagai kaedah pengeluaran pola, keperluan bagi mekanisme yang lebih baik untuk menguji dan mengesahkan hasil penggugusan dan keperluan visualisasi yang lebih bermaklumat bagi mentafsir gugusan "terbaik". Algoritma penggugusan berasaskan kepadatan seperti penggugusan ruang dengan hingar berasas kepadatan (DBSCAN), penggugusan kepadatan (DENCLUE) dan
kernel fuzzyC-means (KFCM) yang menggunakan fungsi persamaan kebarangkalian
telah diperkenalkan oleh kajian terdahulu untuk menentukan bilangan gugusan secara automatik. Walau bagaimanapun, masalah timbul apabila berhadapan dengan gugusan yang berbeza kepadatan, bentuk dan saiz. Di samping itu, algoritma-algoritma ini memerlukan banyak input parameter yang sukar untuk ditentukan. Penggugusan berasaskan kepadatan kernel jiran terdekat (KNN) termasuk penggugusan berasas kernel-jiran-terdekat (KNNClust) telah dicadangkan untuk menyelesaikan masalah dalam menentukan parameter pelicinan bagi data multidimensi dan menemui gugusan dengan bentuk dan kepadatan yang sembarangan. Walau bagaimanapun, KNNClust berhadapan dengan masalah bagi data yang mengandungi gugusan yang mempunyai saiz berbeza. Oleh itu, penyelidikan ini mencadangkan satu skema baru pengekstrakan pola yang mengintegtrasi fungsi kernel segi tiga dan kaedah kepadatan purata tempatan dinamakan TKC untuk memperbaiki algoritma penggugusan berasaskan kepadatan KNN. Pembaikan skema telah disahkan melalui eksperimen dengan dua senario: menggunakan data ruang-masa multidimensi sebenar dan menggunakan pelbagai data pengelasan. Empat ukuran berbeza digunakan untuk mengesahkan hasil
penggugusan; indeks Dunn dan Silhouette untuk menilai kualiti, F-measure untuk
menilai prestasi pendekatan dari segi ketepatan, ujian ANOVA untuk menganalisis taburan gugusan, dan masa pemprosesan untuk mengukur kecekapan. Skema yang dicadangkan diaras tanda dengan kaedah penggugusan lain yang terkenal termasuk
KNNClust, penggugusan Gaussian tempatan lelaran (ILGC), asas k-means, KFCM,
DBSCAN dan DENCLUE. Hasil bagi data pengelasan menunjukkan bahawa TKC menghasilkan gugusan dengan ketepatan yang lebih tinggi dan lebih berkesan daripada kaedah penggugusan lain. Di samping itu, hasil analisis menunjukkan bahawa skema TKC yang dicadangkan telah mampu menangani data multidimensi,
disahkan dengan indeks Dunn dan Silhouette yang hampir dengan nilai satu,
TABLE OF CONTENTS
CHAPTER TITLE PAGE
DECLARATION ii
DEDICATION iii
ACKNOWLEDGEMENTS iv
ABSTRACT v
ABSTRAK vi
TABLE OFCONTENTS vii
LIST OF TABLES x
LIST OF FIGURES xii
LIST OF ABBREVIATION xv
LIST OF APPENDICES xvi
1 INTRODUCTION 1
1.1 Overview 1
1.2 Problem Background 4
1.3 Problem Statement 8
1.4 Research Goal 8
1.5 Research Objectives 9
1.6 Research Scopes 9
1.7 Research Road Map 10
1.8 Importance of Research 11
1.9 Organization of Thesis 12
2 LITERATURE REVIEW 14
2.1. Introduction 14
viii
2.3. Pattern Extraction of Multidimensional Data 20
2.3.1. Data Mining Functionalities 21
2.3.2. Type of Data Attributes in Data Mining 22
2.4. Clustering for Pattern Extraction of Multidimensional
Data 24
2.4.1. Clustering Algorithm 25
2.4.1.1. Hierarchical Clustering 28
2.4.1.2. Non-hierarchical (Partitioning) Clustering 29
2.4.1.3. Density-based clustering 31
2.4.1.4. K-Nearest-Neighbor Density
Estimation-based Clustering 37
2.4.1.5. Kernel Density Estimation-based
Clustering 40
2.4.1.6. kNN-Kernel Density Estimation-based
Clustering 43
2.4.2. Challenges of Clustering Multidimensional Data 44
2.4.3. Preprocessing of clustering 46
2.4.4. Clustering Validation 52
2.4.5. Cluster Interpretation 62
2.4.5.1. Scatter-Principal Component Analysis
(Scatter-PCA) 64
2.4.5.2. Parallel Coordinates Plot (PCP) 68
2.4.5.3. Cartographic Map 70
2.5. Summary 71
3 RESEARCH METHODOLOGY 74
3.1. Introduction 74
3.2. Research Design 76
3.3. Experimental Design 77
3.4. Clustering using Triangular Kernel Clustering 95
3.5. Data of Experiment 96
3.5.1 Dummy Dataset 97
3.5.2 UCI Dataset 102
ix
3.5.3.1. Crime Dataset 103
3.5.3.2. Fatal Crash Dataset 106
3.5.3.3. Spatio-Temporal Data Representation 109
3.6. Summary 116
4 PROPOSED PATTERN EXTRACTION SCHEME
USING TRIANGULAR KERNEL CLUSTERING 117
4.1. Challenges of Density-based Clustering 117
4.2. Triangular Kernel Function for clustering 119
4.3. Local Average Density 121
4.4. Improved Triangular Kernel Clustering Scheme
(TKC) 122
4.5. Algorithm of TKC 126
4.6. Experimental Result of Discovering True Clusters on
Labeled Data 127
4.6.1 Result and Analysis of Experiment on Dummy
Dataset 128
4.6.2 Result and analysis of experiment on UCI dataset 138
4.7. Experimental Result of Discovering Spatio-Temporal
Clusters 152
4.7.1 Experiment on Crime data 152
4.7.2 Experiment on Crash data 173
4.8. Summary 193
5 CONCLUSION AND FUTURE WORKS 196
5.1 Thesis Summary 196
5.2 Research Findings and Contributions 198
5.3 Future Works 199
REFERENCES 202
LIST OF TABLES
TABLE NO TITLE PAGE
1.1 Related works 6
2.1 Univariate kernel function (Tran et al., 2006) 37
2.2 Raw table of crime data 49
2.3 Descriptive statistic of number of burglary, number of
larceny, number of mvtheft and number of robbery in two
crime clusters 60
2.4 A one-way ANOVA analysis of two crime cluster 61
2.5 A Tukey post-hoc test of two crime clusters 61
3.1 Three schemes experiment 83
3.2 Purposes and approaches of experiments 3 on clustering
spatio-temporal data 87
3.4 Characteristics of dummy datasets used 98
3.5 Data characteristics of four UCI datasets used 103
3.6 The Distribution of precinct, beat plus and beat of
Pittsburgh 106
3.7 The example of the crash data 109
4.1 Parameters of all algorithms used to discover true clusters
on the nine dummy data 129
4.2 Percentage of F-measure for the experiment results of all
algorithms on the dummy datasets 135
4.3 Parameters of all algorithms used to discover true clusters
on the four UCI datasets 139
4.4 Percentage of F-measure for the experiment result of all
xi
4.5 One-way ANOVA analysis of three classes on Iris data 143
4.6 One-way ANOVA analysis of three clusters on Iris data 144
4.7 One-way ANOVA analysis of four clusters on Wine data 146
4.8 One-way ANOVA analysis of four clusters on Glass data 149
4.9 One-way ANOVA analysis of eight clusters on Ecoli data 151
4.10 Descriptive statistics of month years in the two clusters of
burglary crime 157
4.11 One-way ANOVA analysis of two clusters within burglary
crime data 158
4.12 Tukey post-hoc of variables on burglar crime data 159
4.13 The Distribution of precinct, beat plus and beat of
Pittsburgh 161
4.14 The means and the pattern names of two clusters within
burglary crime data 163
4.15 Comparison of clustering results of experiment 3 on
burglary crime data 164
4.16 Description of each cluster produced by TKC algorithm for
cluster I 171
4.17 Description of each cluster produced by TKC algorithm for
cluster II 173
4.19 One-way ANOVA analysis of two clusters within fatal
accident data 178
4.20 Tukey post-hoc of variables on fatal accident data 179
4. 21 Means and the pattern names of two clusters within fatal
accident data 183
4.23 Comparison of clustering results of experiment on fatal
accident data 184
4.24 Description of each cluster found by TKC algorithm for
cluster II 193
xii
LIST OF FIGURES
FIGURE NO TITLE PAGE
1.1 Research Road Map 10
2.1 The changing process of crime event in Pittsburgh 17
2.2 Spatio-temporal data structure 19
2.3 Basic k–means algorithm 30
2.4 Points in DBSCAN algorithm 38
2.5 DBSCAN algorithm (Tan et al., 2006) 39
2.6 DENCLUE algorithm (Hinneburg and Keim, 2003) 42
2.7 Gaussian density estimate plot for each variable in iris data 51
2.8 Scatter plot for iris data 52
2.9 Illustration of component of silhouette index. 55
2.10 Scatter-PCA approach to visualize clustering results 68
2.11 Parallel coordinates plot (Yuan et al., 2009) 70
3.1 Research design 77
3.2 Experimental Setting 78
3.3 An example of clustering results 82
3.4 Design of experiment 1 on the dummy datasets 84
3.5 Design of experiment 2 on the UCI datasets 86
3.6 Design of experiment 3 on single non-spatio-temporal
attribute 89
3.7 Design of experiment 3 of PCA-TKC-based clustering
approach 91
3.8 Two approaches of spatio-temporal clustering 94
3.9 KNN-Kernel Density Estimation scheme 96
xiii
3.11 Distribution of eight dummy data 100
3.12 Multidimensional representation of spatio-temporal data 110
3.13 Multidimensional representation of crime data 111
4.1 Improved pattern extraction scheme triangular kernel
clustering (TKC) 122
4.2 Clustering produced by TKC 130
4.3 Clustering results of experiment on the dummy data
produced by TKC 132
4.4 Clusters produced by DBSCAN within Flame data 133
4.5 Comparison of precision of clustering results produced by
TKC, KNNClust, ILGC, DBSCAN, DENCLUE, k-means,
and KFCM 136
4.6 Comparison of recall of clustering result produced by TKC,
KNNClust, ILGC, k-means, and KFCM 137
4.7 Time processing for clustering on benchmarked
classification dataset 141
4.8 Scatter-PCA visualization of Iris data 141
4.9 PCP of four Iris attributes 142
4.10 Scatter-PCA visualization of Wine data 145
4.11 A PCP of 13 Wine attributes 145
4.12 Scatter-PCA visualization of Glass data 147
4.13 A PCP of nine Glass attributes 148
4.14 Scatter-PCA visualization of Ecoli data 150
4.15 A PCP of seven Ecoli attributes 151
4.17 Distribution of clusters on burglary crime data produced by
TKC 160
4.18 A cartographic map of burglary crime data in Pittsburgh. 161
4.19 A PCP of burglary crime attributes 162
4.20 A time series plot of the burglary crime data 164
4.21 Clustering structure on projected property crime data
produced by PCA-TKC 166
4.22 A cartographic map of property crime data in Pittsburgh. 167
xiv
4.24 Dunn index versus number of cluster for the property crime
data using ILGC and TKC. 169
4.25 Silhouette index versus number of cluster for the crime
property data using ILGC and TKC. 170
4.26 The structure of crime property clusters found by LTKC. 170
4.27 Average total number of crime property within each cluster 171
4.28 Single Gaussian scatter diagram for fatal accident data 175
4.29 Scatter-PCA of fatal accident clusters 180
4.30 A cartographic map of fatal accident clusters in USA
obtained by TKC 180
4.31 A cartographic map of fatal accident clusters in USA
obtained by ILGC 181
4.32 A PCP of Fatal accident attributes 182
4.33 A time series plot of the fatal accident data. 183
4.34 Clustering structure on projected fatal crash data produced
by PCA-TKC 187
4.35 A cartographic map of fatal crash data in USA 187
4.36 A time series plot of the fatal crash data 188
4.37 Dunn index versus number of cluster for the fatal crash data
using ILGC and TKC 189
4.38 Silhouette index versus number of cluster for the fatal crash
data using ILGC and TKC. 190
4.39 The structure of fatal crash clusters produced by TKC
algorithms. 190
4.40 Average number of fatal crashes within each cluster. 191
4.41 A PCP of four Iris attributes 195
4.42 A PCP of four Iris attributes with the attributes reordered to
LIST OF ABBREVIATION
TKC - Triangular Kernel Clustering
ILGC - Iterative Local Gaussian Clustering
KNNClust - Kernel-Nearest-Neighbor-based Clustering
DBSCAN - Density Based Spatial Clustering and Application of Noise
DENCLUE - DENsity based CLUstEring
KFCM - Kernel Fuzzy C-Means
LIST OF APPENDICES
APPENDIX TITLE PAGE
A List of publications 214
B Flowchart of other clustering algorithms for comparison
analysis 217
C Experimental results of dummy data sets 219
D SGS diagram of Iris data 225
E Experimental results on UCI datasets 226
F SGS diagram of Burglary crime data 235
G Cartographic map of spatio-temporal clusters 241
CHAPTER 1
INTRODUCTION
1.1 Overview
For decades, large quantity of raw data has been collected from different
application domains, such as business, science, telecommunication and health care
systems. The volume of available data has increased exponentially because of the
extensive use of electronic data gathering devices and technological sophistication
(Golmah and Parvizian, 2010). The increasing volume, variety and velocity of data
available from new digital sources such as social networks and point-of-sale remote
sensing devices; in addition to traditional sources such as sales data and market
research. The data are of course not only to be collected but also are necessary to
analyze the content therein, whether there is useful information hidden in the data or
vice versa. Thus, the difficulty is how to analyze these vast quantities of data to
extract the meaningful insights, and use them effectively to support business purpose
such as improvement of government services, increasing products and advanced
customer experience.
The current data which are commonly stored in the database or data
warehouse and mostly resulted by technology advances in many researchers usually
contains many attributes indeed the single attribute that refers to multidimensional
data (Seo, 2005). Some examples of collected multidimensional data are clinical data
2
video data that stored human motion (Zhou et al., 2013) and UCI data (Frank and
Asuncion, 2010).
A multidimensional data type which has also received much attention is the
spatio-temporal data. This is due to the emergence of new applications, such as
traffic control systems and monitoring systems security conditions of a particular
area that use and capture the multi-dimensional data containing space and time
aspect. Spatial-temporal database that contains time and space aspects is a database
which stores the temporal, spatial and relevant attribute geographic entities (Ping et
al., 2005). The spatial-temporal database was developed with the requirement of
historical information to monitor and analyze changes over time. It specifically deals
with geometry changing over time.
However, the recent advancement in positioning technology and
location-based services has led to the rapid accumulation of multidimensional data (Hsu et al.,
2008). Furthermore, various fields of applications have utilized collected
multidimensional data, not only for storing data but also for the purpose of
supporting decision making. For instance, in security-related application (Townsley
et al., 2000), it is a requirement for the police department to firstly identify the
pattern of crimes offense for formulating more effective preventive strategies.
Another example is, to improve traffic safety, traffic agencies and public at large
need to have knowledge of accident patterns since accidents are not randomly
scattered along the road net (Beshah and Hill, 2010). Therefore, extracting required
patterns from huge amount of multidimensional data is now crucial and an area of
interest to the research (Dermoudy et al., 2009; Tabakov and Duffy, 2010).
Data mining provides a solution to generate compact and rich semantics
representations of raw data, called patterns (Golmah and Parvizian, 2010). Patterns
are compact since they summarize in some degree of the amount of information
contained in the original raw data. Meanwhile, patterns are contently rich in
3
data. Data mining techniques have been applied by many researchers to extract
useful patterns in a wide variety of application, such as planning and scheduling
(Tsumoto et al., 2012), sales and marketing (Lawrence et al., 2001), and finance
(Hadavandi et al., 2010).
However, many data mining tasks differ when applied for different purposes
for different types of data. Clustering is the process of grouping unlabelled large data
sets according to their similarity. Each group, called cluster, consists of objects that
are similar between themselves and dissimilar to objects of other groups. Conversely,
clustering is a powerful exploratory technique for extracting the patterns hidden in
the multidimensional data (Dermoudy et al., 2009).
The general clustering methods have difficulties for analyze the hidden
pattern in the multidimensional data due to the number of dimension which is high
(Hu et al., 2007). The multidimensionality of the data has been challenging to
researchers in many disciplines due to the difficulty in comprehending more than
three dimensions to discover clusters (Sembiring et al., 2011b). This difficulty is so
well recognized that it has a provocative name: “the curse of high dimensionality.”
(Seo, 2005).
In addition, due to the explorative and descriptive nature, intelligible
representation and visualization of the found patterns is essential for the successful
mining process (Ayramo et al., 2009). Visualization methods can be used to help
analysts pick out complex patterns visually, propose explanations and generate
hypotheses for further analysis, and present patterns in an easy-to-understand form
(Guo et al., 2005). Data with huge in size and high in dimension, such as
multidimensional data, are also a big challenge for researchers in the visualization
field, in effort to provide powerful algorithms and tools. Various techniques and
approaches have been recommended to explore the visualization of multidimensional
4
1.2 Problem Background
Clustering techniques for pattern extraction of multidimensional data is a
very promising subfield of data mining since increasing large volumes of
multidimensional data are collected and need to be analyzed (Birant and Kut, 2007).
The pattern extraction process for multidimensional data is more complex than
conventional data, because the use of multidimensional data will result in more
noise, complex data, and the possibility of unconnected data entities (Sembiring et
al., 2011b). Besides that, the current collected multidimensional data are generally
large in size and high in dimension. This, however, comes with two disadvantages, a
reasonable response time and memory space.
There are several major challenges that are commonly associated with
multidimensional data. Firstly, the dimension of the multidimensional data can cause
serious problems for most analysis methods due to the curse dimensionality problem.
One typical problem to address it is that it is unlikely for all variables to interrelate
meaningfully. Analysts need to find interesting subspaces (subsets of variables) out
of a combinatorial explosive number of possible subspaces in a high-dimensional
dataset. Secondly, even when a selected multivariate data space is given as the
starting point for analysis (which may be a subspace from a higher-dimensional
dataset), it is still a challenge to discover the hidden relationships among those
variables, as potential patterns may take various forms, linear or non-linear. Thirdly,
the attribution of meaning to discover patterns typically requires the input from
experts who have domain knowledge and the subsequent presentation of the patterns
identified to a broader audience (e.g., other experts who will try to replicate the
results, or policy makers who need to act on the results). Fourthly, large and
high-dimensional datasets demand that all analysis methods are computationally efficient
in terms of execution time (Guo et al., 2005).
However, this study focused on two crucial challenges in multidimensional
5
requirement of input parameters due to the large amount of multidimensional data
and the complexity of multidimensional data types, data representation (Yao, 2003)
since clusters within multidimensional generally have different size, shape and
densities; and secondly, developing the mechanisms to test, validate and interpret the
clustering results to reconcile discrepancies in the data.
Recently, several clustering techniques have been introduced and applied to
the multidimensional data, such as k-means (Anderson, 2009; Golob and Recker,
2004; Shekhar et al., 2001), hierarchical clustering (Skyving et al., 2009) and
Support Vector Machine-based approach (SVM) (Chang et al., 2005). Since there are
lacks of valid statistical evaluation methods meanwhile the results of the hierarchical
cluster analysis are subject to interpretation by the investigator. K-means technique is
probably the most popular and simplest solution for clustering the spatio-temporal
data, but still, it has a problem on determining the proper number of clusters and
random issue.
Using probabilistic similarity function, density based clustering algorithms
determine the number of clusters automatically (Hammouche and Postaire, 2008).
Density-based clustering algorithm uses local cluster criterion in which the clusters
are defined as region in data space whose objects are dense, and clusters are
separated from one another with low-density region (Zhang et al., 2013).
Previous researchers have been introduced and proposed many density-based
clustering algorithms, such as density based spatial clustering of application with
noise DBSCAN-based methods (Birant and Kut, 2007), density-based clustering
DENCLUE (Hinneburg and Keim, 1998), and nearest neighbor-based approach
(Ertoz et al., 2002; Steinbach et al., 2003; Wang et al., 2006). Although DBSCAN
capable to find clusters of arbitrary shapes, it has difficulties to determine two input
parameters, Eps and MinPts addition has problem on finding cluster of varying
densities (Birant and Kut, 2007). DENCLUE covered the problem of DBSCAN to
6
the problem on data with high-dimension and had less efficiency even computational
expensive. Furthermore, SNN could handle the data with high-dimension;
nevertheless SNN requires large memory space and determining the difficult density
threshold.
kNN-Kernel density-based (kNN-Kernel-based) clustering algorithms
combined k-nearest neighbor density estimation and kernel density estimation to
cluster the multidimensional data. For instance, KNNClust introduced by (Tran et al.,
2006) was proposed to solve the problems of existing density-based clustering
algorithms on determining smoothing parameters. It has the capability to determine
the number of clusters automatically within multidimensional data and to discover
cluster with arbitrary shape and densities.
However, KNNClust is faced problem on data that contained cluster with
different size. In addition, it is necessary to investigate the proper kernel function
since in kNN-Kernel-based clustering algorithms, there are various kernel functions
that can be used for kernel density estimation (Webb, 2002), such as, Gaussian,
triangular, and rectangular although the most commonly used kernel functions are
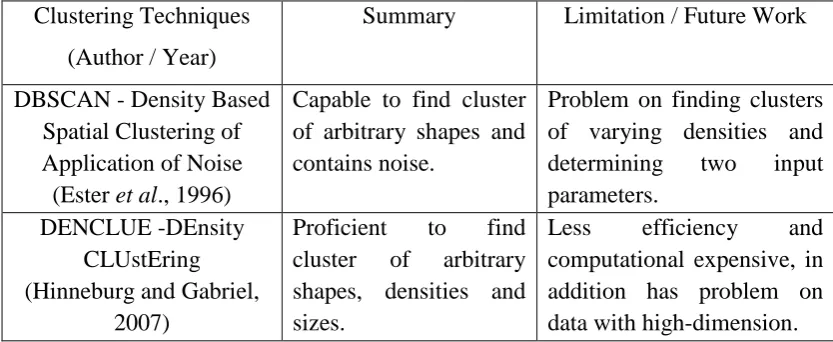
triangular and Gaussian (Tran et al., 2006). Therefore, Table 1.1 summarized the
previous works that related to this study.
Table 1.1: Related works
Clustering Techniques
(Author / Year)
Summary Limitation / Future Work
DBSCAN - Density Based Spatial Clustering of Application of Noise (Ester et al., 1996)
Capable to find cluster of arbitrary shapes and contains noise.
Problem on finding clusters of varying densities and
determining two input
parameters. DENCLUE -DEnsity
CLUstEring (Hinneburg and Gabriel,
2007)
Proficient to find
cluster of arbitrary
shapes, densities and sizes.
Less efficiency and
7
SNN
Shared Nearest Neighbor (Ertoz et al., 2003)
Able to find cluster in high-dimension data
Computational expensive
and required large memory
space, in addition has
problem on determining
require density threshold.
KNNClust – Kernel Nearest Neighbor
Clustering (Tran et al., 2006)
Pioneer to combine
K-nearest neighbor
density estimation and
kernel density
estimation.
Absence of clustering
results validation process.
Needed further
investigation, such as:
comparison to other
clustering approaches and applying high dimensional datasets such as spatio-temporal data.
ILGC – Iterative Local Gaussian Clustering
(Wasito et al., 2007)
Using a non-parametric density-estimation-based approach called iterative local Gaussian clustering (ILGC) to
identify clusters of
expressed genes.
Absence of clustering
results validation process.
Needed further
investigation, such as:
comparison to other
clustering approaches,
applying high dimensional datasets such as spatio-temporal data, or using other kernel functions.
Hybrid- SOM (Guo et al., 2008)
They proposed
integrated approaches
including SOM
multivariate analysis,
multidimensional visualization,
multivariate mapping
and human interaction, for detecting spatial patterns.
The addition of new
components is needed for further development, such
as considering other
clustering methods,
temporal analysis
8
1.3 Problem Statement
Two main problems that will be addressed in this research are:
1. Need of improved clustering technique to extract patterns of
multidimensional data.
Existing density-based clustering algorithms have been proven
outperformed other non-density-based clustering algorithms in clustering
homogenous multidimensional data, but not arbitrary multidimensional
data dealt in this research. However, it is necessary to address large size of
multidimensional dataset.
2. Absence of technique for validating and interpreting the clustering results.
Furthermore, in order to achieve clustering results with high-quality, it is
required to validate the clustering results using appropriate validation
measurements. In addition, it is essential to provide efficient visualization
approaches to interpret the clustering results in informative graphical
display for further analysis.
1.4 Research Goal
The aim of the research is to propose effective and efficient pattern extraction
approach for mining multidimensional data using improved kNN-Kernel
density-based clustering algorithm compared to other widely-known clustering algorithms,
including k-Means, KFCM, KNNClust, ILGC, DBSCAN and DENCLUE
9
1.5 Research Objectives
The objectives of the research are:
1. To propose triangular kernel nearest neighbor based clustering scheme for
better pattern extraction of multidimensional data.
2. To validate the pattern extraction scheme using index validation and 2-D
visualization techniques onto various multidimensional datasets.
1.6 Research Scopes
The scopes of the research include:
1. Noise-less multidimensional data, such as crime data, and fatal crash data
are used in this research.
2. Benchmarked classification data is utilized for evaluating the accuracy of
proposed scheme.
3. Data preprocessing is applied to clean the data from its class label
information.
4. The proposed algorithm is compared against other existing well-known
clustering techniques such as k-Means, KFCM, KNNClust, ILGC,
DBSCAN and DENCLUE algorithms.
5. Four validation techniques are used, namely Silhouette index, Dunn index,
F-measure, and statistical analysis ANOVA, are to be used to analyze the
clustering results.
10
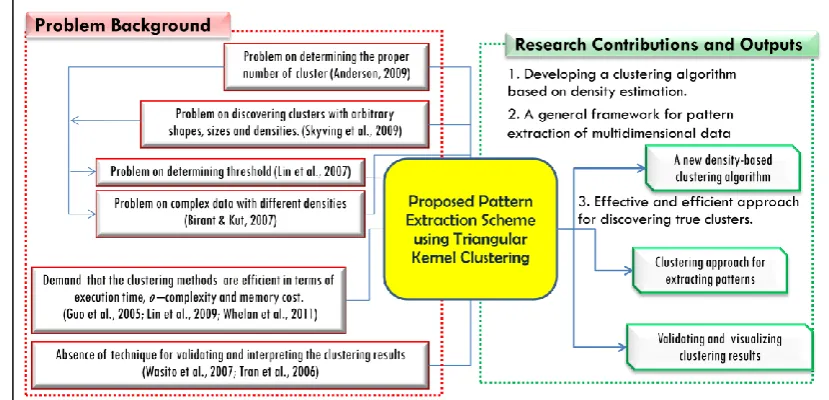
1.7 Research Road Map
In order to discover patterns within multidimensional data, some problems
were faced, such as problem on finding patterns with arbitrary densities. However,
this study proposed an improved pattern extraction scheme using triangular kernel
clustering. Figure 1.1 shows the research road map of this study.
First, developing a clustering algorithm based on density estimation approach
since density-based clustering algorithms has capability to determine number of
cluster automatically using local criterion. Second, a general framework for pattern
extraction of multidimensional data is proposed to handle the difficulties of
multidimensional data that contained cluster with arbitrary shape, size and densities.
In addition, the density-based clustering algorithms are necessary to improved (for
instance by using triangular kernel function) to provide the demand of clustering
method that is efficient at execution time. Therefore, an improved density-based
clustering algorithm is needed to be evaluated by utilizing a number of benchmarked
datasets. Furthermore, the clustering results are crucial to be validated using some
validation measurement and represented in informative view.
11
1.8 Importance of Research
With enormous amount of data stored in files, databases, and other
repositories, it is increasingly important, if not necessary, to develop powerful means
for analysis, and perhaps interpretation of such data and for the extraction of
interesting knowledge that could help in decision-making. Due to the availability
gigantic of multidimensional data and the interest to extract knowledge further for
decision making in various fields, clustering multidimensional data has great
challenges in data mining research. It is important to develop efficient and reliable
clustering method, especially to handle difficulties in determining the proper number
of clusters, therefore, in this study; kernel nearest neighbor based clustering was
proposed. Even if the database technology plays a central role in the development
and deployment of application for multidimensional data, data mining capabilities
will become increasingly important to discover and extract the information from
multidimensional data (Hsu et al., 2008).
Another issue in clustering multidimensional data is the complexity of the
data structure. The clusters involved in multidimensional data have different and
arbitrary shapes and sizes. It would certainly be challenged to develop powerful
clustering algorithm which will be solved using triangular kernel clustering
approach.
In the mean time, such approach creates a look-up table save the distances
between all pairs of data points. With the aid of the look-up table, the distances
between all pairs of data points need to be evaluated only once throughout the
clustering process. It can reduce time-consumption caused by repeated computation
of the distance between every data point.
In this study, the performance between the proposed algorithms, KNNClust,
12
that we could determine which method is better for clustering spatio-temporal data. It
is important to identify most appropriate technique for future research, which can be
implemented in real world situation.
1.9 Organization of Thesis
The thesis consists of five chapters. The structure of thesis was given as
follow:
Chapter 1: Introduction - Explains an overview of the background of the
study, development of techniques and methods used in clustering multidimensional
data and the common problems that are usually encountered in clustering
multidimensional data. Also include the aim, problem statement, the objective,
research scope, and general methodology.
Chapter 2: Literature review - This chapter explored the concept of
multidimensional data, clustering technique, cluster validation, cluster visualization
and cluster interpretation. It also contained the reviews of related previous works for
clustering multidimensional data.
Chapter 3: Research Methodology - This chapter described the approach
taken to solve extracting pattern of multidimensional data through clustering and
detail description of the proposed approach. In addition, the experimental procedure
and schemas were also discussed in this chapter.
Chapter 4: Proposed Pattern Extraction Scheme using Triangular Kernel
Clustering - This chapter explained the basic theory and detailed description of the
13
evaluation of the accuracy of the proposed algorithm through discovering the clusters
within the classification datasets. This chapter also explained the application of TKC
on two multi-dimensional geospatio-temporal datasets. The detail of the
experimental result on each data was also discussed in this chapter.
Chapter 5: Conclusions and Future Work - This chapter provided the
summary of the research, the contribution of the work and recommendation for
REFERENCES
Anderson, T. K. (2009). Kernel Density Estimation and K-means Clustering to
Profile Road Accident Hotspots. Accident Analysis and Prevention, 41(3),
359-364.
Andrienko, G., and Andrienko, N. (2004). Parallel Coordinates for Exploring
Properties of Subsets. Paper presented at the The Second International
Conference on Coordinated & Multiple Views in Exploratory Visualization
(CMV‟04).
Ayramo, S., Pirtala, P., Kauttonen, J., Naveed, K., and Karkkainen, T. (2009).
Mining road traffic accidents o. Document Number)
Basak, J., Sudarshan, A., Trivedi, D., and Santhanam, M. S. (2004). Weather data
mining using independent component analysis. Journal of Machine Learning
Research, 5, 239-253.
Beshah, T., and Hill, S. (2010). Mining road traffic accident data to improve safety:
Role of road-related factors on accident severity in Ethiopia, 14-19.
Bezdek, J. C., and Dunn, J. C. (1975). Optimal Fuzzy Partitions: A Heuristic for
Estimating The Parameters in A Mixture of Normal Distributions. IEEE
Transactions on Computers, C-24(8), 835-840.
Birant, D., and Kut, A. (2007). ST-DBSCAN: An algorithm for clustering
spatial-temp oral data. Data & Knowledge Engineering, 60(1), 208-221.
Bougenière, G., Cariou, C., Chehdi, K., and Gay, A. (2008). (Vol. 23 CCIS, pp.
293-303). Barcelona.
Burns, R. B., and Burns, R. A. (2008). Business Research Methods and Statistics
Using SPSS: SAGE Publication Ltd.
Chang, H., and Yeung, D. Y. (2008). Robust path-based spectral clustering. Pattern
203
Chang, W., Zeng, D., and Chen, H. C. (2005, SEP 13-16, 2005). Prospective
spatio-temporal data analysis for security informatics. Paper presented at the 8th
IEEE International Conference on Intelligent Transportation Systems (ITSC
2005), Vienna, AUSTRIA, 1120-1124.
Clark, A. B., and Lawson, A. B. (2002). Spatio-Temporal Cluster Modeling of Small
Area Health Data. In A. B. Lawson and D. G. T. Denison (Eds.), Spatial
Cluster Modelling: Chapman & Hall/CRC.
Compieta, P., Di Martino, S., Bertolotto, M., Ferrucci, F., and Kechadi, T. (2007).
Exploratory spatio-temporal data mining and visualization. Journal of Visual
Languages and Computing, 18(3), 255-279.
Dalli, A. (2003). Adaptation of the F-measure to cluster based lexicon quality
evaluation. Paper presented at the Proceedings of the EACL 2003 Workshop
on Evaluation Initiatives in Natural Language Processing: are evaluation
methods, metrics and resources reusable?, 51-56.
Dash, R., Mishra, D., Rath, A. K., and Acharya, M. (2010). A hybridized K-means
clustering approach for high dimensional dataset. International Journal of
Engineering Science and Technology, 2(2), 59-66.
Dermoudy, J., Kang, B.-H., Bhattacharyya, D., Jeon, S.-H., and Farkhod, A. (2009).
Process of extracting uncover patterns from data: a review. International
Journal of Database Theory and Application, 2(2), 17-33.
Ding, C., and Li, T. (2007). Adaptive dimension reduction using discriminant
analysis and K-means clustering, Corvalis, OR, 521-528.
Duda, R. O., Hart, P. E., and Stork, D. G. (2001). Pattern Classification: John Wiley
Press.
Ertoz, L., Steinbach, M., and Kumar, V. (2002, April 2002). A New Nearest
Neighbor Clustering Algorithm and its Application. Paper presented at the
The workshop on Clustering High Dimensional Data and its Application,
Second SIAM International Conference on Data Mining, Allington, VA.
Ertoz, L., Steinbach, M., and Kumar, V. (2003). Finding Clusters of Different Sizes,
Shapes, and Densities in Noisy, High-Dimensional Data. Paper presented at
the The 2003 SIAM International Conference on Data Mining.
Ester, M., Krigel, H.-P., Sander, J., and Xu, X. (1996). A density-based algorithm for
discovering clusters in large spatial database with noise. Paper presented at
204
Everitt, B. S. (2000). Cluster Analysis (3rd ed.).
FARS. (2004). Coding and validation manual (2004) National Center for Statistics
and Analysis, National Highway Traffic Safety Administration, Department
of Transportation, Washington, D.C.
Figuera, C., Lillo, J. M., Mora-Jimenez, I., Rojo-Alvarez, J. L., and Caamano, A. J.
(2011, 5-7 Oct. 2011). Multivariate spatial clustering of traffic accidents for
local profiling of risk factors. Paper presented at the Intelligent
Transportation Systems (ITSC), 2011 14th International IEEE Conference on,
740-745.
Filippone, M., and Sanguinetti, G. (2011). Approximate inference of the bandwidth
in multivariate kernel density estimation. Computational Statistics & Data
Analysis, 55(12), 3104-3122.
Frank, A., and Asuncion, A. (2010). UCI Machine Learning Repository.
(Publication., from University of California, School of Information and
Computer Science, Irvine, CA: http://archive.ics.uci.edu/ml
Fu, L., and Medico, E. (2007). Flame, a novel fuzzy clustering method for the
analysis of DNA microarray data. BMC bioinformatics, 8(1), 3.
Fukunaga, K., and Hostetler, L. (1975). The estimation of the gradient of a density
function, with applications in pattern recognition. Information Theory, IEEE
Transactions on, 21(1), 32-40.
Gionis, A., Mannila, H., and Tsaparas, P. (2007). Clustering aggregation. ACM
Transactions on Knowledge Discovery from Data, 1(1).
Golmah, V., and Parvizian, J. (2010). Visualization and the understanding of
multidimensional data using genetic algorithms: Case study of load patterns
of electricity customers. International Journal of Database Theory and
Application, 3(4), 41-56.
Golob, T. F., and Recker, W. W. (2004). A Method for Relating Type of Crash to
Traffic Flow Characteristics on Urban Freeways. Transportation Research
Part a-Policy and Practice, 38(1), 53-80.
Gorban, A. N., and Zinovyev, A. Y. (2008). PCA and K-Means Decipher Genome
Principal Manifolds for Data Visualization and Dimension Reduction. In A. N.
Gorban, B. Kégl, D. C. Wunsch and A. Y. Zinovyev (Eds.), (Vol. 58, pp.
205
Gullo, F., Ponti, G., and Tagarelli, A. (2008). Clustering uncertain data via
K-medoids (Vol. 5291 LNAI, pp. 229-242). Naples.
Guo, D., Gahegan, M., MacEachern, A. M., and Zhou, B. (2005). Multivariate
Analysis and Geovisualization with an Integrated Geographic Knowledge
Discovery Approach. Cartographic and Geographic Information Science,
32(2), 113-132.
Guo, H., Xiao, H., and Yuan, X. (2008). Multi-dimensional Transfer Function
Design based on Flexible Dimension Projection Embedded in Parallel
Coordinates.
Hadavandi, E., Shavandi, H., and Ghanbari, A. (2010). Integration of genetic fuzzy
systems and artificial neural networks for stock price forecasting.
Knowledge-Based Systems, 23(8), 800-808.
Halkidi, M., Batistakis, Y., and Vazirgiannis, M. (2001). On clustering validation
techniques. Journal of Intelligent Information Systems, 17(2-3), 107-145.
Hammouche, K., and Postaire, J. (Eds.). (2008). Multidimensional texture analysis
for unsupervised pattern classification: InTech.
Han, J., and Kamber, M. (2012). Data mining: concepts and techniques (3rd Edition
ed.): Burlington, MA : Elsevier.
Hartigan, J. A., and Wong, M. A. (1979). Algorithm AS 136: A K-Means Clustering
Algorithm. Journal of the Royal Statistical Society. Series C (Applied
Statistics), 28(1), 100-108.
Hinneburg, A., and Gabriel, H.-H. (2007). DENCLUE 2.0: Fast Clustering Based on
Kernel Density Estimation. LNCS, 4723, 70-80.
Hinneburg, A., and Keim, D. A. (1998). An efficient approach to clustering in large
multimedia databases with noise. Paper presented at the The fourth
international conference on knowledge discovery and data mining (KDD'98),
Menlo Park, CA, 58-65.
Hinneburg, A., and Keim, D. A. (2003). A general approach to clustering in large
database with noise. Knowledge and Information Systems, 5(4), 387-415.
Hoffman, F. M., Hargrove, W. W., Mills, R. T., Mahajan, S., Erickson, D. J., and
Oglesby, R. J. (2008). Multivariate Spatio-Temporal Clustering (MSTC) as a
Data Mining Tool for Environmental Applications. Paper presented at the
206
Software Integrating Sciences and Information Technology for
Environmental Assessment and Decision Making.
Hsu, W., Lee, M. L., and Wang, J. (2008). Temporal and Spatio-Temporal Data
Mining. Hersey, New York: IGI Publishing.
Hu, Z., Xu, B., Pan, L., Zhang, S., and Zen, J. (2007). The Dynamic KNN Clustering
of Undergraduate Consumption with Gini Coefficient: A Case of Zhejiang.
Inselberg, A. (1985). The plane with parallel coordinates. The Visual Computer, 69–
92.
Inselberg, A., and Dimsdale, B. (1990). Parallel coordinates: A tool for visualizing
multi-dimensional geometry. Paper presented at the IEEE Visualization, 361–
378.
Jain, A. K., and Law, M. H. C. (2005). Data clustering: A user's dilemma. Lecture
Notes in Computer Science, 3776, 1-10.
Jarvis, R. A., and Patrick, E. A. (1973). Clustering using a similarity measure based
on shared nearest neighbors. IEEE Transactions on Computers, C-22(11),
1025-1034.
Johansson, J., Ljung, P., Jern, M., and Cooper, M. (2005, October 23-25). Revealing
Structure within Clustered Parallel Coordinates Displays. Paper presented at
the IEEE Symposium on Information Visualization, Minneapolis, MN, USA,
125-132.
Johnson, S. D., and Bowers, K. J. (2004). The stability of space-time clusters of
burglary. British Journal of Criminology, 44(1), 55-65.
Kao, Y. T., Zahara, E., and Kao, I. W. (2008). A hybridized approach to data
clustering. Expert Systems with Applications, 34(3), 1754-1762.
Kechadi, M.-T., Bertolotto, M., Ferrucci, F., and Martino, S. D. (2009). Mining
spatio-temporal datasets: relevance, challenge and current research directions
In J. Ponce and A. Karahoca (Eds.), Data mining and knowledge discovery in
real life applications (pp. 438). Vienna, Austria: I-Tech.
Kechadi, M. T., and Bertolotto, M. (2006). A visual approach for spatio-temporal
data mining, Waikoloa Village, HI, 504-509.
Knorr-Held, L., and Raßer, G. (2000). Bayesian detection of clusters and
207
Kolesnikov, A., and Trichina, E. (2012). Determining the number of clusters with
rate-distortion curve modeling. In Image Analysis and Recognition (pp.
43-50): Springer.
Koubarakis, M., Theodoridis, Y., and Sellis, T. (2003). Spatio-temporal databases in
the years ahead (Vol. 2520, pp. 345-347).
Kulczycki, P., Charytanowicz, M., Kowalski, P. A., and Lukasik, S. (2012). The
Complete Gradient Clustering Algorithm: Properties in Practical
Applications. Journal of Applied Statistics, 39(6), 1211-1224.
Kumar, M. V., and Chandrasekar, C. (2011). Spatial-Temporal Analysis of
residential Burglary Repeat Victimization: Case study of Chennai City of
Promoters Apartments, India. International Journal of Research and Reviews
in Computing Engineering, Vol. 1(No. 3), 101-111.
Kumar, V., Klooster, S., Steinbach, M., Potter, C., Tan, P.-N., and Torregrosa, A.
(2001, August, 5-9). Mining Scienctific Data: Discovery of Patterns in
Global Climate System. Paper presented at the Joints Statistical Meetings,
Athens, GA.
Lavrac, N., Jesenovec, D., Trdin, N., and Kosta, N. M. (2008). Mining
spatio-temporal data of traffic accidents and spatial pattern visualization.
Metodoloski zveski, 5(1), 45-63.
Lawrence, R. D., Almasi, G. S., Koteyar, V., Viveros, M. S., and Duri, S. S. (2001).
Personalization of supermarket product recommendations. Data Mining and
Knowledge Discovery, 5(1-2), 11-32.
Lawson, A. B., and Denison, D. G. T. (2002). Spatial cluster modelling. In A. B.
Lawson and D. G. T. Denison (Eds.), Spatial cluster modelling. Boca Raton,
Fla.: Chapman & Hall/CRC.
Lee, Y.-S., and Yen, S.-J. (2013). Mining multidimensional frequent patterns from
relational database. In Intelligent Information and Database Systems (pp.
51-60): Springer.
Levine, N. (2004.). CrimeStat III: A spatial statistics program for the analysis of
crime incident locations (version 3.0). Washington, DC, : Ned Levine &
Associates: Houston, TX/ National Institute of Justice.)
Li, X., and Murata, T. (2012). Multidimensional clustering based collaborative
208
Computer Science & Education (ICCSE), 2012 7th International Conference
on, 905-910.
Liang, Z., Zhang, G., Xu, S., Ou, A., Fang, J., Xu, N., et al. (2011). A kernel-decision
tree based algorithm for outcome prediction on acupuncture for neck pain: A
new method for interim analysis. Paper presented at the Bioinformatics and
Biomedicine Workshops (BIBMW), 2011 IEEE International Conference on,
760-764.
Lin, F., Xie, K., Song, G., and Wu, T. (2009). A novel spatio-temporal clustering
approach by process similarity, Tianjin, 150-154.
Martinez, W. L., and Martinez, A. R. (2005). Exploratory Data Analysis With
Matlab: Chapman & Hall/CRC.
Martinez, W. L., Martinez, A. R., and Solka, J. L. (2010). Exploratory Data Analysis
With MATLAB: CRC Press.
Menandez, H., and Camacho, D. (2012). A genetic graph-based clustering algorithm,
Lecture Notes in Computer Science (including subseries Lecture Notes in
Artificial Intelligence and Lecture Notes in Bioinformatics) (Vol. 7435
LNCS, pp. 216-225). Natal.
Michalski, R. S., and Seeman, W. D. (2007). Recent Advances in Conceptual
Clustering: CLUSTER3. Studies in Classification, Data Analysis, and
Knowledge Organization, 285-297.
National Hurricane Centre. (2003). from
http://www.tpc.ncep.noaa.gov/2003isabel.shtml
NCSA, N. C. f. S. a. A. ( 2004). Fatality analysis reporting system (FARS)
web-based encyclopedia. from http://www-fars.nhtsa.dot.gov/
Neill, D. B., Moore, A. W., Sabhnani, M., and Daniel, K. (2005). Detection of
emerging space-time clusters, 218-227.
Papadias, D., Tao, Y., Kalnis, P., and Zhang, J. (2002). Indexing spatio-temporal
data warehouses. Paper presented at the 18th International Conference on
Data Engineering, San Jose, CA, 166-175.
Parsons, L., Haque, E., and Liu, H. (2004). Subspace Clustering for High
Dimensional Data: A Review.
Pearson, K. (1901). LIII. On lines and planes of closest fit to systems of points in
209
Pearson, R. K., Zylkin, T., Schwaber, J. S., and Gonye, G. E. (2004). Quantitative
evaluation of clustering results using computational negative controls, Lake
Buena Vista, FL, 188-199.
Phillips, R., and Zenchenko, B. (2012). K-search: Searching for clusters. Paper
presented at the Acoustics, Speech and Signal Processing (ICASSP), 2012
IEEE International Conference on, 2093-2096.
Scott, D. W. (1992). Multivariate Density Estimation. New York: Wiley.
Scott, D. W. (2009). Multivariate density estimation: theory, practice, and
visualization (Vol. 383): Wiley.
Sembiring, R. W., Zain, J. M., and Embong, A. (2011a). Alternative Model for
Extracting Multidimensional Data Based-On Comparative Dimension
Reduction. In Software Engineering and Computer Systems (pp. 28-42):
Springer.
Sembiring, R. W., Zain, J. M., and Embong, A. (2011b). Dimension Reduction of
Health Data Clustering. International Journal on New Computer
Architectures and Their Applications, 1(4), 1018-1026.
Seo, J. (2005). Information visualization design for multidimensional data:
integrating the rank-by-feature framework with hierarchical clustering.
University of Maryland at College Park.
Shekhar, S., Lu, C. T., Chawla, S., and Zhang, P. (2001). Data Mining and
Visualization of Twin-cities Traffic Data: University of Minnesotao.
Document Number)
Shi, Y., Song, Y., and Zhang, A. (2005). A shrinking-based clustering approach for
multidimensional data. Knowledge and Data Engineering, IEEE Transactions
on, 17(10), 1389-1403.
Skillicorn, D. (2007). Understanding complex datasets: data mining with matrix
decompositions. Boca Rotan, FL: Chapman & Hall/CRC.
Skupin, A. (2004). The world of geography: Visualizing a knowledge domain with
cartographic means.
Skyving, M., Berg, H. Y., and Laflamme, L. (2009). A Pattern Analysis of Traffic
Crashes Fatal to Older Drivers. Accident Analysis and Prevention, 41(2),
253-258.
Speech and Image Processing Unit. (2012). Clustering datasets (Publication., from
210
Steinbach, M., Tan, P. N., Kumar, V., Klooster, S., and Potter, C. (2003, 24 - 27
August 2003). Discovery of climate indices using clustering. Paper presented
at the Proceedings of the ACM SIGKDD International Conference on
Knowledge Discovery and Data Mining, Washington, DC, 446-455.
Tabakov, P. Y., and Duffy, K. (2010). Multidimensional data mining by means of
randomly travelling hyper-ellipsoids. World Academy of Science,
Engineering and Technology, 47, 890-895.
Tan, P. N., Steinbach, M., and Kumar, V. (2006). Introduction to Data Mining:
Addison Wesley.
TESSMER, J. M. (2002). FARS Analytic Reference Guide 1975 to 2002. National
Highway Traffic Safety Administration, Department of Transportation,
Washington, D.C.
Tobler, W. (1979). Am Cartogr, 6, 101-106.
Townsley, M., Homel, R., and Chaseling, J. (2000). Repeat burglary victimization:
Spatial and temporal patterns. Australian and New Zealand Journal of
Criminology, 33(1), 37-63.
Tran, T. N., Nguyen, T. T., Willemsz, T. A., van Kessel, G., Frijlink, H. W., and
Maarschalk, K. v. d. V. (2012). A density-based segmentation for 3D images,
an application for X-ray micro-tomography. Analytica Chimica Acta, 725,
14-21.
Tran, T. N., Wehrens, R., and Buydens, L. M. C. (2006). KNN-kernel density-based
clustering for high-dimensional multivariate data. Computational Statistics &
Data Analysis, 51, 513-525.
Tsumoto, S., Hirano, S., and Iwata, H. (2012). Temporal Data Mining for Nursing
Schedule Management. Paper presented at the Innovations in Bio-Inspired
Computing and Applications (IBICA), 2012 Third International Conference
on, 229-234.
Veenman, C. J., Reinders, M. J. T., and Backer, E. (2002). A maximum variance
cluster algorithm. IEEE Transactions on Pattern Analysis and Machine
Intelligence, 24(9), 1273-1280.
Wang, M., Wang, A. P., and Li, A. B. (2006, AUG 14-16, 2006). Mining
spatial-temporal clusters from geo-databases. Paper presented at the 2nd
International Conference on Advanced Data Mining and Applications, Xian,
211
Wasito, I., Hashim, S. Z. M., and Sukmaningrum, S. (2007). Iterative Local Gaussian
Clustering for Expressed Genes Identification Linked to Malignancy of
Human Colorectal Carcinoma. Bioinformation, 2(5), 175-181.
Webb, A. R. (2002). Statistical pattern recognition (2 ed.). West Sussex, England:
John Wiley & Sons.
Wei-wu, R., Liang, H., Kuo, Z., and Jianfeng, C. (2013). An Efficient Parallel
Anomaly Detection Algorithm Based on Hierarchical Clustering. Journal of
Networks, 8(3), 672-679.
Witten, I. H., Frank, E., and Hall, M. A. (2011). Data mining: Practical machine
learning tools and techniques. Burlington, USA: Morgan Kauffmann.
Xu, H., and Ma „ayan, A. (2011). Visualization of Patient Samples by
Dimensionality Reduction of Genome-Wide Measurements
Information Quality in e-Health. In A. Holzinger and K.-M. Simonic (Eds.), (Vol.
7058, pp. 15-22): Springer Berlin / Heidelberg.
Xu, R., and Wunsch, D. C. (2009). Clustering. New Jersey, NJ: Wiley-IEEE Press.
Yang, H., Parthasarathy, S., and Mehta, S. (2005). A generalized framework for
mining spatio-temporal patterns in scientific data. Paper presented at the
Proceedings of the eleventh ACM SIGKDD international conference on
Knowledge discovery in data mining.
Yao, X. (2003). Research issues in spatio-temporal data mining. Paper presented at
the workshop on Geospatial Visualization and Knowledge Discovery.
Yin, J., Fan, X., Chen, Y., and Ren, J. (2005). High-dimensional shared nearest
neighbor clustering algorithm, Changsha, 494-502.
Yuan, X., Guo, P., Xiao, H., and Qu, H. (2009). Scattering Points in Parallel
Coordinates. IEEE Transactions on Visualization and Computer Graphics,
15(6), 1001-1008.
Zahn, C. T. (1971). Graph-theoretical methods for detecting and describing gestalt
clusters. Computers, IEEE Transaction on, 100(1), 68-86.
Zhang, D., and Chen, S. (2003a). Clustering incomplete data using kernel-based
fuzzy c-means algorithm. Neural Processing Letters, 18, 155-162.
Zhang, D., and Chen, S. (2003b, 2003). Kernel-based fuzzy and probabilistic
c-means clustering. Paper presented at the The International Conference on
212
Zhang, D., Chen, S., Pan, Z., and Tan, K. (2003, 2-5 November 2003). Kernel-based
Fuzzy CLustering Incorporating Spatial Constraints for Image Segmentation.
Paper presented at the Second International Conference on Machine Learning
and Cybernetics, Xi'an.
Zhang, X., Shan, S., Yu, Z., and Jiang, H. (2013). A Dispersive Degree Based
Clustering Algorithm Combined with Classification.
Zhou, F., De la Torre, F., and Hodgins, J. (2013). Hierarchical aligned cluster
analysis for temporal clustering of human motion.
Zhou, H., Yuan, X., Qu, H., Cui, W., and Chen, B. (2008). Visual Clustering in