ABSTRACT
PHADNIS, DEEPTI VISHWAS. Achieving Communication Scalability in Collaborative Development Tools: Performance Modeling of the Jazz Development Environment. (Under the direction of Dr. Michael Devetsikiotis.)
Scalability remains a crucial challenge in developing the tremendous potential of distributed collaborative environments. We have performed a detailed study of the scalability aspects of the underlying communications and service delivery platform required to operate large scale collaborative development environments, with particular application to Rational collaboration tools. We have utilized simulation trials to quantify traffic and resource usage patterns and their scaling characteristics and parameterized by use of caching degree and multiprocessing.
We have designed a performance model to analyze the scalability aspects of the Jazz system. The system is modeled as Closed Queuing Network. The system is simulated using the Arena Simulator. Various scenarios are simulated to understand how the system would behave under various conditions. We are also providing an approximate mathematical closed form solution using Multi Class Mean Value Analysis to solve the model. A comparison between results from simulation and MVA is also done.
c
Copyright 2010 by Deepti Vishwas Phadnis
Achieving Communication Scalability in Collaborative Development Tools: Performance Modeling of the Jazz Development Environment
by
Deepti Vishwas Phadnis
A thesis submitted to the Graduate Faculty of North Carolina State University
in partial fulfillment of the requirements for the Degree of
Master of Science
Computer Science
Raleigh, North Carolina
2010
APPROVED BY:
Dr. Harry Perros Dr. Tao Xie
DEDICATION
BIOGRAPHY
Deepti Phadnis was born on May 26, 1984 in Pune, India. She graduated from Pune Institute Of Computer Technology, Pune, in June 2006, with a Bachelor of Computer Engineering degree. She has worked from July 2006 to November 2007 in Persistent Systems Ltd, Pune, India as a Software Engineer.
ACKNOWLEDGEMENTS
I would like to thank my adviser, Dr. Michael Devetsikiotis, who encouraged and guided me from initial to the final level of my thesis. He has provided me support in many ways. I am thankful to him for giving me an opportunity to work under him.
I am grateful to Dr. Harry Perros for his insightful suggestions towards my thesis and for serving on my committee. I thank Dr. Tao Xie for agreeing to be on my thesis committee.
I would also like to thank my lab mates Keerthana, Yannis, Mihailis, Nilesh and Yan who made my work in the lab a learning and an enjoyable experience.
TABLE OF CONTENTS
List of Tables . . . vii
List of Figures . . . .viii
Chapter 1 Introduction . . . 1
1.1 Motivation . . . 1
1.2 Overview . . . 1
1.3 Related Work . . . 2
1.4 Performance Modeling . . . 2
1.4.1 Need for performance modeling . . . 2
1.4.2 Factors affecting Performance . . . 3
1.4.3 Effects . . . 3
1.5 Collaborative Software Development . . . 3
1.5.1 Collaborative Software Tools . . . 4
1.6 Web Services . . . 5
1.7 Methods which help in improving scalability . . . 5
1.7.1 Mirroring . . . 6
1.7.2 Caching . . . 6
1.7.3 Proxy cache . . . 6
1.8 Contribution . . . 7
1.9 Organization Of Thesis . . . 7
Chapter 2 Jazz . . . 8
2.1 Jazz Collaborative Tool . . . 8
2.1.1 Design Goals . . . 8
2.2 Jazz Architecture . . . 9
2.2.1 Jazz Team Server . . . 9
2.2.2 Jazz Foundation Services . . . 10
2.3 Rational Team Concert Architecture . . . 10
2.3.1 Rational Team Concert Server . . . 11
2.3.2 Rational Team Concert Client . . . 11
2.4 Jazz Team Server Components . . . 11
2.5 Jazz proxy caching . . . 11
2.5.1 Forward proxy . . . 11
2.5.2 Reverse Accelerator Proxy . . . 12
Chapter 3 Performance Model and Simulation . . . 13
3.1 Performance Model . . . 13
3.2 Model . . . 15
3.2.1 RTC Clients . . . 15
3.2.2 Proxy cache . . . 15
3.2.4 Network Gateway . . . 15
3.2.5 Switched Ethernet . . . 16
3.2.6 Web services . . . 16
3.2.7 Data server . . . 17
3.2.8 Inputs . . . 17
3.2.9 Outputs . . . 17
3.2.10 Factors . . . 17
3.2.11 Advantages . . . 17
3.2.12 Service Time . . . 18
3.2.13 User Inputs . . . 18
Chapter 4 Performance Results . . . 19
4.1 Mean Value Analysis with Multiple classes of Requests . . . 19
4.1.1 Approximation for multiple resource queues . . . 21
4.1.2 Implementation . . . 23
4.1.3 Algorithm . . . 23
4.2 Simulation . . . 23
4.2.1 Scenario 1 . . . 23
4.3 Scenario 2 . . . 28
4.4 Scenario 3 . . . 29
4.5 Scenario 4 . . . 32
4.6 Scenario 5 . . . 32
Chapter 5 Conclusion and Future Work . . . 37
5.1 Summary . . . 37
5.2 Future Work . . . 38
LIST OF TABLES
Table 3.1 Services Data . . . 18
LIST OF FIGURES
Figure 1.1 Setup in Distributed Software Environments. Picture taken from [29] . . 4
Figure 2.1 Jazz Technology and Team Concert. Picture taken from [10] . . . 9
Figure 2.2 Rational Team Concert.Picture taken from [10] . . . 10
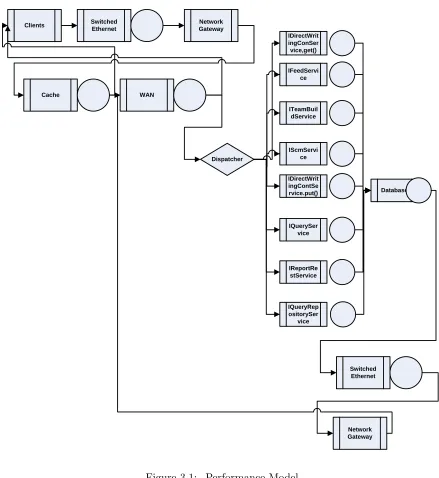
Figure 3.1 Performance Model . . . 14
Figure 4.1 Design of the RTC server in simulation. . . 20
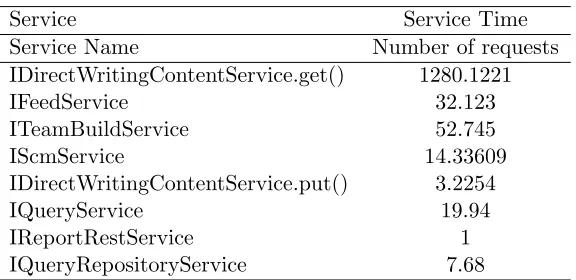
Figure 4.2 Design of the RTC server in Multiclass Mean Value Analysis. . . 20
Figure 4.3 Multiple resource queue . . . 22
Figure 4.4 Approximation for multiple resource queues . . . 22
Figure 4.5 Scenario 1: Comparision between MultiClass MVA and Simulation for Response Time . . . 26
Figure 4.6 Scenario 1: Utilization of Resources . . . 26
Figure 4.7 Scenario 1: Service calls per Second . . . 27
Figure 4.8 Scenario 1: Confidence intervals . . . 27
Figure 4.9 Scenario 2: Comparision between MultiClass MVA and Simulation for Response Time . . . 28
Figure 4.10 Scenario 2: Confidence intervals . . . 29
Figure 4.11 Scenario 3: Response Time when 6 processors are present in the RTC server . . . 30
Figure 4.12 Scenario 3: Service transactions per second when 6 processors are present in the RTC server . . . 31
Figure 4.13 Scenario 3: Resource Utilization when 6 processors present in the RTC server . . . 31
Figure 4.14 Scenario 4: Response Time of Cache with external traffic of 10000 re-quests per hour . . . 33
Figure 4.15 Scenario 4: Response Time of RTC server with external traffic of 10000 requests per hour . . . 33
Figure 4.16 Scenario 4: Utilization of Resources with external traffic of 10000 requests per hour . . . 34
Figure 4.17 Scenario 5: Response Time of Cache with external traffic of 20000 re-quests per hour . . . 35
Figure 4.18 Scenario 5: Response Time Of RTC server with external traffic of 20000 requests per hour . . . 35
Chapter 1
Introduction
1.1
Motivation
Scalability remains a crucial challenge in developing the tremendous potential of distributed collaborative environments. We have performed a detailed study of the scalability aspects of the underlying communications and service delivery platform required to operate large scale collaborative development environments, with particular application to Rational collaboration tools and Jazz.
We have done simulation trials to quantify traffic and resource usage patterns and their scaling characteristics and parameterized using caching and multiprocessing.
1.2
Overview
We have designed a performance model to analyze the scalability aspects of the Jazz system. Jazz is a team collaboration platform for the full software development lifecycle, designed to support seamless integration of tasks across all phases of the software lifecycle. It’s platform is based on a client-server architecture. The Jazz server hosts a set of services and houses data in its repository. Remote clients communicate with the Jazz server over the network using HTTP. We have modeled the Rational Team Concert as a Closed Queuing Network. Each part of the system is modeled as a queue with buffer space and service time. There are different classes of requests depending on the service called each having its own service time.
We have simulated the system under various load conditions and provided the numerical results. Results with caching are also obtained. Using our model bottlenecks, average response times, service transactions per second, resource utilizations can be predicted.
We are simulating the model using the Arena simulator. Code is written in VBA to automate the collection of results.
1.3
Related Work
We have modeled the Rational Team Concert Server as having different classes of services with one or more processors shared between the services and solved it using multiclass mean value analysis. Another way to solve this kind of sharing was using Queuing Networks with Blocking [23, 22]. Exact closed form solutions for closed queuing networks with blocking have been reported only in few cases. Most techniques used to analyze such networks have been in the form of approximations, numerical analysis and simulation [22]. Blocking Before Service (server is not occupied) was used for open networks [22]. Blocking takes a mean service time for all types requests. Our model uses different service times for different classes.
The Method of Layers [26] is also proposed to solve such queuing networks and provide performance estimates for Distributed applications. Performance of such distributed applica-tions is affected by software design, threading level, instances of processors and allocation of processes to processors. Linearizer [20] algorithm is used for predicting performance results. Linearizer algorithm gives an approximate analysis of closed product form queuing networks. MOL divides a Layered Queuing network into two complementary models, one for software and one for devices and combines results to provide performance estimates for the system.
The Stochastic Rendezvous Networks (SRVN) [31] is also used for modeling distributed environment. Server tasks execute in two-phase pattern. In rendezvous phase the customer and the server communicate. In post rendezvous phase the caller task is released. Bard-Schweitzer approximate Mean Value Analysis has been implemented with SRVN [26].
1.4
Performance Modeling
1.4.1 Need for performance modeling
Performance modeling is an integral aspect for the design of any system [16]:
1. Helps us to evaluate the design and detect flaws in it before actually spending time and resources in it.
3. Detect bottlenecks
4. Detect the most used paths and resources
5. Detect interdependencies of different components
6. Capacity provisioning
7. Performance prediction
8. Figure out how system bottlenecks shift with changes in workload characteristics
1.4.2 Factors affecting Performance
The various factors which affect the performance of the system are payload size, number of servers, load balancing, hardware and software constraints, maximum number of users that can simultaneously access the server, maximum number of connections made, resource management etc.
1.4.3 Effects
1. Waiting Time - Time spent waiting for the resource.
2. Response Time - It is the time between the client sending the request and getting the response. It is the addition of waiting time and service time.
3. Throughput - Amount of data which can be successfully transferred within a given period of time
4. Resource Utilization - It is the fraction of time that the resource is busy.
5. Transactions per second - It will be the number of transactions executed in one second.
1.5
Collaborative Software Development
Software development has evolved from being concentrated at a single site to being geographi-cally distributed. This phenomena is called as ’distributed’, ’global’ or ’multi-site’ development. It has several benefits of availability of a large pool of skilled people, round-the-clock develop-ment and huge savings through low labor cost in developing countries [29, 14].
to-face meetings and phone calls. For the onsite teams, teleconferences and follow-up e-mails were used. The primary data collection technique was semi-structured interviews, guided by questions like: “What are the different challenges you face in your work due to the geographic distribution of your project?”, “Which of these challenges have the greatest impact on your work?” and “What tools and methodologies do you use to address these challenges?”
Best Practices: We found that the teams have developed several “best practices” to help address some of the well-known challenges of distributed development. Since people aspects play a very important role in distributed projects, managers usually adopt early team-building measures (e.g. face-to-face meetings) to create strong rapport between team members across sites. In fact, successful multi-site projects had as much as 8 weeks of face-to-face contact for training of key team members. In some cases, when team members return to their own sites, they act as contact people or liaisons, a practice that has also been reported elsewhere [22]. While the liaisons may also help bridge cultural differences, as a general rule, new team members are given some kind of informal cultural training according to the requirements of the project. Teams stressed on the need for consistent processes to be deployed and examples of practices they found useful included creating and maintaining a glossary of common terms, performing code releases early and often, and using short cycle times to ensure focus. We found that some teams have adopted interesting
optimization techniques e.g. use of an asset management tool to help maximum re-use of assets (e.g. software licenses) through inter-site sharing, particularly when business hours at two sites are non-overlapping. Some coarse indicators of project status and teamwork are also collected, e.g. using frequency of contributions and interactions as a measure of overall project progress and team morale, using interviews and surveys that request numeric answers to questions on personal work, teamwork etc. Finally, there is extensive use of tools to aid in communication (e-mails, chat, phone calls etc.), document sharing (e.g. through Lotus Notes teamrooms), configuration management (e.g. Rational ClearCase [23]) and defect management (e.g. Rational ClearQuest, [23]).
Challenges: The best practices notwithstanding, practitioners also reported on a wide variety of challenges. Some of the main challenges are indicated in Fig.1 using the legend “Problem areas”. A basic difficulty is the inability to communicate effectively across distances, cultures and time-zones, as has also been reported elsewhere (Section 1.1). We discovered that these problems were particularly acute in distributed requirements management, since it is one of the most collaboration-intensive activities in software development. Several study participants reported difficulties in gaining shared understanding of requirements, and in propagating and managing requirement changes. Similar issues arose with interface agreements. A related concern was integration testing; since requirements and interface Fig 1 – A Typical Setup in Distributed Software Development
Translation to system requirements Code, Documentation and Test Data
Release Business
Requirements Data Confidentiality/ Size Issues
Process & Metrics Issues
Integration Failures
Knowledge Migration & Management REMOTE DEVELOPMENT
CENTER INTEGRATION TEAM ONSITE TRAINEES CUSTOMER & BUSINESS ANALYST Legend – Problem areas Customer
Remote development team
REMOTE DEVELOPMENT CENTER Interface Agreements Release Misinterpretation Misinterpretation 733
Figure 1.1: Setup in Distributed Software Environments. Picture taken from [29]
Global Software Engineering (GSD) is coordination over distance [14]. Geographic distance profoundly affects ability to collaborate [21]. Spontaneous communication and collaboration declines as a function of distance between offices, and the asymptote is nearly at a distance of 30 meters [3, 14]. Lack of communication reduces collaboration. Different reasons for lack of communication are difference in time zones, different cultures, different language, different working styles.
1.5.1 Collaborative Software Tools
create an executable deliverable and its supporting artefacts’ [6].
Collaborative software tools help in solving some of the problems related to the collabora-tive and geographically distributed software development. They have provisions for maintaining different versions of code, bug tracking, informal communication, maintaining project related documentation, integration builds, testing and task management. Different tools that are avail-able for collaborative software development are:
1. SourceForge - It is an open source software hosting web site, which offers features like bug tracking, project management, forum service, mailing list distribution, configuration management and discussions [12].
2. Subversion - It is a version control system which uses copy-modify-merge approach. It uses URLs to identify version files and directories [8].
3. Stellation - It introduces fine-grained source control with more focus on dynamic program organization and inter-program co-ordination [29].
4. Sangam - Sangam is an eclipse plug-in through which users in different locations can share workspace. It also includes chatting. It is based on pair programming [15].
5. Coven - Supports temporal fine granularity. Individual changes can be checked in the sub repository without them affecting the master copy. It has hierarchical repository which allows sub teams to isolate their changes yet work in coordination with rest of the project. Coven uses ’soft locks’ for communication which allows programmers to attach notifications to parts of the project to keep in touch with other programmers [7].
1.6
Web Services
Jazz has a number of web services which are hosted on the Jazz server as well as Rational Team Server. It uses Service Oriented Architecture. Web services use the SOAP protocol which runs over HTTP. Jazz uses the Representational State Transfer (REST) [11] style of architecture. REST assumes that web consists of hyper linked resources which are identified by an URI. A well designed application will seem like a linked set of resources. REST is stateless. Each request from client must contain all the information required for the request. It is cacheable since responses from server can be marked ’cacheable’ and can be stored by client [19].
1.7
Methods which help in improving scalability
1.7.1 Mirroring
By distributing client requests across mirrors, request loads can be distributed across multiple mirrors. Thus the response would be in timely fashion even if there is high load. It helps in load balancing and increasing the reliability since even if one server fails some other mirror can satisfy the request. Mirror is configured on database level [13].
1.7.2 Caching
Developers often use replication and caching mechanisms to enhance web application perfor-mance. Caching techniques can be classified broadly into four techniques [30]:
1. Edge Computing - It replicates the application code at multiple edge servers and keeps the data centralized. If the edge servers are located worldwide, each data access incurs wide area network (WAN) latency and the central database could become a bottleneck.
2. Data Replication: - Places data at each edge server so that generating a page requires only local computation and data access. Each update must be propagated to all replicas to maintain the data consistency.
3. Content-Aware Data Caching - Content aware caching systems cache database results and query results as the application code issues them. Each edge server maintains a partial copy of the database.
4. Content-Blind Data Caching - It stores the results of the remote database queries sepa-rately. A cache will have a hit only if the application issues the exact same query.
1.7.3 Proxy cache
Jazz is compatible for using forward proxy caching as well as reverse proxy caching. It can be set up with either Apache Httpd or Squid proxy cache. Proxy caches are useful for handling the exponential web traffic. They are installed where many clients are accessing the internet through a single path [1].
1.8
Contribution
We have designed a performance model for the Rational Team Server which is a collaborative software development tool. The model is a closed queuing network. Each part of the system is modeled as a queue with buffer space and service time. We have analyzed the data given by IBM for designing this model.
The model is simulated using the Arena Simulator. Various scenarios are simulated to understand how the system would behave under certain conditions. Factors like caching degree and multiprocessing degree are changed and performance results are collected. We can predict response time, resource utilizations, bottlenecks and service calls per second using model.
We also provide an approximate closed form solution using the Mean Value Analysis for multiclass requests. Comparison is shown between results from simulation and multiclass mean value analysis.
1.9
Organization Of Thesis
The organization of thesis is as follows:
• Chapter 2 - We describe the architecture of Jazz, a collaborative software development
platform and Rational Team server, the first Jazz based tool.
• Chapter 3 - We describe our performance model of the Rational Team server and how
each user interacts with the system.
• Chapter 4 - We simulate the performance model using Arena for various scenarios. We
also give a mathematical solution to our performance model using Multi class Mean Value Analysis. We compare the results obtained from simulation and Multiclass MVA.
Chapter 2
Jazz
2.1
Jazz Collaborative Tool
Jazz is a team collaboration platform for the full software development life cycle development. It is designed to support seamless integration of tasks across all phases of the software life cycle. It enables small teams within one project group to work together [1].
It is collaborative software development environment which has features for requirement analysis, shared work spaces, team organization, task management, bug management.
2.1.1 Design Goals
The Jazz Platform is designed and built to:
1. Support seamless integration of tasks across the software life cycle.
2. Facilitate team collaboration and coordination throughout the software life cycle.
3. Provide an extensible platform.
4. Support globally distributed development teams.
5. To scale well from small teams to large teams.
6. Maintain audit trails and automate bookkeeping so that teams are accountable.
7. Support UI integrations (IDE, web browser) that fit the needs of customers.
8. Foster a broad ecosystem of tool providers, including independent software vendors (ISVs).
2.2
Jazz Architecture
A software project requires various tools for its complete development cycle. The different tools cannot work together since each of them have their own interfaces, vocabularies. It is difficult to integrate tools [1]. Jazz is a platform which can integrate different tools pertaining to different phases of the life cycle together.
The main goal of Jazz is to integrate various diverse tools together to provide an integrated experience to the user. The Jazz Integration Architecture (JIA)integrates diverse tools. It has a Jazz Team Server (JTS) at the center with various Jazz Foundation Services (JFS) hosted.
IBM Rational Software Development Conference 2008
4 © Copyright 2008 IBM Corporation. All rights reserved.
Jazz and Team Concert
Jazzis a technology platform
Rational Team Concertis the first Jazz based product
Figure 2.1: Jazz Technology and Team Concert. Picture taken from [10]
2.2.1 Jazz Team Server
2.2.2 Jazz Foundation Services
The Jazz Web Services are a set of RESTful services-REST APIs. The different services avail-able are Discovery service, Administration services, Process services, Storage services, Query services, Presentation services, Data warehousing services and Collaboration services.
2.3
Rational Team Concert Architecture
Rational Team Concert is the first Jazz based product. The Rational Team Concert clients communicate with Jazz server using RPC services and Restful services over HTTP.
IBM Rational Software Development Conference 2008
5
© Copyright 2008 IBM Corporation. All rights reserved.
Team Concert
Project, Teams, Users
Process enactment, customization, role based Permissions
In-context Collaboration, Events, Presence
Reports Dashboards (project, team, personal)
Build
Continuous integration Build engineWork Item and Change Set Traceability
Run Personal Builds
Integration with Build Forge
SCM
Change sets Suspending changes Workspaces, Streams Components, Baselines Snapshots ClearCase Connector, SVN BridgeWork Items
Defects, Enhancements Task tracking Approvals Iteration planning Workflow customization ClearQuest ConnectorProject Health
Reports Dashboards (project, team, personal)Rational Team Concert
2.3.1 Rational Team Concert Server
It is a web based application. It supports two kinds of servers; Apache Tomcat and IBM Websphere. The client side scripting is done in Javascript. The server takes requests in the form of URLS and invokes Rest web services with responses in XML or JSON.
All user interface logic is in the client browser and logic and execution state resides in the server. Due to this the user interface is more responsive than the traditional websites.
It is more scalable. The services are stateless since all the session data is not sent back and forth across the wire and client-side caching optimizes the fetching of cachable items from the repository.
2.3.2 Rational Team Concert Client
The different clients that are present are the Eclipse client, Command line clients, web clients.
2.4
Jazz Team Server Components
The Jazz Team server comprises of two or three primary components:
1. Application server: It provides the servlet container to run the executable code and return the results to the user. Currently Apache Tomcat and web sphere are supported.
2. Database server: It is a relational database. It stores user information, source code, project information, work items. Currently DB2, Derby and Oracle are supported.
3. Reverse Proxy Server: RTC can be configured to utilize reverse proxy server for additional security.It is an optional component.
2.5
Jazz proxy caching
Jazz can work with any Http based proxy caching. Results marked as ’cacheable’ can be cached and they are requests for getting frozen file content. When we load or update workspace, the content objects are received in parallel through the proxy server. Proxy caching helps improve the response time.
2.5.1 Forward proxy
2.5.2 Reverse Accelerator Proxy
Chapter 3
Performance Model and Simulation
3.1
Performance Model
We have designed a performance model for the Rational Team Server based on the data available and discussions with members of the Jazz Group. The model is described as:
1. Closed queuing model - modeled as a closed queuing model since the users would keep moving continuously through the queuing system. A user is modeled as an entity moving through the system. There is a limit on the maximum number of users that can access system. When one user leaves the system another user can replace that user.
2. Finite population - The system has an upper bound on the maximum number of concur-rent users in the system.
3. Continuous Time The system would be monitored for a continuous time
4. Discrete State Each state depends on the number of jobs in the queue
5. Probabilistic Even though the input is the same, the output would change if the factors are changed(like number of processors)
6. Dynamic System changes with time
Clients Switched Ethernet
Network Gateway
WAN Cache
Dispatcher
IDirectWrit ingConSer vice,get()
IFeedServi ce
ITeamBuil dService
IScmServi ce
IDirectWrit ingContSe rvice.put()
IQuerySer vice
IReportRe stService
IQueryRep ositorySer
vice
Database
Switched Ethernet
Network Gateway
3.2
Model
3.2.1 RTC Clients
Only ’Developers’ have been considered and not ’Contributors’. ’Contributors’ are web clients whereas ’Developers’ are the RTC Clients. Arrivals of users have been considered deterministic. Each user will think for a particular time before making a request. The think time would be exponential.
RTC Client is modeled as a pure delay queue with service service time being the ’think time’. Each user makes number of requests to the different services during its time in the system. Currently IBM has put an upper bound on the number of clients in the system.
It will be a closed model since the number of clients will be constant at a certain depending on the number of licenses.
3.2.2 Proxy cache
It can be squid or Apache Httpd proxy server. It can be modeled as a load dependent or multiple processors. We have assumed that the proxy cache server has only one processor. It has an infinite queue. The number of processors can be taken as input from the user since it would be dependent on the place where they are working. The cache always stores small popular files.
3.2.3 WAN
The WAN is modeled as a simple queue with exponential service time depending on the type of request. We will add external traffic to find the performance parameters for the different external traffic rates. It cannot be a bottleneck since then the performance metrics of the Jazz server would not matter
Communication delay in Wan depends on time, sites where the communication has to occur, size of the document network bandwidth, no. of hops, network traffic. It would be difficult to assume delay for the WAN. It cam be taken as the input from the user since it would require extensive study of WAN. We have assumed slow Latency WAN with 150ms latency.
3.2.4 Network Gateway
3.2.5 Switched Ethernet
Is modeled as a single processor queue. There is an incoming queue for requests and an outgoing queue for response. It has an exponential service of 5 milliseconds. IBM also considered this value when taking performance results in their controlled environment.
3.2.6 Web services
Each of the web services is modeled as a separate queue with the average service times we obtained from the IBM data. IBM had collected data regarding the total time used by the service and the number of calls made to the service in the first week of development for 62 hours. Using that data we obtained the average service time of each service. The service time is assumed to have exponential distribution. They would have infinite queues. All these services share the processors power of the RTC server [18, 25, 5].
We will be considering only those services which put maximum load on the server and are related to all the phases of the project. IBM has shortlisted the most popular services based on their data collection. The calls to these services will be the different kinds of requests that a user can make.
IBM has also given data normalized for a 750 developer run for one hour. Based on that we obtained data as to how many requests for each service would one user make in one hour. The client ’think time’ has been adjusted in such a way that one user should make that many types of requests in one hour.The services will be modeled as separate queues as they have no interaction with each other.
The different types of requests considered are :
1. IDirectWritingContentService.get()- Called during automated builds, accepting change sets, loading attachments, loading repository workspaces. It is a heavy hitter in both number of times called and cumulative time.
2. IFeedService - Fetching RSS feeds and events from the server. It drives the Team central, Feeds view and dashboards.
3. ITeamBuildService - Called during automated builds when status, results and downloads are uploaded.
4. IScmService - Called when refreshing Pending Changes View, browsing change sets, com-paring streams, repository workspaces and snapshots.
6. IQueryService - Creating and running queries.
7. IReportRestService - Fetching reports and report parameters in dashboards and rich clients.
3.2.7 Data server
The data server is a relational database. It will have an infinite queue. During their data collection for performance analysis IBM considered the delay between RTC server and the database to be 1-2 milliseconds. We have considered the data server will have exponential service time of 1 ms. The data server is assumed to be fast compared to the RTC server.
3.2.8 Inputs
1. No of users (number of requests)
2. Distribution of the users
3.2.9 Outputs
1. Response time
2. Transactions per second
3. Resource Utilization
4. Bottleneck analysis
3.2.10 Factors
1. Number of Processors
2. Cache - Percentage of Hit Rate
3. WAN - External traffic on it (low, medium, high)
3.2.11 Advantages
1. Performance prediction
2. Bottleneck identification
Table 3.1: Services Data
Service Service Time
Service Name Service Time(seconds)
IDirectWritingContentService.get() 0.0052
IFeedService 0.1517
ITeamBuildService 0.0383
IScmService 4.229
IDirectWritingContentService.put() 0.5626
IQueryService 0.0804
IReportRestService 5.262
IQueryRepositoryService 0.13029
Table 3.2: User Inputs
Service Service Time
Service Name Number of requests
IDirectWritingContentService.get() 1280.1221
IFeedService 32.123
ITeamBuildService 52.745
IScmService 14.33609
IDirectWritingContentService.put() 3.2254
IQueryService 19.94
IReportRestService 1
IQueryRepositoryService 7.68
3.2.12 Service Time
These values are calculated from the data given by IBM regarding the cumulative time the service spent on the server and the number of times the service was called [18].
3.2.13 User Inputs
Chapter 4
Performance Results
We are using Arena as the Simulation platform, for simulating the performance model. Code is written in VBA [17] to automate the collection of results. We are also giving a mathematical solution to our performance model using Multi class Mean Value Analysis. We are comparing the results obtained from simulation and multiclass MVA.
Different services are hosted on the Rational Team Concert Server which share the processing power of the server. The RTC server is modeled as a queue with different services being modeled as different classes of requests.
4.1
Mean Value Analysis with Multiple classes of Requests
The queuing model can be solved using ’Mean Value Analysis’ for MultiClass requests. The algorithm is implemented in Java and results are obtained for different concurrent users in the system [4].
Multiclass Mean Value analysis works by solving a set of equations recursively. There are a
fixed number of requests Nr for each class of requests r which are moving through the system.
The load intensity vector is represented as
− →
N = (−N→1,
−→ N2,
−→ N3
−→ N4...,
−→
NR) (4.1)
Figure 4.1: Design of the RTC server in simulation.
Let R0i,r−→N stand for the residence time of classr requests at queueiwhen number of class
1 requests isN1, number of class 2 requests isN2, ... and number of classR requests is NR.
The residence time equations for multiclass queuing networks have a complex dependency on queue lengths for different load intensity values. To compute residence time values for load intensity vector−→N = (−N→1,
−→ N2,
−→ N3
−→ N4...,
−→
NR) we need to compute queue lengths for load intensity
vectors −→N −−N→1,
− → N −−→12,
− → N −−→13
− →
N −−→14...,
− →
N −−1→R . Due to these dependencies the number of
computations for the multiclass MVA goes up very fast.
An approximation was proposed by Schweitzer [28] for the ni,r(
− →
N −−→1r) needed to compute
ni(
− →
N −−→1r). It is based on the assumption that number of class r requests in each queue
increases proportionally with with number of class r customers in the queuing network.
ni,r(
− →
N −−→1r)/ni,r(
− →
N) = (Nr−1)/Nr (4.2)
ni,r(
− →
N −−→1r) = ((Nr−1)/Nr)∗ni,r(
− →
N) (4.3)
To start we initialize the queue lengths by equally distributing the number of requests per
class over all queues visited by that class. If class r visits only Kr of K queues, initial value
forni,r would be NR/KR. We use the residence time equations, throughput equations, queue
length equation to get estimates of queue lengths. Iterations continue till maximum relative error in queue lengths between successive iterations is less than tolerance specified by the user.
4.1.1 Approximation for multiple resource queues
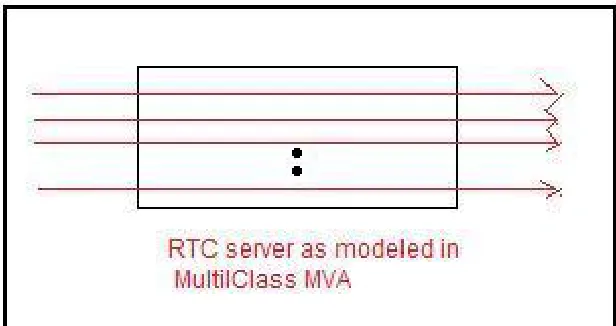
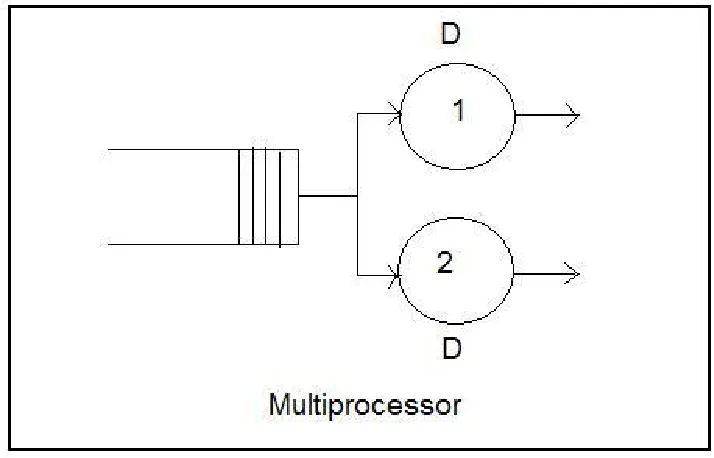
Since the processors are shared between number of service queues we use the approximation by Seidmann et al. [2] that avoids convergence problems. Using load dependent resources in closed multiclass models may pose convergence problems to the iterative MVA solution. A queue with
m resources and service demand D at each resource should be replaced with two queues in
tandem. The first one is a single resource queueD/mwhich worksm times faster. The second
is a delay queue with service demand of D(m−1)/m. So the total time spent at these two
Figure 4.3: Multiple resource queue
4.1.2 Implementation
1. Multi Class Mean Value Analysis: The algorithm is implemented in Java. Service
de-mands, Number of class r requests and the tolerance level is taken as an input from the
user. Tolerance is taken is 0.05
2. Simulation: The model is simulated using the Arena simulator. Code is written in VBA to collect the automate the collection of the results [17]. Results are collected in Excel files and analyzed.
4.1.3 Algorithm
The Multiclass Mean Value Analysis algorithm is described in Algorithm 1:
4.2
Simulation
Simulation is done to understand how a system would behave in real world scenarios. We have designed various scenarios to understand the behavior of the system under various conditions. Each scenario is described and the graphs are plotted.
4.2.1 Scenario 1
We will be studying the system when number of concurrent users in the system goes on increas-ing from 1 to 350. System modeled as:
1. Two processors shared by various service queues in RTC server
2. Database has two processors
3. Number of users in the system goes on increasing from 1 to 350
4. Load is put on the server as would be generated when that many number of users are present in the system.
5. Each client thinks for sometime then sends a request which passes through the local switched Ethernet, then the router, then goes to the service requested, database and then the response comes back to the client.
Algorithm 1 Multiple Class Mean Value Analysis Input Parameters:
• Service Demand for Class r for each queuei: Dir
• Number of requests for Class r : N r
• Maximum absolute error in queue length :
Output:
• Mean Queue Length for Class r for each queue : ni, r(−→N)
• Mean Residence Time for Class r for each queue : R’i, r(−→N)
• Throughput for class r : Xo, r(−→N)
Initialize:
− →
N =(N1, N2, N3, ...N n)
for r:=1 toR do
fori:= 1 to K do
if Di,r 0 then
nei,r(−→N) =Nr/Kr
end if end for end for
Iteration Loop: Repeat
Make the queue length estimates, nei,r(−→N), be the current queue length values :
for r:=1 toR do
fori:=1 to K do
ni,r(
− →
N) =nei,r(−→N) end for
end for
for r:=1 toR do
Begin
fori:=1 to K do
Begin
Compute the queue length at queue i with one less class r request using
Schweitzer’s approximation
ni(
− →
N -−→1r) = (Nr−1 /Nr)ni,r(
− →
N) +PR
t=1&t6=rni,t(
− → N)
Compute the residence time for class r at queue i.:
R0i,r(−→N) =Di,r /* delay*/
or
R0i,r(−→N) =Di,r[1+ni(
− →
N - −→1 )] /* queuing*/ end for
Compute the throughput for class r.
X0,r(
− →
N) =Nr /(PKi=1R0i,r(
Compute the new estimates for queue lengths:
for r:=1 toR do
fori:=1 to K do
nei,r(−→N) =X0,r(
− →
N) X (R0i,r(−→N) end for
end for
Until maxi,r ([nei,r(
− →
N) - ni,r(
− →
N)] /nei,r(−→N))<
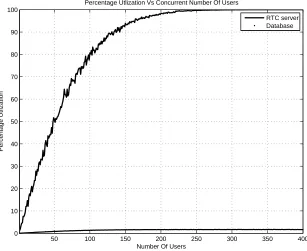
The second graph shows us the RTC server utilization and Database percentage utilization w.r.t number of users. From the utilization graph we can see that the RTC server utilization is almost 100% for 200 users. Peak utilization of database is 1.7%. Utilization of the database is low since we assume that the database is very fast compared to RTC server. IBM has assumed the delay between the server and database to be 1-2 ms. We have assumed the service time of the database to be 1ms. The utilization of the RTC server increases very fast. RTC server is the bottleneck in this case.
The third graph shows us average service transactions per second w.r.t the number of users in the system. The graph stabilizes at around 200 users in the system with 32-33 service transactions per second.
50 100 150 200 250 300 350 0
2 4 6 8 10 12
Number Of Users
Mean Response Time(Seconds)
Response Time Vs Concurrent Number Of Users
Simulation Mean Value Analysis
Figure 4.5: Scenario 1: Comparision between MultiClass MVA and Simulation for Response
Time
50 100 150 200 250 300 350 400
0 10 20 30 40 50 60 70 80 90 100
Number Of Users
Percentage Utlization
Percentage Utlization Vs Concurrent Number Of Users
RTC server Database
50 100 150 200 250 300 350 400 0
5 10 15 20 25 30 35 40
Service transactions per Second Vs Concurrent Number Of Users
Service transactions per second
Number Of Users
Figure 4.7: Scenario 1: Service calls per Second
140 160 180 200 220 240 260
1 2 3 4 5 6 7 8 9 10
Confidence Intervals
Number of Concurrent users
Mean Response Time (seconds)
4.3
Scenario 2
Scenario 2 is same as Scenario 1 except that the number of processors to be shared between the services is 4.
1. Four processors shared by various service queues in RTC server
2. Database has two processors
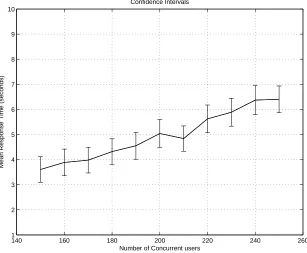
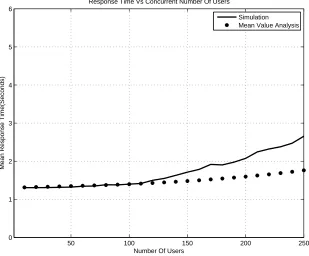
The first graph shows us the comparison between the mean response time obtained using simulation and mean value analysis as the number of concurrent users in the system goes on increasing from 10 to 250. We see that the results are not quite matching since MVA is an approximate closed form solution and not an exact solution.
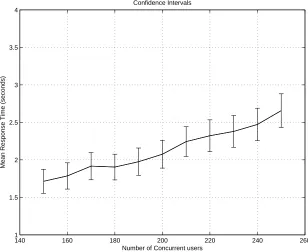
The second graph shows us the confidence intervals of the mean response time. The upper and the lower bounds of the confidence intervals is +0.5 and -0.5 of the mean response time.
50 100 150 200 250
0 1 2 3 4 5 6
Number Of Users
Mean Response Time(Seconds)
Response Time Vs Concurrent Number Of Users
Simulation Mean Value Analysis
Figure 4.9: Scenario 2: Comparision between MultiClass MVA and Simulation for Response
140 160 180 200 220 240 260 1
1.5 2 2.5 3 3.5 4
Confidence Intervals
Number of Concurrent users
Mean Response Time (seconds)
Figure 4.10: Scenario 2: Confidence intervals
4.4
Scenario 3
Scenario 3 is same as Scenario 1 except that the number of processors to be shared between the services is 6.
1. Six processors shared between the services on the RTC server
2. Two processors the database
The first graph shows the response time Vs number of users in the system. It shows the comparison between multiclass MVA and simulation. The response time grows differently than the simulation since MVA is an approximate closed form solution and not an exact solution.
The third graph shows the RTC percentage utilization and database utilization Vs number of users in the system. The RTC server utilization reaches 100% at around 300 users in the system. Database utilization is low compared to RTC server utilization. We see that RTC server is still the bottleneck in this case.
0 50 100 150 200 250
0 0.5 1 1.5 2 2.5 3 3.5 4
Number Of Users
Mean Response Time(Seconds)
Response Time Vs Concurrent Number Of Users
Simulation Multiclass MVA
0 50 100 150 200 250 300 350 400 0
10 20 30 40 50 60 70 80 90 100 110
Service transactions per second Vs Concurrent Number Of Users
Service transactions per second
Number Of Users
Figure 4.12: Scenario 3: Service transactions per second when 6 processors are present in the RTC server
0 50 100 150 200 250 300 350 400
0 10 20 30 40 50 60 70 80 90 100
Number Of Users
Percentage Utlization
Percentage Utlization Vs Concurrent Number Of Users
CPU Database
4.5
Scenario 4
A WAN and a cache is added to the network. We see how the cache will improve the performance of the system.
1. Two processors are shared between the services hosted on the RTC server.
2. There is an external traffic on the WAN of 10,000 requests per hour.
3. Database has 2 processors.
4. Cache has exponential service time with mean of 5 milliseconds.
5. WAN has exponential service time with mean of 150 milliseconds.
The first graph shows response time of Cache and how it changes as the hit rate increases from 1 to 90%. We see that the even at 90% hit rate the response time using cache is very fast. There are some objects in the data that are not ’cachable’. So we have assumed that the maximum hit rate can be 90%. We have also give comparison for cache response time between simulation and Multi class Mean Value analysis.
The second graph shows total response time is request goes to the RTC server and how it changes as the hit rate increases from 1 to 90%. We see that the response time using the RTC server decreases with increase in hit rate.
The third graph shows resource utilization of the RTC server and cache and how it changes as the hit rate increases from 1 to 100%.
4.6
Scenario 5
A WAN and a cache is added to the network. There is a heavy external traffic on the WAN of 20,000 requests per hour. We see how the cache will improve the performance of the system.
0 10 20 30 40 50 60 70 80 90 5
10 15 20 25
Hit Rate
Mean Response Time(Milliseconds)
Mean Response Time Vs % Hit Rate
Simulation MVA
Figure 4.14: Scenario 4: Response Time of Cache with external traffic of 10000 requests per
hour
10 20 30 40 50 60 70 80 90
0 1 2 3 4 5 6 7
Response Time Vs % Hit Rate
Mean Response Time(Seconds)
Hit Rate
0 10 20 30 40 50 60 70 80 90 100 0
10 20 30 40 50 60 70 80 90 100
Hit Rate
Resource Utilization
Resource Utlization Vs % Hit Rate
RTC server Cache
Figure 4.16: Scenario 4: Utilization of Resources with external traffic of 10000 requests per
hour
2. There is a heavy external traffic on the WAN of 20,000 requests per hour.
3. Database has 2 processors.
4. Cache has exponential service time with mean of 5 milliseconds.
5. WAN has exponential service time with mean of 150 milliseconds
The first graph shows the response time of Cache and how it changes as the hit rate increases from 1 to 90%. We see that the even at 90% hit rate the response time using cache is very fast. The second graph shows response time of the RTC server and how it changes as the hit rate increases from 1 to 90%. We see that the response time using the RTC server decreases with increase in hit rate.
0 10 20 30 40 50 60 70 80 90 10
10.5 11 11.5 12 12.5 13 13.5 14 14.5 15
Mean Response Time Vs % Hit Rate
Mean Response Time(Milliseconds)
Hit Rate
Figure 4.17: Scenario 5: Response Time of Cache with external traffic of 20000 requests per
hour
0 10 20 30 40 50 60 70 80 90
0 1 2 3 4 5 6 7
Response Time Vs % Hit Rate
Mean Response Time(Seconds)
Hit Rate
0 10 20 30 40 50 60 70 80 90 100 0
10 20 30 40 50 60 70 80 90 100
Hit Rate
Resource Utilization
Resource Utlization Vs % Hit Rate
RTC server Cache
Figure 4.19: Scenario 5: Utilization of resources with external traffic of 20000 requests per
Chapter 5
Conclusion and Future Work
This chapter summarizes the work and suggests extensions for future work.
5.1
Summary
In this thesis we have designed a performance model for the Jazz Development Environment. We have analyzed the data provided by IBM for various services and user patterns and modeled the system accordingly.
The main contributions of our work are :
1. We have successfully modeled the Jazz development environment as a closed queuing network.
2. The queuing model has been simulated for variety of scenarios by changing various factors in the system like number of processors and degree of caching.
3. We have also provided an approximate mathematical solution using Multi Class Mean Value Analysis.
4. We have compared the results from simulation and Multi Class Mean Value Analysis. The results do not match exactly since Multi Class MVA is an approximate closed form solution. Comparison is made for certain selective cases.
5. Our performance model can be used for predicting response time, service calls per second, resource utilizations for Rational Team server under various load conditions.
5.2
Future Work
Jazz is a team collaboration platform for software development. Future work in this area would be to use the system in a real setting and collect the performance results for various scenarios. We were not able to do actual student trials since it would require large number of students, to collect results for the scalability analysis of the system.
REFERENCES
[1] http://jazz.net/.
[2] P. Schweitzer A. Seidmann and S. Shalev-Oren. Computerized closed queuingnetwork
models of flexible manufacturing systems. Large Scale Syst. J., 12:91–107, 1987.
[3] Thomas J. Allen. Managing the Flow of Technology: Technology Transfer and the
Dis-semination of Technological Information Within the R&D Organization, volume 1 ofMIT Press Books. The MIT Press, 1984.
[4] Daniel A.Menasce and Virgilio A.F. Almeida. Capacity Planning for Web Performance:
Metrics, Models and Methods. Prentice Hall,PTR, 1998.
[5] John Reinstrom Mark Gravina Sentella Cystrunk Anuradha Ramamoorthy, Bryan Miller.
http://jazz.net/:IBM Rational Team Concert Version 1.0 Server Sizing Guide.
[6] G Booch and A. Brown. Collaborative development environments.Advances in Computers,
59, 2003.
[7] Mark C. Chu-Carroll and Sara Sprenkle. Coven: brewing better collaboration through
software configuration management. InSIGSOFT ’00/FSE-8: Proceedings of the 8th ACM
SIGSOFT international symposium on Foundations of software engineering, pages 88–97, New York, NY, USA, 2000. ACM.
[8] Ben Collins-Sussman, Brian W. Fitzpatrick, and C. Michael Pilato. Version Control With
Subversion - The Official Guide And Reference Manual. CreateSpace, Paramount, CA,
2009.
[9] Paolo Cremonesi, Emilia Rosti, and Giuseppe Serazzi. Xaba: Exact, approximate, and
asymptotic solvers for multi-class closed queueing networks. InTOOLS ’00: Proceedings
of the 11th International Conference on Computer Performance Evaluation: Modelling Techniques and Tools, pages 71–85, London, UK, 2000. Springer-Verlag.
[10] Jazz Technical Lead Erich Gamma, Distinguished Engineer. http://jazz.net/:Globally
Dis-tributed Software Development.
[11] Roy T. Fielding and Richard N. Taylor. Principled design of the modern web architecture. In ICSE ’00: Proceedings of the 22nd international conference on Software engineering, pages 407–416, New York, NY, USA, 2000. ACM.
[12] Yongqin Gao and Greg Madey. Towards understanding: a study of the sourceforge.net
community using modeling and simulation. In SpringSim ’07: Proceedings of the 2007
[13] Ada Gavrilovska, Karsten Schwan, and Van Oleson. Adaptable mirroring in cluster servers.
In HPDC ’01: Proceedings of the 10th IEEE International Symposium on High
Perfor-mance Distributed Computing, page 3, Washington, DC, USA, 2001. IEEE Computer
So-ciety.
[14] James D. Herbsleb. Global software engineering: The future of socio-technical
coordina-tion. InFOSE ’07: 2007 Future of Software Engineering, pages 188–198, Washington, DC,
USA, 2007. IEEE Computer Society.
[15] Chih-Wei Ho, Somik Raha, Edward Gehringer, and Laurie Williams. Sangam: a distributed
pair programming plug-in for eclipse. In eclipse ’04: Proceedings of the 2004 OOPSLA
workshop on eclipse technology eXchange, pages 73–77, New York, NY, USA, 2004. ACM.
[16] Raj Jain. The Art Of Computer Systems Performance Analysis. Wiley, 1992.
[17] W. David Kelton, Randall P. Sadowski, and David T. Sturrock. Simulation with Arena.
McGraw-Hill series in industrial engineering and management science. McGraw-Hill Higher Education, Boston [u.a.], 4. ed., internat. ed. edition, 2007.
[18] Jean-Michel Lemieux. http://jazz.net/:Enterprise performance and scalability testing.
[19] Michael N. Huhns Munindar Paul Singh. Service-oriented computing: Semantics,
Pro-cesses, Agent. Wiley, 2005.
[20] D. Neuse and K. Chandy. Scat: A heuristic algorithm for queueing network models of
computing systems. In SIGMETRICS ’81: Proceedings of the 1981 ACM SIGMETRICS
conference on Measurement and modeling of computer systems, pages 59–79, New York,
NY, USA, 1981. ACM.
[21] Gary M. Olson and Judith S. Olson. Distance matters.Hum.-Comput. Interact., 15(2):139–
178, 2000.
[22] Raif O. Onvural. Survey of closed queueing networks with blocking. ACM Comput. Surv.,
22(2):83–121, 1990.
[23] Raif O. Onvural and H. G. Perros. Approximate throughput analysis of cyclic queueing
networks with finite buffers. IEEE Trans. Softw. Eng., 15(6):800–808, 1989.
[24] M. Reiser and S. S. Lavenberg. Mean-value analysis of closed multichain queuing networks.
J. ACM, 27(2):313–322, 1980.
[25] Scott Rich. http://jazz.net/:Scaling to new heights with Rational Team Concert 2.0.
[26] J. A. Rolia and K. C. Sevcik. The method of layers. IEEE Trans. Softw. Eng., 21(8):689–
700, 1995.
[27] Alex Rousskov and Valery Soloviev. A performance study of the squid proxy on http/1.0.
[28] P.J. Schweitzer. Approximate analysis of multi-class closed networks of queues. In Pro-ceedings of the International Conference on Stochastic Control and Optimization, pages 25–29, Amsterdam, Netherlands, 1979.
[29] Bikram Sengupta, Satish Chandra, and Vibha Sinha. A research agenda for distributed
software development. In ICSE ’06: Proceedings of the 28th international conference on
Software engineering, pages 731–740, New York, NY, USA, 2006. ACM.
[30] Swaminathan Sivasubramanian, Guillaume Pierre, Maarten van Steen, and Gustavo
Alonso. Analysis of caching and replication strategies for web applications. IEEE
In-ternet Computing, 11(1):60–66, 2007.
[31] C. Murray Woodside. Throughput calculation for basic stochastic rendezvous networks.
![Figure 2.1: Jazz Technology and Team Concert. Picture taken from [10]](https://thumb-us.123doks.com/thumbv2/123dok_us/1200489.1150757/19.612.191.505.346.523/figure-jazz-technology-team-concert-picture-taken.webp)
![Figure 2.2: Rational Team Concert.Picture taken from [10]© Copyright 2008 IBM Corporation](https://thumb-us.123doks.com/thumbv2/123dok_us/1200489.1150757/20.612.98.531.298.568/figure-rational-team-concert-picture-taken-copyright-corporation.webp)