A Study of Static Analysis for Fault Detection in Software
Jiang Zheng1, Laurie Williams1, Nachiappan Nagappan2, Will Snipes3, John Hudepohl3, Mladen Vouk1
1
Department of Computer Science, North Carolina State University, Raleigh, NC, USA
{jzheng4, lawilli3, vouk}@ncsu.edu
2
Microsoft Research, Redmond WA 98052
3
Nortel Networks, Software Dependability Design (SWDD), Research Triangle Park, NC, USA
{wbsnipes, hudepohl}@nortelnetworks.com
Abstract
No single software fault-detection technique is capable of addressing all fault-detection
concerns. Similar to software reviews and testing, static analysis tools (or automated static
analysis) can be used to remove defects prior to release of a software product. To determine to
what extent automated static analysis can help in economic production of a high-quality product,
we have analyzed static analysis faults and test and customer-reported failures for three
large-scale industrial software systems developed at Nortel Networks. The data indicate that
automated static analysis is an affordable means of software fault detection. Using the
Orthogonal Defect Classification scheme, we found that automated static analysis is effective at
identifying Assignment and Checking faults, allowing the later software production phases to
automated static analysis appears to be produced by a few key types of programmer errors.
Statistical analysis results indicate that the combination of the number of automated static
analysis faults and the number of test failures can be effective to identify problem modules.
Our results indicate static analysis tools are complementary to other fault-detection techniques
for the economic production of a high-quality software product.
1. Introduction
No single fault-detection technique is capable of addressing all fault-detection concerns [28].
One such technique is static analysis, the process of evaluating a system or component based on
its form, structure, content, or documentation [12] and does not require program execution.
Inspections are an example of a classic static analysis technique that rely on the visual
examination of development products to detect errors1, violations of development standards, and other problems [12]. Tools are increasingly being used to automate the identification of
anomalies that can be removed via static analysis, such as coding standard non-compliance,
uncaught runtime exceptions, redundant code, inappropriate use of variables, division by zero,
and potential memory leaks. We term the use of static analysis tools automated static analysis
(ASA). Henceforth, the term “inspections” is referred to as manual inspections. ASA may
enable software engineers to fix faults before they surface more publicly in inspections or as test
and/or customer-reported failures. In this paper, we report the results of a study into the value of
ASA as a fault-detection technique in the software development process.
1
The study was a research partnership between North Carolina State University and Nortel
Networks. Since 2001, Nortel has included inspection and ASA in its development process for
over 33 million lines of code (LOC). In our research, we examined defect data from three
large-scale Nortel software products (over three million LOC in total) written in C/C++ that
underwent various combinations of inspection and ASA. The goal of the study was to determine
whether automated static analysis can help an organization economically produce high-quality
products.
Using the Goal-Question-Metric (GQM) paradigm [2], we broke this research goal into six
questions. Each of these questions, including the metrics collected and analyzed to formulate the
answer, will be discussed in detail in Section 4 of this paper. The questions are as follows:
• Q1: Is ASA an economical means of software fault detection?
• Q2: Will my delivered product be of higher quality if ASA is part of the development
process?
• Q3: How effective is ASA at detecting faults compared with inspection and testing?
• Q4: Can ASA be helpful for identifying problem modules?
• Q5: What classes of faults and failures are most often detected by ASA, by inspection,
or by testing? What classes of defects escape to customers?
• Q6: What kinds of programmer errors are most often identified via ASA?
The rest of this paper is organized as follows. Section 2 discusses the background and
related work. Section 3 discusses the implementation of ASA at Nortel, our data collection and
analysis procedures, and limitations of our study. Section 4 reviews our findings on each of the
2. Background and Related Work
ASA can be used as an added filter to remove certain types of faults. ASA tools automate
the identification of certain types of anomalies, as discussed above, by scanning and parsing the
source text of a program to look for a fixed set of patterns in the code. ASA includes control flow
analysis, data flow analysis, interface analysis, information flow analysis, and path analysis of
software code. There is a range of programmer errors which can be automatically detected by
ASA, and there are some that can never be detected by ASA [21, 28]. Additionally, one study of
ASA tools indicates that each tool seems to find different, sometimes non-overlapping, bugs [25].
Although detected anomalies are not always due to actual faults, often they are an indicator of
errors.
An important benefit of ASA tools is that they do not necessitate execution of the subject
program yet infer results applicable to all possible executions [21]. In this context, ASA can
complement the error-detection facilities provided by language compilers. ASA tools are
particularly valuable for programming languages like C that do not have strict type rules, and the
checking the C compiler can do is limited.
There are a range of ASA tools and services deployed for C/C++ code. For example,
FlexeLint2 checks C/C++ source code to detect errors, inconsistencies, non-portable constructs, and redundant code. FlexeLint is a Unix-based tool (akin to the Window-based PC-lint).
Reasoning3’s Illuma is an automated inspection service that finds defects in C/C++ applications. Organization sends their code to Reasoning who performs the ASA, removes false positives, and
produces a report. Illuma identifies reliability defects that cause application crashes and
data-corruption. Examples of the C/C++ error classes include: NULL pointer dereferencing; out
of bounds array access; memory leaks; bad de-allocation; and uninitialized variables. Klocwork4 has two ASA tools:inForce performs its automated inspection of source code to supply metrics
for identifying potential defects, security flaws, and code optimizations; and GateKeeper
analyzes the source code architecture strengths and weaknesses and provides assessment details
on code quality, hidden defects, and maintainability costs. Types of defects identified include
actual relationships among modules (as compared to intended relationships), code clusters
(cyclic relationships), high-risk code files and functions, potential logical errors, and areas for
improvement.
PREfix [18] analysis is based on the call graphs of a program which are symbolically
executed. The PREfast [18] tool is a “fast” version of the PREfix tool where certain PREfast
analyses are based on pattern matching in the abstract syntax tree of the C/C++ program to find
simple programming mistakes. PREfix/PREfast are used to find defects, such as uninitialized use
of variables, NULL pointer dereferences, the use of uninitialized memory, and double freeing of
resources.
An important issue with the use of ASA tools is the inevitability of the tool reporting
significant amounts of false positives or bugs that the program does not contain upon a deeper
analysis of the context. There can be as many as 50 false positives for each true fault found by
some static analysis tools [23]. The FindBugs tool [10] reports a low of only 50% false positives.
Often, static analysis tools can be customized and filters can be established so that certain classes
of faults are not reported, reducing the number of false positives. Some organizations, such as
Nortel, contract a pre-screening service to identify and remove false positives in the static
analysis output prior to involvement by their own programming teams.
3. Case Study Details
4
In this section, we describe the details of ASA used at Nortel and of the products included in
the data analysis, fault classification schemes and limitations of the case study.
3.1. ASA at Nortel
Beginning in 2001, Software Dependability Design (SWDD) group at Nortel began to work
with development teams to include ASA in their development process prior to releasing products
to customers. Depending upon the team, ASA could be done prior to inspection, after inspection
but prior to system test, or during system test. For most product groups, the transition to using
ASA was done in two phases: start-up and in-process.
In the start-up phase, the SWDD group worked closely with the transitioning team to
establish a clean baseline of the product. The most recently-released product (considered Release
N-1) undergoes ASA. Because this initial static analysis run for this product is likely to yield an
excessive amount of false positives, the total list of warnings is sent to a pre-screening service.
The SWDD has an extended, usually contracted, core team of pre-screeners. Nortel has also
developed centralized, in-house expertise in the use of static analysis tools and in the screening
of the faults. Similar to inspections, the efficacy of static analysis pre-screening is dependant
upon the screeners’ skills and experiences. However, the skill and experience can be
programming language-centric rather than domain-specific.
The pre-screeners scrutinize the raw warnings and read code to analyze why the warnings
are generated. Additionally, we noticed that the screeners recorded some obvious errors in the
code that could not have been detected by the ASA tools. For example, faults with type "Logic
Error and Typo" and "Wrong Output Message" were noted. These types of faults could not be
caught by a tool and must have been identified by the screeners. However, only a few such faults
reduce the false positive rate to approximately 1%. The pre-screening also may have eliminated
some real faults, however, these false negatives are difficult to identify.
Individual screeners submit their findings which are merged into one report. The SWDD
and development teams receive the post-screening report and fix the true faults that have been
identified, beginning with the most severe faults. Some defects are left to maintenance releases
or later releases to be fixed because they do not impact customer observable behavior or critical
functions. Once the higher priority true ASA faults have been fixed (considered to be the release
N), the product undergoes ASA again (on release N) to make sure the defects were fixed. The
release N is the “clean baseline”. The start-up phase typically took between two and six
months, depending on the team's release cycles.
Once the team has been through the start-up phase, ASA is an additional fault removal filter
in the development process, and ASA is done in-process. Only new and changed code undergoes
ASA from this point forth, and ASA is then often run by the developers without the involvement
of pre-screeners. Depending upon the developer, the frequency of doing ASA varies. ASA can
be run when a component is complete, or a developer can run the ASA tools more incrementally
as code is being developed.
Researchers and practitioners in Japan used a similar phased approach of introducing ASA
prior to system test [17]. At first, a support group worked closely with development
organizations, introducing ASA into their process, developing filters to reduce false positives,
and prioritizing ASA faults to fix. Ultimately, development groups used ASA more
autonomously. Through this process, they reduced static analysis-detectable faults from a high of
11.8% of system test failures to 0% [17].
We collected and analyzed fault data of three large-scale network service products. Data
analysis consisted of faults reported by over 200 inspectors and testers, and by customers, for
over three million LOC written in C/C++ developed at Nortel Networks. As will be discussed,
each of these projects underwent a different combination of ASA, inspections and testing. ASA
or inspection may or may not have been conducted, and ASA could have been done prior to
inspection, prior to test, or during test. In this paper, we compare and contrast the results of doing
ASA and the placement of ASA in the development process. FlexeLint, Reasoning's Illuma, and
Klocwork's inForce and GateKeeper are some of the ASA tools and services used by Nortel.
These static analysis tools are representative commercial tools which are used to detect errors in
C/C++ source code [20]. In this study, the number of faults and their variety (in terms of types
of faults) identified by Flexelint was about two times that identified by Klockwork, and about
four times that identified by Reasoning's Illuma.
The first two Nortel products we analyzed, henceforth called Product A and Product B, both
underwent ASA. However, inspections were not performed on Product A. For Product B, the
inspection faults were communicated via email and not archived. Data for several releases were
available for the third product, which is referred to as Product C. We analyzed one release (C.0)
that underwent inspection only because it was developed prior to instituting ASA. The following
two releases (C.1 and C.2) underwent both ASA and inspections. In this case, release C.1 is
considered as the release N-1 and C.2 is the release N and the “clean baseline”.
For Products A, B, C.1 and C.2, the ASA faults were sent to a pre-screening service. The
faults that were analyzed in our research were the true positives that remained after the
pre-screening. For each release, we scrutinized and classified a multitude of ASA faults,
system test or customer-reported failures. The summary of the data that was analyzed for each
product is shown in Table 1.
Table 1: Summary of the data analyzed
Product/Release ASA Inspection CR
A FlexeLint, Klocwork Not performed Yes
B FlexeLint No
(email only)
Yes
0 Not performed Yes Yes
1 FlexeLint, Reasoning, Klocwork Yes Yes C
2 FlexeLint, Klocwork Yes Yes
3.3. Fault Classification Schemes
To answer Q5, we aim to classify the defects that can be detected via ASA. Each ASA tool
defines its own unique defect types. However, these defect types are related to the lower-level
types of faults that can be identified by ASA, and our goal is to place faults detected by ASA in
the scheme of the entire development process.
Fault classification schemes (taxonomies) are intended to have categories that are distinct,
i.e. orthogonal, to remove the subjectivity of the classifier [16]. There are many different fault
classification schemes presented in the literature. Basili et al. [3] proposed a classification
scheme in research on requirements defects. The scheme consists of five defect classes:
Omission, Incorrect Fact, Inconsistency, Ambiguity, and Extraneous Information. Travassos et al.
[27] tailored the five defect classes to Object-Oriented design in 1999. Schneider et al. [26]
researched the defect classification scheme for fault detection in user requirement document, and
Ackerman et al. [1] developed another defect classification scheme for requirements defects.
IEEE also provides a classification scheme of anomalies found in software and its documentation
[13]. The level of abstraction used in the IEEE classification scheme is not abstract enough for
symptoms blurs the distinction between mode and effect [8]. There is also the classification of
Beizer [Bei90], and so on.
The goal of IBM's Orthogonal Defect Classification (ODC) [5] scheme is to categorize
defects such that each defect type is associated with a specific stage of development. El Emam et
al. [6] investigated the defect classification scheme that has been applied in ODC indicating the
use of this defect classification scheme is in general repeatable in many areas of software
engineering. ODC has eight defect types. Each defect type is intended to point to the part of the
development process that needs attention. The relationship between these defect types and
process associations are shown in Table 2, which adapted from [5]. Therefore, ODC scheme can
better reflect the development phase a defect was injected into the system. In our research, we
analyzed software faults and failures and assigned each an ODC category.
Table 2: ODC Defect Types and Process Associations, adapted from [5]
Process Association Defect Type
Design Function
Low Level Design Interface, Checking, Timing/Serialization, Algorithm
Code Checking, Assignment
Library Tools Build/Package/Merge Publications Documentation
3.4. Limitations
There are certain limitations to the approach we used that the reader needs to understand
before results are presented. First, we classify faults into ODC categories based upon our
subjective assessment of fault descriptions and of the ASA defect types. This categorization is
most subjective in our analysis of customer-reported CR failures. Frequently, causal analysis (or
root-cause analysis) data was not available in the information provided for the CR failures.
on exactly what was fixed and the cause of the initial fault. Second, the defects were classified
without considering the severity or impact of the potential failure. Additionally, our results
focused on the use of three ASA tools (FlexeLint, Klockwork, and Reasoning’s Illuma), and
therefore may not be representative of all ASA tools. Finally, the results relate to very large
software systems written in C/C++ and therefore may not be representative of other types of
software.
4. Results
In this section, we use the Nortel Networks data to provide insight to the six questions posed
in Section 1. The basic goal is to determine whether ASA can help an organization economically
produce a high-quality product. Sub-sections 4.1 through 4.6 each address one of the six
questions. Using the GQM, in each sub-section, the question is restated and the metrics that were
collected and analyzed are listed. Metrics data are analyzed, and the implications of this data
analysis to the posed question are discussed.
4.1. Economics of Fault Detection
Q1: Is ASA an economical means of software fault detection?
Metrics: Quantity of defects found by inspection; quantity of defects found by ASA; preparation
time; meeting time; static analysis tool cost; pre-screening cost
Finding and fixing a problem, injected in an early phase of software development, in later
phase, can be expensive because the longer the defects resides in the product, the larger the
number of elements that will likely be involved in a fix [4]. Ideally, one would like not to inject
which they are generated. This is the reason why inspections and other non-execution based
methods of fault-detection are used in practice in phases where code execution is may not be an
option, or may increase fault-detection power. In general, inspections are considered an
affordable fault detection technique [22, 24].Hence, to examine the affordability of other types
of static analysis, we compare their cost to that of inspections [7] Industrial data has shown that
inspections are among the most effective of all verification and validation (V&V), measured by
the percentage of faults typically removed from an artifact via the technique [24].
Most software inspections are performed manually. Software review meetings require
preparation and the simultaneous attendance of all participants (or inspectors). Effectiveness of
inspections is dependant upon satisfying many conditions, such as adequate preparation,
readiness of the work product for review, high quality moderation, and cooperative interpersonal
relationships [22]. Effectiveness of ASA is less dependent upon these human factors due to the
automation. However, ASA is not free from this dependence due to the need to identify the true
defects from all those identified by the tool.
To determine the average cost of detecting a fault via inspections, we manually examined
inspection records for Releases C.1 and C.2, a total of approximately 1.25 million LOC. This
economics analysis was not performed on other products or releases because of the lack of either
ASA faults or inspection data, as discussed in Section 3.2.
The inspection records for Releases C.1 and C.2 contained quantifications of preparation
time and meeting time of each inspection participant, and a profile of the faults, including
location, type, complexity, and description identified in the inspection meeting. To obtain the
average dollar cost of detecting a fault, we added the preparation and meeting time by all
where n is the number of inspection participants. We computed the cost per fault considering an
average annual base salary plus benefits cost of $150,000 per inspection participant5. Avg. Cost of Fault Detection Inspection =
Found Faults Quantity ute min Benefits Salary eparing Pr Time Meeting Time utes min n i n
∑
= + + 1 ) / ) (( ) ( (1)We computed the average cost of fault detection for ASA based on the cost of the tool
license, the pre-screening cost to eliminate false positives (on a per LOC basis which is how the
screeners are paid), and the number of remaining true positive faults. The computation is shown
in Equation 2:
Avg. Cost of Fault Detection ASA =
Found Faults Positive True Quantity LOC Line Per Cost License
Tool +( )( )
+ cost of ASA use?
(2)
To protect proprietary information, we only provide a ratio of the costs, as shown in
Equation 3. Cost Benefit: Inspection ASA Detection Fault of Cost Avg Detection Fault of Cost Avg . . (3)
Based upon our data, the computed ratios are 0.72 for C.1 and 0.61 for C.2, indicating that
the cost of ASA per detected fault is of the same order of magnitured as the cost of inspections
per fault detected.. These results indicate that ASA is a relatively affordable fault detection
technique.
4.2. Final Product Quality
5
Q2: Will a product be of higher quality if ASA is part of the development process?
Metrics: Quantity of defects found by system testing; quantity of defects found by customer
testing; churned thousand lines of code (KLOC)
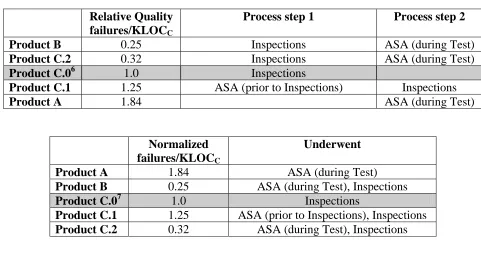
Table 3 provides a comparison of the final product quality. The measure used for final
product quality is the number of total failures per churned KLOC (KLOCC). We use failures per KLOCC as a measure of final product quality because it reflects the impact of change on the product. In the table, we use Product C.0 as the baseline product because this product/version
was developed prior to ASA being instituted into Nortel’s process. We normalized the failures
per KLOCC metric relative to that of Product C.0 to protect Nortel’s proprietary quality information. This gives us the Relative Quality column of Table 3.
Table 3: Relative final product quality
Relative Quality failures/KLOCC
Process step 1 Process step 2
Product B 0.25 Inspections ASA (during Test)
Product C.2 0.32 Inspections ASA (during Test)
Product C.06 1.0 Inspections
Product C.1 1.25 ASA (prior to Inspections) Inspections
Product A 1.84 ASA (during Test)
Normalized failures/KLOCC
Underwent
Product A 1.84 ASA (during Test)
Product B 0.25 ASA (during Test), Inspections
Product C.07 1.0 Inspections
Product C.1 1.25 ASA (prior to Inspections), Inspections
Product C.2 0.32 ASA (during Test), Inspections
We see two interesting things: a) there is a wide variance in the relative quality of the
products, and b) it would appear that just making ASA part of the process does not guarantee
better quality of a product. The data suggest that doing ASA after inspections (Product B,
Product C.2) may be more beneficial than prior to inspections (Product C.1). Additionally, the
product with the lowest quality was Product A, which did not have any inspections in its
development process. These results reinforce the benefits of holding inspections.
4.3. Fault Detection Yield
Q3: How effective is ASA at detecting faults compared with inspection and testing?
Metrics: Quantity of ASA faults; quantity of inspection faults; quantity of test failures;
quantity of customer-reported failures
We examined fault detection yield as a measure of how well a fault detection practice
identifies faults present in the artifact. Fault detection yield refers to the percentage of defects
present in the code at the time of the fault-detecting practice that were found by that practice [11],
as shown in Equation 4.
Fault detection yield =
Phases Following
by and actice Pr by Detected Faults
Total
actice Pr by Detected Faults
Quantity )
)( 100 (
(4)
Fault detection yield cannot be precisely computed until the product has been used extensively in
the field, and this measure falls as more defects are found in the field. Additionally, we
calculated the software defect removal efficiency [14] as a measure of how well a process
removes faults before delivery. Software defect removal efficiency is the percentage of total bugs
Defect removal efficiency = Detected Failures and Faults Total Faults forField Except Detected Faults Quantity ) )( 100 ( (5)
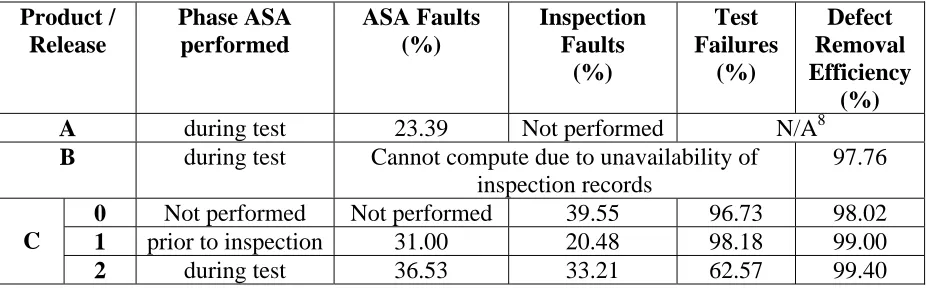
For all products, ASA was performed during test with the exception of Product C.1. The
faults/failures yield and process yield are shown in Table 4. For Product C.2, the fault detection
yield of test is relatively low because, in this case, ASA was performed during the test so that the
denominator of the Equation 4 includes the number of ASA faults. However, the Defect
Removal Efficiency for Product C.2 is 99.4%, which is essentially the same as that of other
releases. Additionally, the top companies can achieve a greater than 95% software defect
removal efficiency for commercial software [14, 15]. The values of Defect Removal Efficiency
in the table are higher than industry benchmarks indicating the high final quality of these
products/releases.
These results indicate that the defect removal yield of ASA is essentially the same as that of
inspections. Execution-based testing is two to three times more effective than ASA at finding the
defects remaining by that phase. However, the yield is higher when ASA is performed after
inspections. One speculation for this observation is that inspections may remove enough faults to
make it easier to discern true from false positives in the ASA output.
Table 4: Defect removal yield for different fault removal techniques
Product / Release Phase ASA performed ASA Faults (%) Inspection Faults (%) Test Failures (%) Defect Removal Efficiency (%)
A during test 23.39 Not performed N/A8
B during test Cannot compute due to unavailability of inspection records
97.76
0 Not performed Not performed 39.55 96.73 98.02 1 prior to inspection 31.00 20.48 98.18 99.00 C
2 during test 36.53 33.21 62.57 99.40
4.4. Problem Module Identification
Q4: Can ASA be helpful for identifying problem modules?
Metrics: Quantity of ASA faults for individual modules, quantity of test failures per module,
quantity of customer-reported failure per module
We are missing a whole set of references to works of Khoshgoftaar et al. They have done a
host of studies on how to predict error-prone modules (using Nortel and other data). I think we
need to include that information somewhere and also compare our and their results.
Other studies have also analyzed the ability of ASA defects to identify problem modules.
Static analysis defects were used to predict the pre-release defect density of Windows Server
2003 [19]. The research demonstrated a positive correlation between the ASA defect density and
pre-release testing defect density and that discriminant analysis of ASA defects could be used to
separate high- from low-quality components with 83% accuracy. Additionally, a preliminary
investigation had been done on static analysis at Nortel [20]. Failure data from two releases of a
large 800 KLOC product that underwent ASA during test were analyzed [20]. In addition, the
ASA faults, code churn, and deleted LOC were used to form a multiple regression equation
which was effective for predicting the actual defects of the product. Finally, discriminant
analysis indicated that ASA faults, code churn, and deleted LOC could be used as an effective
means of classifying fault-prone programs. We continued this research by examining the
potential of ASA faults alone for the identification of problem modules.
First, a Spearman rank correlation is computed on Product B to examine the relationship
commonly-used robust correlation technique [9], Spearman rank correlation can be applied even
when the association between elements is non-linear. We examined data of product B because
only Product B had clear module partition information. The numbers of ASA faults and
test/customer-reported failures were counted for each module of Product B. The partition of the
modules was provided by the development group. The correlation results of the ASA faults with
test failures, customer-reported failures, and total failures is shown in Table 5. The relatively
large correlation coefficient and small p-values indicate that a statistically significant9 correlation exists between ASA faults and test/customer-reported failures. These results indicate
that when a module has a large quantity of ASA faults, the module is likely to be problematic in
test and in the field.
Table 5: Spearman rank correlation for Product B (for modules)
# of ASA faults
# of test failures
# of customer-
reported failures
# of total failures
Correlation Coefficient 1.000 .708 .604 .730 # of ASA faults
Sig. (2-tailed) . .000 .002 .000
Correlation Coefficient 1.000 .686 .992 # of test failures
Sig. (2-tailed) . .000 .000
Correlation Coefficient 1.000 .750
# of customer-
reported failures Sig. (2-tailed) . .000
Correlation Coefficient 1.000
# of total failures
Sig. (2-tailed) .
Afterwards, discriminant analysis was used as a tool to detect the fault-prone modules. In all
the analysis, if there is no customer-reported failure in a module then the module is classified as
not fault-prone otherwise it is classified as fault-prone. Discriminant analysis is a statistical
9
technique used to categorize modules into groups based on the metric values. The metrics used in
the discriminant analysis include the following:
• the number of ASA faults;
• the number of test failures;
• the ASA fault density (number of ASA faults / source lines of code (SLOC));
• the test failures density (number of test failures / SLOC);
• the normalized ASA faults density (number of ASA faults / churned SLOC); and
• the normalized test failures density (number of test failures / churned SLOC).
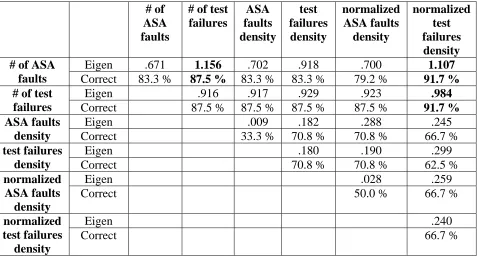
We built the discriminant function using either one of the above metrics only or the combination
of two of them. Table 6 illustrates the summary of the discriminant functions built using the 21
models.
Table 6: Summary of the discriminant analysis
# of ASA faults
# of test failures ASA faults density test failures density normalized ASA faults density normalized test failures density
Eigen .671 1.156 .702 .918 .700 1.107
# of ASA
faults Correct 83.3 % 87.5 % 83.3 % 83.3 % 79.2 % 91.7 %
Eigen .916 .917 .929 .923 .984
# of test
failures Correct 87.5 % 87.5 % 87.5 % 87.5 % 91.7 %
Eigen .009 .182 .288 .245
ASA faults
density Correct 33.3 % 70.8 % 70.8 % 66.7 %
Eigen .180 .190 .299 test failures
density Correct 70.8 % 70.8 % 62.5 %
Eigen .028 .259 normalized
ASA faults density
Correct 50.0 % 66.7 %
Eigen .240
normalized test failures
density
For each analysis, the eigenvalue and the percentage of correctly classified modules are
shown in the table. The eigenvalue is a measure of how good the discriminative function is with
respect to the classification of the data. The larger the eigenvalue, the greater the discriminatory
power of the model. We found that the model using the number of ASA faults and the number of
test failures, henceforth referred as Model 1, has the highest eigenvalue, indicating the
discriminative ability of this model is the best. With this model, 87.5% of the modules are
correctly classified. Additionally, 91.7% of the modules are correctly classified if the model uses
the number of ASA faults and normalized test failures density, or the number of test failures and
normalized test failures density, henceforth referred as Model 2 and 3. However, the eigenvalues
of these two models are relatively smaller than that of Model 1. The model parameters of the
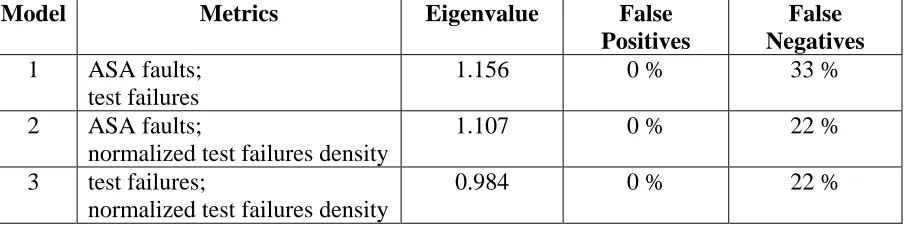
discriminant functions for Models 1 through 3 are shown in Table 7. For all the three best models,
no high quality module was incorrectly classified as fault-prone. However, 33% of the
fault-prone modules were incorrectly classified as not fault-prone using Model 1 and there were
22% false negatives among the fault-prone modules using Model 2 and Model 3.
Table 7: Model parameters of the discriminant functions
Model Metrics Eigenvalue False
Positives
False Negatives 1 ASA faults;
test failures
1.156 0 % 33 %
2 ASA faults;
normalized test failures density
1.107 0 % 22 %
3 test failures;
normalized test failures density
0.984 0 % 22 %
These statistical analysis results indicate that although the number of ASA faults itself is not
faults and the number of test failures can be effective to identify problem modules. Developers
can test and rework more on the identified fault-prone modules to improve their reliability.
4.5. Classes of Faults and Failures
Q5: What classes of faults and failures are most often detected by ASA, by inspection, or
by system testing? What classes of defects escape to customers?
Metrics: Quantity of ASA faults by ODC type; quantity of inspection faults by ODC type;
quantity of system test failures by ODC type; quantity of customer-reported failures
by ODC type
We counted and classified (according to the ODC) the ASA and inspection faults and the
test and customer-reported failures for the three products. In this section, we present our
classification of the types of defects detected by each of these phases.
4.5.1. ASA Detected Faults
Each ASA detected fault had a documented problem report that contained detailed
information such as fault descriptions, location, preconditions, impact, severity, suggestion, and
code fragment. The report for each problem was manually read, and then faults were classified
according to ODC categories. Finally, the faults were counted to form a profile of faults. A
summary of the results of this analysis is shown in Table 8. For the purpose of protecting
proprietary information, only percentage is displayed in the tables. Because Flexelint was the
Table 8: Mapping of ASA faults identified by all ASA tools to ODC defect types
A (%) B (%) C.1 (%) C.2 (%)
Assignment -- All -- Flexelint
70 73
77 77
73 53
73 71 Checking
-- All -- Flexelint
30 27
23 23
27 47
27 29
Other ODC types 0 0 0 0
The results shown in both tables indicate that ASA is effective at identifying two of the eight
ODC defect types: Assignment and Checking. As we discussed in Section 2.4, Checking defects
would most likely be injected in the low level design or coding phase while Assignment defects
would be injected in the coding phase. Therefore, it is logical that static analysis would be able to
detect these types of faults.
4.5.2. Inspection Detected Faults
Inspections were done with checklist independent of whether ASA was done or not. Unlike
ASA data, not all inspection processes and results were logged formally. Some of them were
communicated via emails and could not be analyzed. However, the minutes of inspection
meetings for Product C were well recorded in text files via a recording tool. Product C.1 and C.2
underwent both ASA and inspection while product C.0 underwent inspection only. Similar to the
analysis on ASA, every inspection file was manually read, and inspection faults were counted
and classified according to ODC. The results of this classification are shown in Table 9. Note
that inspectors also documented comments about code readability and/or maintainability, such as
style, in the inspection records. These readability/maintainability comments account for about
25-35% of the statements in inspection records but are not recorded in the ODC classification.
The results indicate that inspection most often identifies Algorithm, Documentation, and
Checking faults. Approximately 90% of all the faults belong to these three types, and the
distribution between these three types seems to remain relatively constant irregardless of when
ASA was performed.
Table 9: Classification of inspection faults
ODC Type C.0 (%)
No ASA
C.1 (%) After ASA
C.2 (%) Prior to ASA
Algorithm 30.60 38.27 37.44
Documentation 29.85 37.65 25.99
Checking 27.61 17.59 18.94
Assignment 5.22 4.01 7.93
Function 0.75 1.23 0.88
Interface 1.49 0.62 0
Build/Package/Merge 4.48 0.62 8.81
Timing/Serialization 0 0 0
4.5.3. System Test Failures
A detailed CR was created for each test and customer-reported failure. Besides the static
information similar to those in ASA fault reports, dynamic information such as failure status, fix
and submit history, and discussion minutes, were updated frequently during the process of fault
removal. A priority (i.e. severity) rating was also assigned to the failure by the tester or by an
agreement between design management and test management. In general, the priority indicates
the impact of the failure on the operation of the system. However, sometimes the priority may be
elevated if an important customer or many customers are affected. The scale is from 1 to 4 with 1
being the highest priority. Priority 1 means system will not perform its critical mission, and
remaining lower priority CRs (priorities 3 and 4) report the failures that do not impact a release
or milestone declaration.
Because only the CR data for Product B contained clear and detailed fix information, we
investigated the test failures and customer-reported failures for Product B. The CR data for
Product A did not distinguish between system test and customer-reported failures. The CR data
for Product C did not provide enough information for distinguishing by ODC. We examined CRs
and scrutinized the description of the problem being addressed by the updates and the description
of the resulting code fix to classify the failures for Product B. The results of our ODC
classification of test failures can be found in Table 10. Overall, eighty-five percent of the test
failures are of a high priority. The results indicate that a large majority of test failures is in
Function and Algorithm types.
Table 10: Priority summary of CR data for Product B (Test Failures)
Priority (%) Defect Type
1 2 3 4 Total
Function 1.21 48.89 5.63 0 55.73
Assignment 0 3.22 0.60 0 3.82
Interface 0 0.20 0 0 0.20
Checking 0 0.80 0 0 0.80
Timing/Serialization 0 0 0 0 0
Build/Package/Merge 0 1.61 0.10 0 1.81
Documentation 0 0 0 0 0
Algorithm 0 29.78 7.85 0 37.63
Total 1.21 84.51 14.29 0 100
Customer-reported failures were classified for Product B as well. The summary of the results
is shown in Table 11. Ninety-seven percent of the customer-reported failures are high priority
Table 11: Priority summary of CR data for Product B (Customer-Reported Failures)
Priority (%) Defect Type
1 2 3 4 Total
Function 24.24 42.42 3.03 0 69.70
Algorithm 6.06 24.24 0 0 30.30
Other ODC types 0 0 0 0 0
Total 30.30 66.67 3.03 0 100
The results indicate that most all failures surfaced by customers can be classified as
Function or Algorithm defects. However, this phenomenon may be the results of a lack of data in
the CR record to more accurately classify the defect and when the defect might have been
injected. Function defects are injected in the design phase and can be hard to detect until system
testing when functionality is validated against requirements. Algorithm defects are injected in the
low-level phase and had the potential to be found in earlier V&V practices.
The comparison between different fault removal filters is shown in Table 12. The results
indicate that ASA tools predominantly identify two ODC defect types: Checking and Assignment.
Approximately 90% of all the faults identified by inspection belong to Algorithm, Documentation,
and Checking faults. A large majority of test/customer-reported failures is in Function and
Algorithm types. Additionally, if ASA is performed prior to inspection (such as was done with
Product C.1), fewer Checking faults are identified by the inspection.
Table 12: Mapping of defects found by different filters to ODC defect types
Defect Type ASA
(%)
Inspection (%)
Test (%)
Customer (%)
Function 0 1.09 55.73 69.70
Assignment 72.27 4.37 3.82 0
Interface 0 0.87 0.20 0
Checking 27.73 20.52 0.80 0
Timing/Serialization 0 0 0 0
Build/Package/Merge 0 1.77 1.81 0
Documentation 0 35.37 0 0
4.6. Programmer Errors
Q6: What kinds of programmer errors are most often identified via ASA? How often does
ASA find these errors?
Metrics: Quantity of ASA faults classified by defect type
To avoid the impact of definition difference in defect types among different static analysis
tools, data of only one tool was analyzed to answer this question. Here we chose Flexelint data
because Flexelint was the only tool that was used on all three products and the types of faults
identified by Flexelint was much more than those identified by the other two tools. We merged
the same or very similar static analysis faults for all the three products to perform an aggregate
analysis of the types of defects identified by the tool. The detailed summary of fault types is
shown in Appendix A, ranked with most frequent faults at the top of the list. While FlexeLint has
more than 800 defect types, only 33 of these were found in our projects. Severity information
was added by the pre-screeners. The faults were given one of the following severity ratings based
on their potential failure impact.
z Critical: a fault that could cause an application core dump, service outage, or system
reboot;
z Major: a fault that could cause a segmentation fault or performance degradation, such
as memory leaks, resource leaks, data corruption;
z Minor: a fault that may result in erratic and unexpected behavior but may have little
z Coding Standard: code that violates a coding standard that has the potential to
decrease the maintainability and readability of the software. (Note: No coding
standard violations were identified.)
Table 13: Pareto effect in ASA faults
% all faults
% critical faults
% major faults
% minor faults Top 1 fault:
Possible use of NULL Pointer
45.92 60.86 37.96 46.32
Top 5 faults: Top 1 fault +
Possible Access Out-of-Bounds
(Custodial) pointer not freed or returned Memory leak
Variable not initialized before using
77.26 85.11 76.56 74.24
Top 10 types: Top 5 faults +
Inappropriate deallocation Suspicious use of ;
Data overrun
Type mismatch with switch expression Control flows into case/default
89.87 90.42 89.42 90.04
Our results are consistent with the 80-20 rule/Pareto Principle in that a great majority of the
faults identified by ASA is produced by a few key types of programmer errors, as shown in Table
13. “Possible use of NULL pointer” is the most often identified fault via ASA, accounting for
approximately 46% of all faults. About 90% of faults are focused on ten fault types, no matter
what level of severity. To improve the code quality in future projects, we can use this information
as feedback to programmers so that they pay more attention to these specific types of errors.
A limitation of this analysis is that the screening of the ASA output and the assigning of a
severity rating is a manual process and subjective. Different products were screened and
evaluated by different screeners. Therefore, the same or very similar fault might be evaluated as
all the three products. Most of the faults in this type were assessed as Critical faults in Product A
and Product C.1. However, screeners for Product B deemed 72.3% of faults in this type were
Minor faults, and 92.8% of faults in this type were considered Major faults in Product C.2.
5. Conclusions
To examine the value of automated static analysis, we analyzed the automated inspection
faults, manual inspection faults, and CR data for three large products. Several valuable
conclusions can be drawn from our analysis as follows. These results can be beneficial to the
understanding and utilization of automated static analysis. Economic analysis shows that ASA
has a lower average fault detection cost than inspection indicating that ASA is an economical
means of software fault detection.
• Although we can not conclusively illustrate that a product will be of higher quality if
ASA is part of the development process, our analysis reinforce the benefits of holding
inspections.
• The defect removal yield of ASA essentially the same as that of inspections. Testing is
two to three times more effective than ASA at finding the defects remaining by that
phase.
• The statistical analysis results show that although the number of ASA faults itself is not a
very good measure of fault-prone module identification, the combination of the number
of ASA faults and the number of test failures can be effective to identify problem
modules.
• The mapping of ASI faults to ODC defect types indicated that ASI tools predominantly
• Approximately 90% of all the faults identified by manual inspection belong to Algorithm,
Documentation, and Checking faults.
• A large majority of test/customer-reported failures is in Function and Algorithm types.
• The 80-20 rule/Pareto effect found in faults and failures distribution analysis can be
considered as useful feedback to help us improve the code quality in future projects.
In conclusion, our results indicate that ASA is an economical complement to other verification
and validation techniques.
6. Future Work
In this research, our results focused on the use of three ASA tools for C/C++ programs. We
will examine the defect data identified by more static analysis tools for other programming
languages besides C/C++. Also, we will enhance economics analysis by using more data and
more refined methods or models considering the severity or impact of the defects. Additionally,
the raw output generated by static analysis tools can be examined to find out whether there are
common factors that lead to a raw ASI citing becoming a true positive defect, and whether there
is an indicator in the raw tool output that could help focus the screening.
Acknowledgments
We would like to thank the North Carolina State University (NCSU) Software Engineering
reading group for their helpful suggestions on this paper. In particular, we would like to thank
Kiem Ngo for his help with data collection and for explaining aspects of the Nortel development
process. This work was funded in part by a Nortel-funded NCSU Center for Advanced
Computing and Communications (CACC) enhancement grant. This material is also based upon
Any opinions, findings, and conclusions or recommendations expressed in this material are those
of the author(s) and do not necessarily reflect the views of the National Science Foundation.
References
[1] A. F. Ackerman, L. S. Buchwalk, and F. H. Lewski, "Software Inspections: An Effective
Verification Process," IEEE Software, no., pp. 31-36, May 1989.
[2] V. Basili, G. Caldiera, and D. H. Rombach, "The Goal Question Metric Paradigm," in
Encyclopedia of Software Engineering, vol. vol. 2: John Wiley and Sons, Inc., 1994, pp.
528-532.
[3] V. R. Basili, S. Green, O. Laitenberger, F. Lanubile, F. Shull, S. Sorumgard, and M. V.
Zelkowitz, "The Empirical Investigation of Perspective-Based Reading," Empirical
Software Engineering - An International Journal, vol. vol. 1, no. 2, no., 1996.
[4] B. W. Boehm, Software Engineering Economics. Englewood Cliffs, NJ: Prentice-Hall,
Inc., 1981.
[5] R. Chillarege, I. S. Bhandari, J. Chaar, M. J. Halliday, D. S. Moebus, B. K. Ray, and M.
Y. Wong, "Orthogonal Defect Classification - A Concept for In-Process Measurements,"
IEEE Transactions on Software Engineering, vol. vol. 18, no. 11, pp. 943-956, 1992.
[6] K. E. Emam and I. Wieczorek, "The Repeatability of Code Defect Classifications," the
Ninth International Symposium on Software Reliability Engineering, Nov. 1998, pp. 322.
[7] M. E. Fagan, "Design and Code Inspections to Reduce Errors in Program Development,"
IBM Systems Journal, vol. vol. 15, no. 3, pp. 182-211, 1976.
[8] N. E. Fenton, Y. Iizuka, and R. W. Whitty, Software Quality Assurance and Metrics: A
[9] N. E. Fenton and S. L. Pfleeger, Software Metrics. Boston, MA: International Thompson
Publishing, 1997.
[10] D. Hovemeyer and W. Pugh, "Finding Bugs is Easy," Conference on Object Oriented
Programming Systems Languages and Applications (OOSPLA) Companion, Vancouver,
BC, 2004, pp. 132-135.
[11] W. S. Humphrey, A Discipline for Software Engineering. Reading, MA: Addison Wesley,
1995.
[12] IEEE, "IEEE Standard Glossary of Software Engineering Terminology," IEEE Standard
610.12-1990, 1990.
[13] IEEE, "IEEE Standard Classification for Software Anomalies," IEEE Standard
1044-1993, 1993.
[14] C. Jones, "Software Defect Removal Efficiency," Computer, vol. vol. 29, no. 4, no., pp.
94-95, Apr. 1996.
[15] C. Jones, Software Assessments, Benchmarks, and Best Practices. Boston, MA:
Addison-Wesley, May 2000.
[16] D. Kelly and T. Shepard, "A Case Study in the use of Defect Classification in
Inspections," IBM Centre for Advanced Studies Conference, Toronto, Ontario, Canada,
2001, pp. 7-20.
[17] N. Kikuchi and T. Kikuno, "Improving the Testing Process by Program Static Analysis,"
Asia-Pacific Software Engineering Conference (APSEC), Macao, China, 2001, pp.
195-201.
[18] J. R. Larus, Ball, T., Das, M., DeLine, R., Fahndrich, M., Pincus, J., Rajamani, S.K.,
[19] N. Nagappan and T. Ball, "Static Analysis Tools as Early Indicators of Pre-Release
Defect Density," International Conference on Software Engineering (ICSE), St. Louis,
MO, 2005, pp.
[20] N. Nagappan, L. Williams, M. Vouk, J. Hudepohl, and W. Snipes, "A Preliminary
Investigation of Automated Software Inspection," IEEE International Symposium on
Software Reliability Engineering (ISSRE), St. Malo, France, 2004, pp. 429-439.
[21] L. Osterweil, "Integrating the Testing, Analysis, and Debugging of Programs," in
Symposium on Software Validation: North Holland, Elsevier Science Publishers, 1984.
[22] A. A. Porter and P. M. Johnson, "Assessing Software Review Meetings: Results of a
Comparative Analysis of two Experimental Studies," IEEE Transactions on Software
Engineering, vol. vol. 23, no. 3, pp. 129-145, 1997.
[23] Reasoning Inc., "Automated software inspection: a new approach to increase software
quality and productivity," http://www.reasoning.com/pdf/ASI.pdf, 2003.
[24] I. Rus, F. Shull, and P. Donzelli, "Decision Support for Using Software Inspections,"
28th Annual NASA Goddard Software Engineering Workshop, 2003, pp. 11.
[25] N. Rutar, C. B. Almazan, and J. S. Foster, "A Comparison of Bug Finding Tools for
Java," IEEE International Symposium on Software Reliability Engineering (ISSRE), St.
Malo, France, 2004, pp. 245-256.
[26] G. M. Schneider, J. Martin, and W. T. Tsai, "An Experimental study of Fault Detection in
User Requirements Documents," ACM Transactions on Software Engineering and
Methodology, vol. vol. 1(2), no., pp. 188-204, Apr. 1992.
[27] G. H. Travassos, F. Shull, M. Fredericks, and V. R. Basili, "Detecting Defects in Object
on Object-Oriented Programming, Systems, Languages, and Applications (OOPSLA),
Denver, CO, Nov. 1999, pp. 47-56.
[28] M. Young and R. N. Taylor, "Rethinking the taxonomy of fault detection techniques,"
Appendix A. Detailed classification of static analysis faults ordered by total occurred times (% of total static analysis faults found)10
Fault Description Critical
(%) Major (%) Minor (%) Total (%) ODC Classification
Possible use of NULL Pointer 11.91 14.73 19.28 45.92 Assignment
Possible Access Out-of-Bounds 0.49 3.46 6.18 10.13 Checking
(Custodial) pointer has not been freed or returned
1.04 6.87 0.20 8.11 Assignment
Memory Leak 2.92 3.76 0.79 7.46 Assignment
Variable not initialized before using 0.30 0.89 4.45 5.64 Assignment
Inappropriate deallocation 0.74 1.88 0.79 3.41 Assignment
Suspicious use of ; 0.10 0.35 2.03 2.47 Checking
Data Overrun 0.05 0.15 1.93 2.13 Checking
Type mismatch with switch expression 0.10 1.93 0.15 2.18 Checking
Control flows into case/default 0.05 0.69 1.68 2.42 Checking
Possibly passing a null pointer to function 0.35 0.00 1.04 1.38 Checking
Ignore return value of function 0.10 0.84 0.40 1.33 Assignment
Passing null pointer to function 1.09 0.00 0.00 1.09 Checking
Unusual use of a Boolean 0.00 0.54 0.54 1.09 Checking
Pointer member neither freed nor zero'ed by destructor
0.00 0.94 0.00 0.94 Assignment
Loop not entered 0.00 0.20 0.59 0.79 Checking
Unreachable code 0.00 0.30 0.49 0.79 Checking
Boolean argument to relational 0.00 0.30 0.05 0.35 Checking
Unparenthesized parameter 0.00 0.00 0.35 0.35 Checking
Boolean test of assignment 0.00 0.30 0.00 0.30 Checking
Possibly negative subscription 0.00 0.25 0.05 0.30 Checking
Constant value Boolean 0.00 0.00 0.25 0.25 Checking
Boolean within 'String' always evaluates to [True/False]
0.00 0.10 0.10 0.20 Checking
Referencing data from already freed pointer 0.20 0.00 0.00 0.20 Assignment
Logic Error and Typo 0.05 0.10 0.00 0.15 Checking
Possible division by 0 0.00 0.15 0.00 0.15 Checking
Non-negative quantity is never less than zero 0.00 0.00 0.10 0.10 Checking
Null Pointer Dereference 0.05 0.05 0.00 0.10 Assignment
Variable Depends on Order of Evaluation 0.00 0.00 0.10 0.10 Checking
Dereferencing a constant string to a pointer 0.05 0.00 0.00 0.05 Assignment
Resources not freed 0.00 0.05 0.00 0.05 Assignment
Unrecognized format 0.00 0.00 0.05 0.05 Checking
Wrong Output Message 0.00 0.00 0.05 0.05 Checking
Total 19.57 38.80 41.62 100.00
10
![Table 2: ODC Defect Types and Process Associations, adapted from [5]](https://thumb-us.123doks.com/thumbv2/123dok_us/1193911.1149948/10.612.107.509.403.491/table-odc-defect-types-process-associations-adapted.webp)