J u rnal Teknologi, Jilid11, 1997
EXPERIMENTAL STUDY OF PARAFFIN WAX
POTENTIAL AS A PHYSICAL MODELLING
MATERIAL FOR LOCAL ENVIRONMENT
Md. Afendi M. Yusuf Department of Design Faculty of Mechanical Engineering
Universiti Teknologi Malaysia
ABSTRACT
An experimental study on paraffin wax was done to investigate its
potential as modelling material and observing the effect of local
environment thermal parameter. Testing and analysis done using
cromatographer, differential calorimeter scanner, instron
strength analyzer, durometer and laboratory experimental
equipment have given us the opportunity to clarify certain
elements in understanding the wax characteristics. Wax, through
this experiment, have been proven viable as a modelling material.
The surface finish is found to be better than Industrial Design
(ID) clay and stable for the local environment as long as it is not
exposed to direct heat source such as sunlight.
1.0 INTRODUCTION
JurnaJ Teknologi,Ji/idII, 1997
Modelling material such as ID clay and wood are frequently used by model
maker. Petroleum by plastic product like polyurethane foam. is found to be very
useful, as the materials can be found in rigid and semi-rigid form as required.
Most of the modelling materials are not recyclable, some are hazardous as it
may cause skin irritation and health deterioration, some contain environmental
unfriendly material and even difficult to dispose and the cost is expensive.
Paraffin wax tum up for an alternative, this is mainly due to the following
factor [1] :
a. Paraffin wax are inexpensive.
b. Available in practically unlimited quantities.
c. The grades do not vary.
But the question is the compatibility and the performance of this material in
our Malaysian weather. Series of testing have been made to overview the material
characteristic and thermal reaction problem.
2.0 EXPERIMENTAL THEORY
Paraffin wax is a hydrocarbon. In all macrocrystalline paraffin waxes with melting
point between 530
C and 610
C, the majority of n-alkane molecules are in the CIS to
C30range. Generally, the paraffin wax majority components are n-alkanes, branched
alkanes, mono-cyclo-alkanes, polycycloalkanes, monocyc1oaromatics, and aromatic
cycloalkanes groups [2].
2.1 Surface Profile Analysis
The surface profile is one of the important parts to look into, so we could distinguish
the surface roughness. Using Nikon microscope some figures from both material
surfaces finish were taken for the observation purposes.
JUri/a!Tekuologi, Jilidfl. 1997
2.2 Shore Hardness Testing
A Shore Hardness Durometer was used to determine both wax and ID clay indentation hardness. The hardness comparison was made between wax and ID clay. The hardness range of the materials will give some general ideas of how the workability condition of the wax.
Generally, ID clay is much softer and stretchable. On the other hand, wax is more rigid and brittle. This general evaluation is not sufficient to give a definite comparison. The shore hardness testing method was designed to give some readings for references and analysis.
Hardness readings were taken on five differences sample from the same wax and five differences sample from the ID clay. This method is practiced to minimize error due to uneven distribution of oil content that is naturally present in the wax, and mixture of sulphur, ash, and wax exists in the ID clay. The average values were calculated to represent the hardness value for the wax and the ID clay.
2.3 Strength Analysis
The analysis on the strength of paraffin wax could give us the idea about the wax and the chance to make some comparative studies between wax and ID clay. The outcome of this test will provide us the data about working condition of both materials.
Three points bending flexural test was done to overview the strength of both materials strength as structural member, even though, the use of both materials is mainly as filler mechanism. This fact will explore new extended application and evaluation of both materials as strut, beam, pillar, and cantilever.
2.4 Composition Analysis UsingInfra Red
UsingFourier Transfer-Infra Red (FTIR) system 2000 we could get a range of infra
JurnaJ Teknologi, Jilid II, 1997
this spectra we could identify certain group in the wax sample that was used in this
research experiment.
The tested sample was required in a form of uniform thin layer below 1 mrn
thickness and rounded dimension about 15 mm in diameter. The sample was then
position in a hollow thin annulus, which act as a holder. The holder will be
positioned in the analyzer to begin the analysis work.
2.5 Chromatography Analysis
Chromatography is another method to identify the components contain in a certain
materia1. Despite IR analysis, which is qualitative, chromatography provides us a
quantitative result. Solvent (Benzene) was used to dissolve the wax. The analyzer
use Ultra 1 Methyl Silicone column type and the capillary dimension is 25 m x 320
urn x 0.17 urn. This technique enable us to separate the alkanes up to C80 carbon
number and provide result in carbon number distribution [3].
2.6 Differential Scanning Calorimeter (DSC)
This machine has been used widely in thermal analysis of wax, petrolatum, oil, gas,
and polymeric materia1. In this testing experimental wax, samples were prepared
using clean cork borer and slice with razor blade into discs of desired thickness.
Samples weight range normally from 5 mg to 12 mg. The waxes were
scanned at the rate 10° C/min during normal heating runs. The first melting scans
were not reported since they are often non-reproducible. This is probably due to a
repositioning of the sample in the sealed pans.
Two types of sample were subjected for testing. First sample is a new
paraffin wax, which is comes directly from supplier. The sample weight is 5.60 mg.
The second sample is a recycled wax, which has been used for several times in the
operation of model making experiment. The recycled wax sample weight is 5.75 mg.
Jurnal-Teknologi, JilidII, 1997
Setting parameter of the testing machine healing and cooling rate at 10° C
And the cooling agent used are Sodium Chloride, Methanol and Liquid Nitrogen,
2.7 Cooling Curve Experiment.
In this experiment, a close observation was made on the variation of the wax
volumetric change during cooling time. The purpose of this experiment is to
determine the temperature range in concern of the material volumetric stability. The
volumetric stability is important since it has a significant effect on the dimension of
the mass.
3.0 EXPERIMENTAL SETUP
The analysis on the strength of paraffin wax could gave us the idea about the wax
and the chance to make some comparative studies between wax and ID clay. The
Material hardness of both materials will be tested using Shore Hardness Durometer.
The outcome of this test will provide us the data about working condition of both
materials. Three points bending flexural test was done to overview both materials
strength as structural member, even though, the use of both materials are mainly as
filler mechanism. This fact will explore new extended application of both materials
as strut, beam, pillar, and cantilever,
Temperature has a very distinctive effect on wax characteristic. Thermal
analysis were done to studies and understanding the wax thermal properties. The
local weather provides heat variation from 27° C to 35° C.For this temperature is in
the range of the wax solid-solid transition period, it is expect that, the wax will
undergo some deformation. The behavior of the wax deform under the influence of
the local environmental is essential to predict the performance of the wax as
modelling material in the local environment.
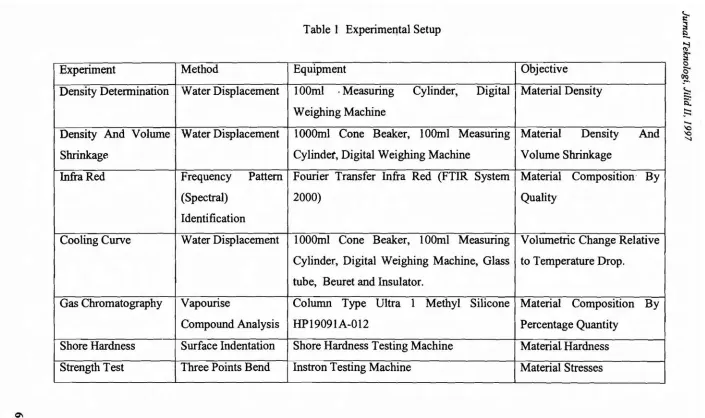
Table I shows the objective of the individual experimental and testing setup
Q'I
\CI
Table I Experimental Setup
Experiment Method Equipment Objective
Density Determination Water Displacement 100ml . Measuring Cylinder, Digital Material Density Weighing Machine
Density And Volume Water Displacement 1000mI Cone Beaker, 100ml Measuring Material Density And
Shrinkage Cylinder, Digital Weighing Machine Volume Shrinkage
Infra Red Frequency Pattern Fourier Transfer Infra Red (FTIR System Material Composition' By
(Spectral) 2000) Quality
Identification
Cooling Curve Water Displacement 1DOOmI Cone Beaker, 100ml Measuring Volumetric Change Relative Cylinder, Digital Weighing Machine, Glass to Temperature Drop.
tube, Beuret and Insulator.
Gas Chromatography Vapourise Column Type Ultra 1 Methyl Silicone Material Composition By
Compound Analysis HP19091A-012 Percentage Quantity
Shore Hardness Surface Indentation Shore Hardness Testing Machine Material. Hardness Strength Test Three Points Bend Instron Testing Machine Material Stresses
?
~ l:)
-~ ~ (;)
~
;r.~
-
~ E.::::....
'0 '0
Jurnal Teknologi, Jilid II, /997
4.0 EXPERIMENTAL RESULT
The experimental results were taken and analyzed. Some of the experiment readings were compared to the previous testing result and chart to assist the identification of the material composition.
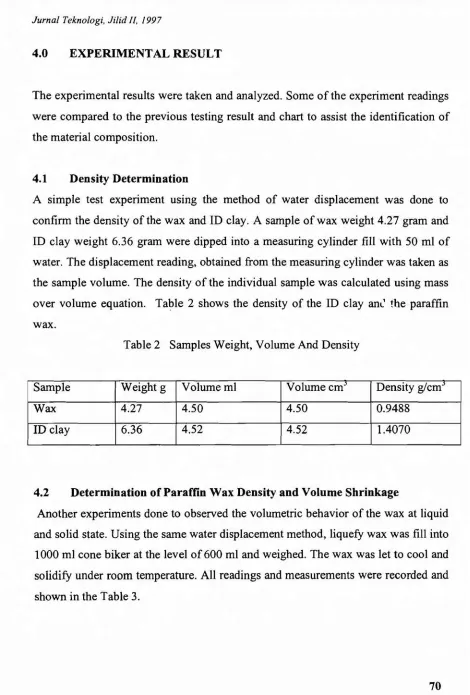
4.1 Density Determination
A simple test experiment using the method of water displacement was done to confirm the density of the wax and ID clay. A sample of wax weight 4.27 gram and ID clay weight 6.36 gram were dipped into a measuring cylinder fill with 50 ml of water. The displacement reading, obtained from the measuring cylinder was taken as the sample volume. The density of the individual sample was calculated using mass over volume equation. Table 2 shows the density of the ID clay aru' the paraffin wax.
Table 2 Samples Weight, Volume And Density
Sample Weight g Volume ml Volume em:' Density g/cm"
Wax 4.27 4.50 4.50 0.9488
ID clay 6.36 4.52 4.52 1.4070
4.2 Determination of Paraffin Wax Density and Volume Shrinkage
Jurnal Teknologi, Jilid II, /997
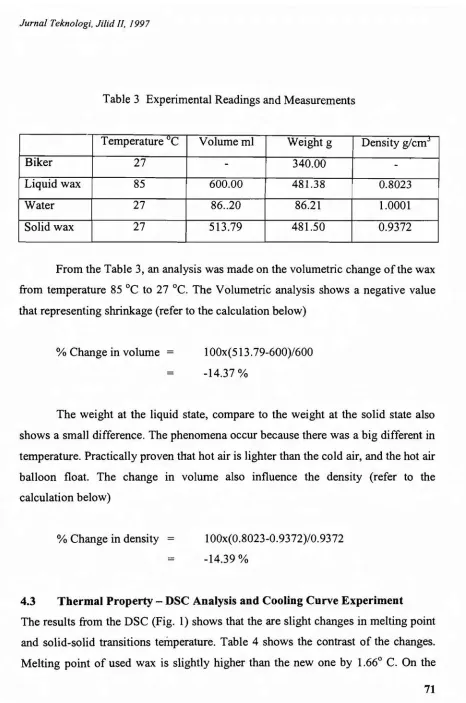
Table 3 Experimental Readings and Measurements
Temperature "C Volume ml Weight g Density g/crrr'
Biker 27 - 340.00
-Liquid wax 85 600.00 481.38 0.8023
Water 27 86..20 86.21 1.0001
Solid wax 27 513.79 481.50 0.9372
From the Table 3, an analysis was made on the volumetric change of the wax from temperature 85°C to 27 "C. The Volumetric analysis shows a negative value that representing shrinkage (refer to the calculation below)
% Change in volume 1OOx(513.79-600)/600 -14.37%
The weight at the liquid state, compare to the weight at the solid state also shows a small difference. The phenomena occur because there was a big different in temperature. Practically proven that hot air is lighter than the cold air, and the hot air balloon float. The change in volume also influence the density (refer to the calculation below)
% Change in density 100x(0.8023-0.9372)10.9372 -14.39%
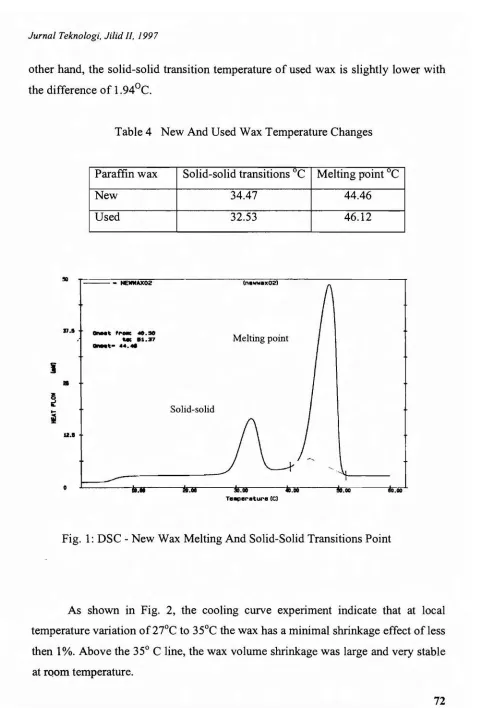
4.3 Thermal Property - DSC Analysis and Cooling Curve Experiment The results from the DSC (Fig. 1) shows that the are slight changes in melting point and solid-solid transitions temperature. Table 4 shows the contrast of the changes. Melting point of used wax is slightly higher than the new one by 1.66° C. On the
Jurnal Teknologi, Jilid Il, 1997
other hand, the solid-solid transition temperature of used wax is slightly lower with the difference of 1.94°C.
Table 4 New And Used Wax Temperature Changes
Paraffin wax Solid-solid transitions °c Melting point
-c
New 34.47 44.46
Used 32.53 46.12
!lO
11.1
•
U ••
o
- - - NEWAX02
_ t ,,._ ...SO
_ .S.37
_t- ...
Ii.•
Solid-solid
..66
Melting point
~.oo iI.DO
TellPereture leI
••00 to.oo
Fig. 1: DSC - New Wax Melting And Solid-Solid Transitions Point
~ ~ l:l
-~ ~ <::l ~.-' <, ::::.: is: ~ "-'0 '0 ' I 16.0_ 14.0
_ 12.0
10.0 0~
Cl.I ,:;I,
It
8.0 ,:;I,
c: ';:
- 6.0 00~
4.0
_ 2.0
-'-- .__ - 0.0
q<:l
";
",,,<:l ~<:l
<:
",,,,e:> ,<:l'"
",,,,e:> tI<:l'"
ShrinkageBelow
",,,e:> :-,<:l
'"
ve:> ,cf' ,,.,~ ,'\~ ,,,><:l ,<:l "' cf' '\e:> "e:> ",e:> e:> I I I I I I I60 ~ ' - • • • • :
I :
50 -l- :
I I
40
+
3S 0C ~ I-t----- ---- --- --- -- - --- -- --- --- ---~--- ---- - - --
-::-
t-
----
---
---
~~_
~~~T~
_~P
~!~j~~-~~~~---
---
---
-
---
-
---
---
--
-10 I
1
o
1
. • • • . . •
100 T 90
t
l 80 70 Cl.I..
=
-
e
Cl.Ic.
e
Cl.I
~
Co o ling Time (min)
-.--Temperature 'C _ Shrinkage %
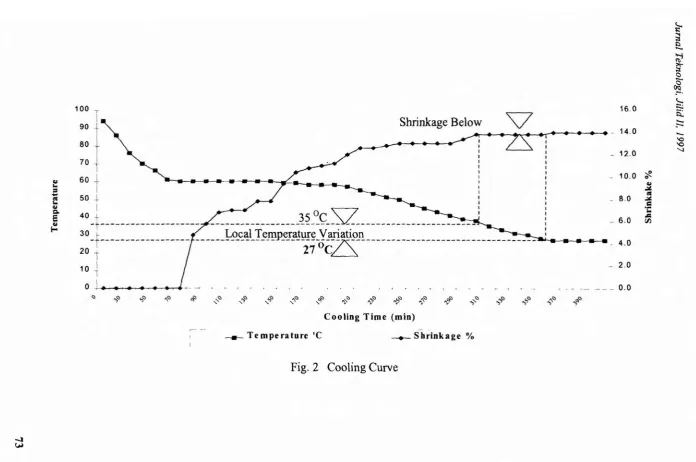
Fig. 2 CoolingCurve
-:I
Jurnal Teknologi, Jilid II, 1997
4.4
Material Composition
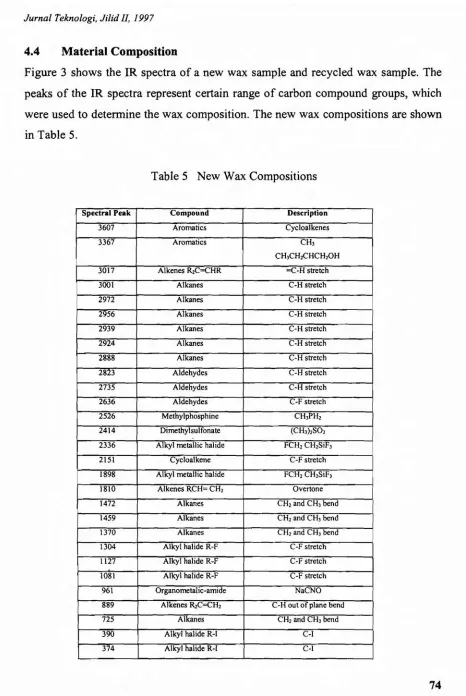
Figure 3 shows the IR spectra of a new wax sample and recycled wax sample. The
peaks of the IR spectra represent certain range of carbon compound groups, which
were used to determine the wax composition. The new wax compositions are shown
in Table 5.
Table 5 New Wax Compositions
Spectral Peak Compound Description
3607 Aromatics Cycloalkenes
3367 Aromatics CH3
CH3CH2CHCH,OH
3017 Alkenes R2C=CHR -C-H stretch
3001 Alkanes C-H stretch
2972 Alkanes C-H stretch
2956 Alkanes C-H stretch
2939 Alkanes C-H stretch
2924 Alkanes C-H stretch
2888 Alkanes C-H stretch
2823 Aldehydes C-H stretch
2735 Aldehydes C·H stretch
2636 Aldehydes C-F stretch
2526 Methylphosphine CH3PH2
2414 Dimethylsulfonate (CH3),S02
2336 Alkyl metallic halide FCH, CH,SiF3
2151 Cycloalkene C-F stretch
1898 Alkyl metallic halide FCH2CH2SiF3 1810 Alkenes RCH- CH, Overtone
1472 Alkanes CH2 and CH3bend
1459 Alkanes CH, and CH3bend
1370 Alkanes CH, and CH) bend
1304 Alkyl halide R-F C-F stretch
1127 Alkyl halide R-F C-F stretch
1081 Alkyl halide R-F C-Fstretch
961 Organometalic-amide NaCNO
889 Alkenes ~C=CH2 C-H out of plane bend
725 Alkanes CH2and CH3bend 390 Alkyl halide R-I C-I
Jurna/ Teknologi, Jilid II. /997
...
-- --
-u... _
-
--Fig.3 Infra Red Spectral Analysis Of New And Recycled Wax
4.5 Gas Chromatography
The fragments of the wax sample were firstly dissolved with benzene (solvent for paraffin wax). The mixture concentration was 2.809% wax and 97.191% benzene. The mixture was manually injected into the heating chamber that slowly heated up with the rate of 1.50
C/min.
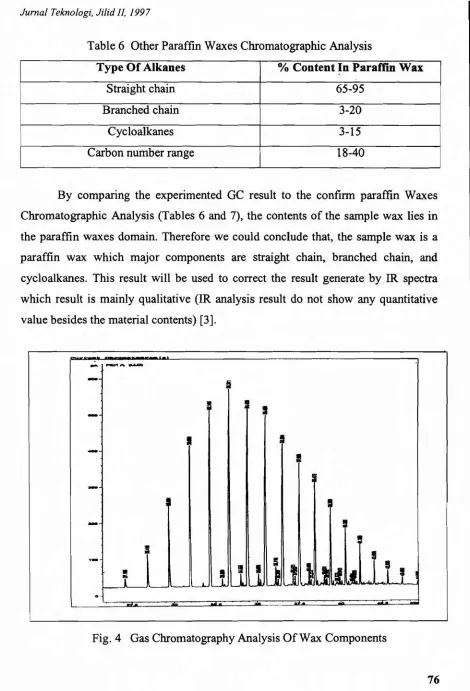
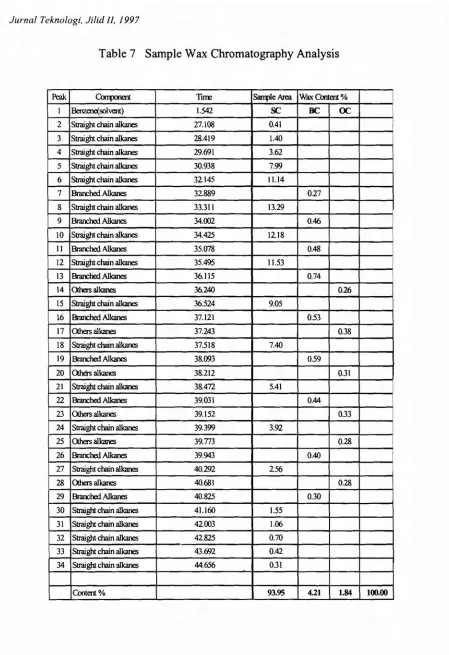
Figure 4 and Table 7 show the quantity and type of alkane contain in the sample paraffin wax used the form of bar chart. (SC-straight chain, BC-branched chain, OC-cycloalkanes).
Jurna/ Teknologi, Ji/idII, 1997
Table 6 Other Paraffin Waxes Chromatographic Analysis
Type Of Alkanes % Content In Paraffin Wax
Straight chain 65-95
Branched chain 3-20
Cycloalkanes 3-15
Carbon number range 18-40
By comparing the experimented GC result to the confirm paraffin Waxes
Chromatographic Analysis (Tables 6 and 7), the contents of the sample wax lies in
the paraffin waxes domain. Therefore we could conclude that, the sample wax is a
paraffin wax which major components are straight chain, branched chain, and
cycloalkanes. This result will be used to correct the result generate by IR spectra
which result is mainly qualitative (IR analysis result do not show any quantitative
value besides the material contents) [3].
-
...
...--
Q-
SI ~
-
Ii
--
IS
i
.-1
,
1
II!
,
It
,
•
II
•
,
!T
1
o·
...-====-...-.-.- r i..
..
...
-
•
Ai •...
~_.
Jurnal Teknologi, Jilidfl. 1997
Table 7 Sample Wax Chromatography Analysis
Peak Con1Jonent Ture SarrpleArea Wax Content%
I Benzene(solvent) 1.542 SC Be OC
2 Straightchainalkanes 27.108 0.41
3 Straightchainalkanes 28.419 lAO
4 Straightchainalkanes 29.691 3.62
5 Straightchainalkanes 30.938 7.99
6 Straightchainalkanes 32145 11.14
7 Branched Alkanes 32.889 0.27
8 Straightchainalkanes 33.311 13.29
9 BranchedAlkanes 34.002 0.46
10 Straightchainalkanes 34.425 1218
II Braoched Alkanes 35.078 0.48
12 Straightchainalkanes 35.495 11.53
13 Braoched Alkanes 36.115 0.74
14 Qhelsalkanes 36.2AO 0.26
15 Straight chainalkanes 36.524 9.05
16 Braoched Alkanes 37.121 0.53
17 Qhersalkanes 37.243 0.38
18 Straightchainalkanes 37.518 7.40
19 Braoched Alkanes 38.093 0.59
20 QOO-salkanes 38.212 0.31
21 Straightchainalkanes 38.472 5.41
22 Braoched Alkanes 39.031 0.44
23 Qhersalkanes 39.152 0,33
24 Straightchainalkanes 39.399 3.92
25 Qhersa1kanes 39.773 0.28
26 Braoched Alkanes 39.943 0.40
27 Straightchaina1kanes 40.292 256
28 Qhersalkanes 40.681 0.28
29 BranchedAlkanes 40.825 0.30
30 Straightchainalkanes 41.160 1.55
31 Straight chainalkanes 42003 1.06
32 Straightchainalkanes 42.825 0.70
33 Straightchainalkanes 43.692 0.42
34 Straightchainalkanes 44.656 0.31
Content% 93.95 4.21 1.84 100.00
Jurnal Teknologi, Jilid II, 1997
4.6 Material Strength and Hardness
From strength test , wax filled tube was found to have more bigger potential to
withstand bending pressure as shown in Fig. 5. The action in filling the tube also
increase the tube strength compare to the non filled tube.
I .•
•••
I
I
1.10
~ Empty aluminum tube
...£J""'" Aluminum tube with ID clay fill .,.".,..,.,- Aluminum tube with paraffin wax fill
I .• 4.11
...
•••
II.'
II.'
14.0II.'
Fig.5 Instron Testing Machine - Strength Analysis
The average hardness value for the wax sample is 85.8 from the Shore A
readings and the average hardness value of ID clay sample is 23.1 also from the
Jurnal Teknologi, Jilid II, /997
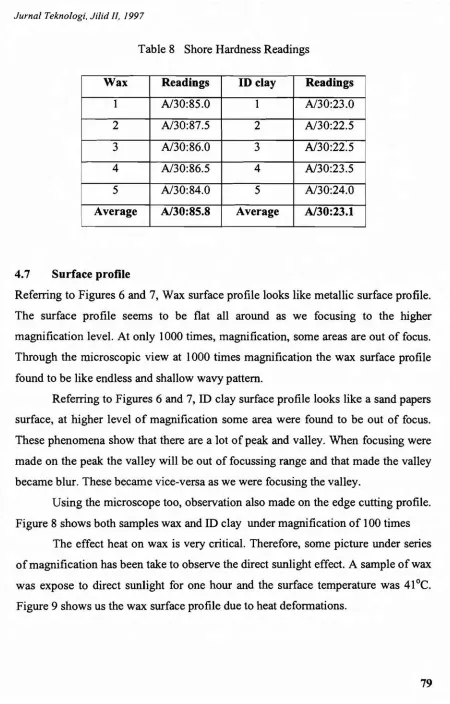
Table 8 Shore Hardness Readings
Wax Readings ID clay Readings
1 A/30:85.0 1 A/30:23.0
2 A/30:87.5 2 A/30:22.5
3 A/30:86.0 3 A/30:22.5
4 A/30:86.5 4 A/30:23.5
5 A/30:84.0 5 A/30:24.0
Average A/30:85.8 Average A/30:23.1
4.7 Surface profile
Referring to Figures 6 and 7, Wax surface profile looks like metallic surface profile. The surface profile seems to be flat all around as we focusing to the higher magnification level. At only 1000 times, magnification, some areas are out of focus. Through the microscopic view at 1000 times magnification the wax surface profile found to be like endless and shallow wavy pattern.
Referring to Figures 6 and 7, ID clay surface profile looks like a sand papers surface, at higher level of magnification some area were found to be out of focus. These phenomena show that there are a lot of peak and valley. When focusing were made on the peak the valley will be out of focussing range and that made the valley became blur. These became vice-versa as we were focusing the valley.
Using the microscope too, observation also made on the edge cutting profile. Figure 8 shows both samples wax and ID clay under magnification of 100 times
The effect heat on wax is very critical. Therefore, some picture under series of magnification has been take to observe the direct sunlight effect. A sample of wax was expose to direct sunlight for one hour and the surface temperature was 41°C. Figure 9 shows us the wax surface profile due to heat deformations.
Jurnal Teknologi, Jilid II, 1997
Table 8 Shore Hardness Readings
Wax Readings IDclay Readings
1 N30:85.0 1 N30:23.0
2 N30:87.5 2 N30:22.5
3 N30:86.0 3 N30:22.5
4 N30:86.5 4 N30:23.5
5 N30:84.0 5 N30:24.0
Average A/30:85.8 Average A/30:23.1
4.7 Surface profile
Referring to Figures 6 and 7, Wax surface profile looks like metallic surface profile. The surface profile seems to be flat all around as we focusing to the higher magnification level. At only 1000 times, magnification, some areas are out of focus. Through the microscopic view at 1000 times magnification the wax surface profile found to be like endless and shallow wavy pattern.
Referring to Figures 6 and 7, ID clay surface profile looks like a sand papers surface, at higher level of magnification some area were found to be out of focus. These phenomena show that there are a lot of peak and valley. When focusing were made on the peak the valley will be out of focussing range and that made the valley became blur. These became vice-versa as we were focusing the valley.
Using the microscope too, observation also made on the edge cutting profile. Figure 8 shows both samples wax and ID clay under magnification of 100 times
Jurnal Teknologi, Jilid1/, 1997
Fig. 6 Wax. And ID Clay Surface Under lOX Magnification
Fig.7 Wax. AndillClay Surface Under lOOX Magnification
Fig.8 Wax. AndillClay Edge Cutting Profile lOOX Magnification
Fig. 9 Wax Surface Heat Deformation Under lOX and lOOX Magnification
Jurnal- Teknologi, Ji/idII, 1997
5.0 DISCUSSIONS
During modelling, manual cutting and scraping is normally in practice. Cutting force used during cutting and scraping is related to the hardness of the material. From the shore hardness test, it found that the hardness of wax is approximately 4 times the hardness of the ID clay. Therefore, we can easily estimate how much the force is required to cut a wax or clay of the same thickness and at the same rate. In case of wax manual shaping, the model maker will have to adjust the working rate to suit the job specification and dimension.
Generally, there is not much change in the wax thermal characteristics. The solid-solid transitions temperature, help us in determine the working condition of the wax in our local condition. Variation of ambient temperature between 27° C to 35° C show that facilities to maintain the temperature below 32°C need to be considered.
Comparing the IR spectra between the new and recycled wax, the peaks presence in both spectra were almost similar. Except for one peak at 1719 represent Ketone of six membered types was not present in the new wax but occurred in the spectra of the recycle wax. This indicates that the recycle wax composition has changed. The source of this changed is not yet define, whether it is an effect of excessive heat or an additive compound collected through the Modelling experiment. Despite this difference, the performance of the recycle wax found to be similar to the new wax in practical.
From the cooling curve experiment, recorded change of volumes at the respective temperature, levels can be represents by a graph, corresponding to the cooling period. From Figure 1, the cooling curve graph indicates that between temperature 38° C and 27° C the volumetric change seems to be stabilized. The level of shrinkage at this period is 13.7 % to 14 %. Based on the local temperature range of 27° C and 35° C, the stable period is within the limit.
Jurnal Teknologi, JilidII, '997
Inthe observations surface profile, wax is much better than the surface of the
ID clay. In the real practice, ID clay always requires Dinoc film for quality measures
for surface finish and material protection. With wax in practice, the Dinoc film is
unnecessary item. The ID clay surface under magnification seems to be very porous
with a lot of holes and uneven height. Wax in comparison shows a very solid and
rigid surface, with minor pinholes and pitting trace problem.
Through this observation, the surface seems to be dramatically change under
the microscopic magnification. Under naked eyes observation, the surface seems to
get a new mat finish surface texture which is initially gloss finish. The condition of
the surface is similar to a surface after undergo sandblast process. One more fact that
learned from this observation is that there is no spot bubble or pinhole and pitting
trace problem. May be from the method of exposing to heat we could find a way to
improve the surface quality. Further studies should be suggests to finds out the
method of controlling the heat exposure for quality measures.
6.0 CONCLUSION
Through this experiment, wax has been proven viable as material in modelling. Its
technical properties give us some clear ideas of how to use wax in the local
environment. Hot and wet climate in Malaysia gives the ambient temperature range
between 27° C to 35° C. This range is lower than the wax softening range between
33° C to 40° C (Estimation figure from sections 5 and 4.3). During the experiment,
the studio environment, is not air-conditioned.
The wax specific gravity (density) is less than clay as describes in Table 2.
The usage of equal volume, given us half of the total weight. This property, allow us
to construct the based structure which required less strength to support the material.
Furthermore, less weight assisted us in handling and transferring the model.
The wax is harder than clay. The average value wax sample readings (table
7) isN30:85.8 and the average readings ofID clay sample is N30:23.1. The wax is
3.7 time harder than the ID clay (Section 4.6). The workability on shaping process
required more energy at the same rate of about 4 times. Even though to work with
Jurnal Teknologi, Jilid II, 1997
wax there is more hardship but the surface hardness have given us the assurance that the wax can withstand applied 4 times applied force. Stability of the surface here is the right words to describe the wax capability.
Surface finish is one more characterization that came into consideration when making model. Wax surface finish can be workout to the quality of gloss finish. Both materials have been observes under microscope. The clay surfaces and edges found to be rougher than wax. In normal application with additional cost, to overcome this unevenness, Dinoc film were introduces for improving the quality of the surface finish and protecting the clay from contaminated by coating and painting materials. The understanding of the material properties have given us some assistance in manipulating the material towards the modelling application.
REFERENCES
1. Freund, M. , Paraffin Product, Properties Technologies And Application, Elsevier Scientific Publishing Co, New York, 1982.
2. Algelt, K. H. And Gouw, T. H, Chromatography In Petroleum Analysis, Chevron Research Company Richmond, California, Marcel Dekker Inc, New York, 1979.