http://www.ijcmph.com pISSN 2394-6032 | eISSN 2394-6040
Original Research Article
Assessment of nutritional status among elderly population in a rural
area in Manipur: community-based cross-sectional study
Joymati O., Minita Ningombam*, Bishwalata Rajkumari, Agatha Gangmei
INTRODUCTION
Elderly population (≥60 years) are uniquely susceptible to malnutrition because of physiological, psychological and functional changes that occur with aging. As they become older, most of them start depending on others for their daily needs and majority of them have no financial support, inadequate access to food and live with other existing co-morbidities. Malnutrition in elderly is both a health outcome as well as a risk factor for diseases. It increases the risk both of morbidity and mortality among them.
Geriatric population is growing rapidly worldwide. According to WHO and UNFPA (2015) proportion of people aged ≥60 years is 12.3%.1,2 According to census,
proportion of elderly population in India has increased from 7.7 (2001) to 8.6% (2011) and in Manipur it is 7% (2011).3
In India, the magnitude of malnutrition among elderly is usually under reported. Only few studies have been conducted so far. Among these a study conducted by PSG Institute of Medical Sciences and Research, Coimbatore, Tamil Nadu in 2016 concluded that more than 50% of the
ABSTRACT
Background: Malnutrition in elderly (≥60 years) is both a health outcome as well as a risk factor for diseases. It increases the risk both of morbidity and mortality among them. Objectives of the study were to determine the prevalence of nutritional status among elderly people and any associated factors between nutritional status with selected variables of interest.
Methods: This cross-sectional study was conducted from March to April, 2017 in a rural community in Kongpal in Imphal East, Manipur in North-Eastern India. Using a structured interview schedule, data were collected from 245 elderly people aged ≥60 years. For nutritional assessment, Mini nutritional assessment tool (MNA) was used. Descriptive statistics like mean (SD) and Chi-square test was used. P<0.05 was taken as significant.
Results: A total of 250 eligible individuals participated. Mean age (SD) was 69.5 (±7.7) years and majority (82.4%) belonged to 60-74 age groups. Around three-fifth of the respondents (56.0%) reported they suffered from co-morbid illnesses. According to MNA tool, one-fifths (20.8%) of respondents were malnourished and 49.2% at risk of malnourished. Significant association was found between being malnourished with older age group, female gender, among unmarried/widow/widower, lower educational level, unemployed/ homemaker and financially dependent on other.
Conclusions: The overall prevalence of malnutrition and at risk of malnutrition in our study was 20.8% and 49.2%. Approaches to improve the nutritional status of the elderly should focus primarily on those who are older, low educational status, female gender and financially dependence.
Keywords: Elderly people, Nutritional status, Mini nutritional assessment tool
Department ofCommunity Medicine, JNIMS, Manipur, India
Received: 30 April 2018
Accepted: 01 June 2018
*Correspondence:
Dr. Minita Ningombam, E-mail: [email protected]
Copyright: © the author(s), publisher and licensee Medip Academy. This is an open-access article distributed under the terms of the Creative Commons Attribution Non-Commercial License, which permits unrestricted non-commercial use, distribution, and reproduction in any medium, provided the original work is properly cited.
elderly population were underweight and more than 90% had an energy intake below the recommended allowance.4
Although thorough and comprehensive clinical
evaluations of nutritional status is ideal but practically they are time-consuming and often inconvenient in community setting. The Mini nutritional assessment (MNA) tool is a well-validated questionnaire for rapid assessment of the nutritional status of elderly people.5,6
According to a study conducted in India, MNA tool
demonstrated a sensitivity of 90.2% and specificity of 96.4% in identifying well-nourished and malnourished elderly.7
There has not been any study published so far to highlight the nutritional status among elderly population in Manipur. Considering the above views, it is felt important that assessment of nutritional status should be conducted to determine the prevalence of nutritional status among elderly people aged ≥60 years and any associated factors
between nutritional status with selected
socio-demographic variables such as age, sex, education, financial dependence etc.
METHODS
This community-based cross-sectional study was
conducted among elderly people aged ≥60 years who were residing in the Kongpal and its adjoining areas in Imphal East District, Manipur in North East, India during March to April, 2017. Seriously ill or paralyzed or
suffered from major psychiatric disorders like
schizophrenia, bipolar disorders, etc. and those who couldn't be met even after two consecutive visits and refusals to participate were excluded. Sample size was calculated based on prevalence of 15% of malnourished among elderly.8 Using 5% absolute allowable error, at 95% confidence level and a non-response rate of 20% a sample size of 245 was calculated. Convenience sampling was used to select the household. Only one eligible individual was included in the study. If there were more than one eligible participant in a household, lottery method was done to select the eligible participant. A pre–designed structured interview schedule was used for data collection which consists of two sections, namely socio-demographic characteristics and Mini nutritional assessment tool (MNA). MNA tool is a well-validated questionnaire designed by the Nestle Nutrition Institute in Lausanne (Switzerland) for elderly people which comprises of 18 questions based on four domains: (a) Anthropometric measurements, (b) Dietary assessment, (c) Global health and social assessment, (d) Subjective assessment of health and nutrition.9
Four anthropometric measurements- weight, height, mid
upper arm circumference (MUAC) and calf
circumference were taken by the surveyors. The respondents’ body weight was measured using a digital weighing scale to the nearest 0.1 kg and their height was measured using a stadiometer and mid upper arm
circumference (MUAC), and calf circumference were measured to the nearest 0.1 cm using a non-stretchable measuring tape. Operational definition: According to the score obtained using MNA tool, nutritional status was categorized as: Normal nutritional status (24-30 points), at risk of malnutrition (17-23.5 points) and malnourished (<17 points). Smoking habit was categorized into three groups: never smoker, current smoker (smoking for at least a year), and former smoker (quit over one year ago). Alcohol consumption was defined as: never, infrequent (consumed once in a month), frequent (who consumed once or more in a week). Tobacco consumption as never, former (stopped for the past one year), current (currently consuming tobacco).
Statistical analysis
Collected data was entered into Ms Excel and data
cleansing was performed. Data was then transferred into IBM SPSS version 21 software and analysed. Descriptive statistics like mean, standard deviation and percentage were used. Analytical statistic like chi-square test was applied. P-value of <0.05 was taken as statistically significant.
Ethical approval
The study was approved by the Institutional Ethics
Committee, JNIMS, Porompat. Informed verbal consent from all the participants were obtained before the interview. All identifiers were removed from collected data and confidentiality was maintained.
RESULTS
A total of 250 eligible individuals participated. Table 1 shows the socio-demographic profile of the study population. The mean age (SD) was 69.5 (±7.74) years. Majority (206, 82.4%) belonged to the age group of 60-74 years. Male and female ratio was 1:1.3 (108, 43.2% vs. 142, 56.8%). Around three-fifths of the respondents (149, 59.6%) were currently married, Majority (90, 36%) were illiterate and were self-employed during adulthood (110, 44%), Almost all the respondents stayed with their family (246, 98.4%) except four of them who stayed alone. Majority of the respondents were financially dependent (152, 60.8%) on others for their daily needs. Around three-fifth of the respondents (140, 56.0%) reported they suffered from co-morbid illnesses. Among them majority reported hypertension (82, 58.6%) and diabetes (30, 21.4%). Around one-fourth of the respondents were ever alcoholic and about half of them were ever smokers. Around half of the respondents consumed tobacco.
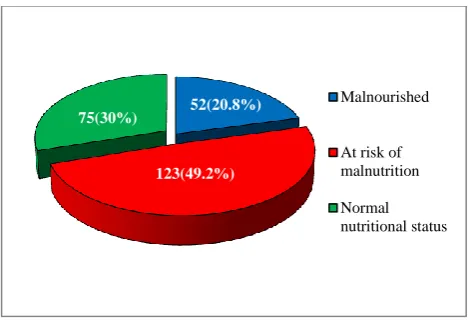
Figure 1 showed that around one-fifths of the respondents (52, 20.8%) were malnourished and around half of them (123, 49.2%) were at risk of malnourished. However, only 75 (30%) respondents were nourished. There were significant association between being malnourished with
unmarried/widow/widower, lower educational level, unemployed/ homemaker, financially dependent on other, ever smoker.
Table 1: Socio-demographic characteristics of the study participants (n=250).
Characteristics Number Percentage (%) Age (Mean±SD) 69.5±7.4
Age group (yrs)
60-74 206 82.4
75-84 33 13.2
≥85 11 4.4
Gender
Male 108 43.2
Female 142 56.8
Religion
Hindu 109 43.6
Islam 82 32.8
Meitei 25 10.0
Christian 34 13.6
Marital status
Currently married 149 59.6
Unmarried 6 2.4
Widow/widower 95 37.0
Education
Illiterate 90 36.0
Primary 31 12.4
Middle 34 13.6
Secondary 74 29.6
Tertiary 21 8.4
Occupation (previously)
Govt. employed 54 21.6
Private employed 10 4.0
Self employed 110 44.0
Unemployed/homemaker 76 30.4
Stay with family
Yes 246 98.4
No 4 1.6
Financial dependence
Yes 152 60.8
No 98 39.2
Co-morbid illness
Yes 140 60.8
No 110 39.2
Alcohol consumption
Never 187 74.8
Infrequent 45 18.0
Frequent 18 7.2
Smoking status
Never 131 52.4
Former 55 22.0
Current 64 25.6
Tobacco intake
Never 128 51.2
Former 34 13.6
Current 88 35.2
Figure 1: Distribution of the study population according to nutritional status (n=250). DISCUSSION
In the present study, the prevalence of malnourished among elderly population was 20.8% and at risk of malnutrition was 49.2%. The study findings were comparable to other studies conducted in Karnataka and
Coimbatore were they reported malnourished among
elderly population as 22% and 19.5% respectively.10,11 However, our findings was much higher than studies conducted in Assam (15%), Tamil Nadu (14%), Rajasthan (11.6%) and Kerala (7%) but lower than a study conducted in West Bengal by Lahiri et alin 2014 where they reported 29% malnourishment among elderly population.7,8,12-14 These differences in the prevalence of malnourished among elderly population could be because
of the differences in the socio-demographic
characteristics of the study participants in these various study settings.
In the present study, elderly who are at risk of malnutrition is more than actually malnourished. Our finding is consistent with other community-based studies conducted among elderly population in India and other parts of the world.7,8,10-18 This showed that MNA tool is better at identifying those at risk of malnutrition from among the apparently healthy elderly population. This emphasizes the fact that high prevalence of risk of malnutrition indicates high proportion of elderly with deficient protein-energy intake without obvious clinical signs of malnutrition. Therefore MNA tool should be incorporated in routine geriatric assessment so that the physician can identified those at risk of developing malnutrition and timely intervention can be initiated, as we know that prevention is better than cure.
The study shows a significant association between malnourishment and older age group, female gender, low educational status and financial dependence were noted. These findings were also observed in various studies conducted across the different states in India and neighbouring countries like Nepal, Bangladesh.8,12-16
52(20.8%)
123(49.2%) 75(30%)
Malnourished
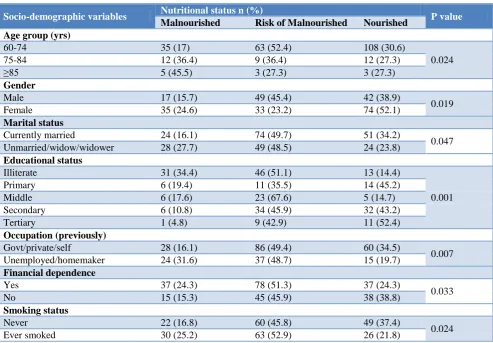
Table 2: Nutritional status of participants and associated factors.
Socio-demographic variables Nutritional status n (%) P value Malnourished Risk of Malnourished Nourished
Age group (yrs)
60-74 35 (17) 63 (52.4) 108 (30.6)
0.024
75-84 12 (36.4) 9 (36.4) 12 (27.3)
≥85 5 (45.5) 3 (27.3) 3 (27.3)
Gender
Male 17 (15.7) 49 (45.4) 42 (38.9)
0.019
Female 35 (24.6) 33 (23.2) 74 (52.1)
Marital status
Currently married 24 (16.1) 74 (49.7) 51 (34.2)
0.047
Unmarried/widow/widower 28 (27.7) 49 (48.5) 24 (23.8)
Educational status
Illiterate 31 (34.4) 46 (51.1) 13 (14.4)
0.001
Primary 6 (19.4) 11 (35.5) 14 (45.2)
Middle 6 (17.6) 23 (67.6) 5 (14.7)
Secondary 6 (10.8) 34 (45.9) 32 (43.2)
Tertiary 1 (4.8) 9 (42.9) 11 (52.4)
Occupation (previously)
Govt/private/self 28 (16.1) 86 (49.4) 60 (34.5)
0.007
Unemployed/homemaker 24 (31.6) 37 (48.7) 15 (19.7)
Financial dependence
Yes 37 (24.3) 78 (51.3) 37 (24.3)
0.033
No 15 (15.3) 45 (45.9) 38 (38.8)
Smoking status
Never 22 (16.8) 60 (45.8) 49 (37.4)
0.024
Ever smoked 30 (25.2) 63 (52.9) 26 (21.8)
This maybe because older the age, the person become less active and often reported to have reduced appetite due to physiological changes or presence of co-morbid illness, as a result decreased food intake. Similarly, significant association between malnourishment and female gender could be attributed to the role of women in society like the effect of traditional habits of eating at last after serving men and children and also usually share the remaining food which may be less nutritious. The present study highlight higher educational status had the best nutritional status. Similar finding was also observed in other studies conducted in various parts of India and neighboring countries.8,12-16 This could be because those with higher education may have better awareness about the nutritious food, healthy lifestyle and active aging.
In this study there was significant association between malnourishment and financial dependency which was consistent with other studies.8,12-16 This could be because intake of food or choices all depend on the purchasing power. Therefore, if an elderly is financially independent, he or she can be decisive about food intake. One of the limitations of this study was majority of the answers were self-reported. This may lead to over reporting or under reporting of co-morbid illness, smoking status etc.
CONCLUSION
The overall prevalence of malnutrition and at risk of malnutrition in our study was 20.8% and 49.2%. Approaches to improve the nutritional status of the elderly should focus primarily on those who are older, low educational status, female gender and financially dependence. One such approach is that the government should give the old age pension regularly on a monthly basis so that the elderly people can be financially independent unlike what is currently practised in Manipur, where they are not given on monthly basis. Moreover, in any targeted nutritional interventions, priority should be given to elderly females. Further research should be conducted to determine the specific causes of this gender inequality in nutritional status of the elderly.
Funding: No funding sources Conflict of interest: None declared
Ethical approval: The study was approved by the Institutional Ethics Committee
REFERENCES
1. WHO Ageing and Health Factsheet. Available at:
2. Ageing. Available at: www.unfpa.org/ageing. Accessed on 22 April 2017.
3. Population composition-Census of India. Available
at: www.censusindia.gov.in>9chap2-20ll. Accessed on 22 April 2017.
4. Mathew AC, Das D, Sampath S, Vijayakumar M,
Ramakrishnan N, Ravishankar SL. Prevalence and correlated of malnutrition among elderly in an urban area in Coimbatore. Indian J Public Health. 2016;6(2):112-7.
5. Guigoz Y, Vellas B, Garry PJ. Assessing the
nutritional status of the elderly: the Mini Nutritional Assessment as part of the geriatric evaluation. Nutr Rev. 1996;54:S59–65.
6. Kinsella, K, Suzman, R. Demographic dimensions
of population aging in developing countries. Am J Hum Biol. 1992.4:3–8.
7. Jose S, Kumari KS. Validity assessment of MNA
among an elderly population in Kerala, South India.
International J of Advanced Research.
2014;2(2):214-21.
8. Agarwalla R, Saikia AM, Baruah R. Assessment of
the nutritional status of the elderly and its correlates in Guwahati, Assam. J Family Community Med. 2015;22(1):39-43.
9. Guigoz Y. The Mini Nutritional Assessment (MNA)
review of the literature –what does it tell us? J Nutr Health Aging. 2006;10:466–85.
10. Kansal D, Baliga SS, Kruthika K, Mallapur DM.
Nutritional assessment among elderly population of rural Belagavi: a cross-sectional study. Int J Med Sci Public Health. 2016;5(4):1496-9.
11. Mathew AC, Das D, Sampath S, Vijayakumar M,
Ramakrishnan N, Ravishankar SL. Prevalence and correlates of Malnutrition among Elderly in an Urban Area in Coimbatore. Indian J Public Health 2016;60(2):112-7.
12. Vedantam A, Subramanian V, Rao NV, John KR.
Malnutrition in free-living elderly in rural South India: prevalence and risk factors. Public Health Nutr. 2009;13(9):1328-32.
13. Shivraj M, Singh VB, Meena BL, Singh K, Neelam
M, Sharma D, et al. Study of nutritional status in
elderly in Indian population. IJCR.
2014;6(11):10253-57.
14. Lahiri S, Biswas A, Santra S, Lahiri SK.
Assessment of nutritional status among elderly population in the rural areas of West Bengal, India. Int J Med Sci Public Health. 2015;4(4):569-72.
15. Ghimire S, Baral BK, Callahan K. Nutritional
assessment of community-dwelling older adults in rural Nepal. PLoS ONE. 2017;12(2).
16. Baweja S, Agarwal H, Mathur A. Assessment of nutritional status and related risk factors in community dwelling elderly in western Rajasthan. J Indian Acad Geriatr. 2008;4:5–13.
17. Kabir ZN, Ferdous T, Cederholm T, Khanam MA,
Streatfied K,Wahlin A. Mini Nutritional Assessment of rural elderly people in Bangladesh: the impact of demographic, socio-economic andhealth factors. Public Health Nutr. 2006;9:968–74.
18. Cuervo M, Garcı´a A, Ansorena D, et al. Nutritional
assessment interpretation on 22,007 Spanish community dwelling elders through the Mini Nutritional Assessment test. Public Health Nutr. 2009;12:82–90.
Cite this article as: Joymati O, Ningombam M,
Rajkumari B, Gangmei A.Assessment of nutritional