Original Research Article
Trend of leptospirosis and its association with meteorological factors in
Thrissur district, Kerala
Alok Kanjhoor Premdas, Binu Areekal
*
, Sudhiraj Thiruthara Sukumaran,
Ashwin Raj Kunnumel Kandi
INTRODUCTION
Leptospirosis is a bacterial disease that affects humans and animals. It is caused by bacteria of the
genus Leptospira. In human beings leptospirosis can
manifest as mild febrile illness to severe life threatening forms like Weil’s disease.
Leptospirosis is one of the world's most common zoonosis especially in tropical countries. The prevalence of leptospirosis as per WHO ranges from 0.1 to 1 per 100
000 per year in temperate climates to 10 or more per 100 000 per year in the humid tropics. During outbreaks and in high risk groups, disease incidence may reach over 100
per 100000.1
Virtually all mammalian species can harbour leptospires in their kidneys and act as source of infection to human beings. Rodents were the first recognized carriers of leptospirosis. They are the only major animal species that can shed leptospires throughout their lifespan without
clinical manifestations, i.e., prolonged carrier state.2
ABSTRACT
Background: Leptospirosis is a common zoonosis caused by bacteria, Leptospira. The core determinants of the
disease are the presence of carrier animals, environmental factors and the interaction between man, carrier and the environment. Understanding the type of relation between these factors and leptospirosis will help in controlling the disease. The current study intends to find the trend of leptospirosis cases, to forecast the disease and to correlate number of cases of leptospirosis with meteorological factors.
Methods: The data of leptospirosis cases and the meteorological factors in Thrissur district were collected and
entered in MS- Excel and statistical analysis was done using SPSS-16.0. For analysing the trend and to forecast the same, time series analysis method was used. The correctness of the model was tested using Ljung-Box statistics.
Results: Time series chart, autocorrelation and partial autocorrelation show leptospirosis follows a seasonal trend.
Forecasting of leptospirosis cases from July 2018 to May 2019 made by the model matched with original number reported in Thrissur district. Cross correlation of total rainfall and total rainy days showed that leptospirosis peak approximately 1 month after the onset or together with the rain (lag-1 and 0, r0.471 and 0.380 for total rainfall, lag-1 and 0, r0.501 and 0.469 for total rainy days). Humidity positively affects number of leptospirosis cases (lag-1 and 0, r0.464 and 0.435). June to October, seasonally adjusted factor (SAF) was >100% with highest SAF in August (202.2%).
Conclusions: Leptospirosis shows a seasonal trend with more cases in June to October and correlates with change in
meteorological factors of the region.
Keywords: Leptospirosis, Trend, Forecast, Meteorological factors, Time series analysis
Department of Community Medicine, Government Medical College, Thrissur, Kerala, India
Received: 02 September 2019
Revised: 07 October 2019
Accepted: 09 October 2019
*Correspondence: Dr. Binu Areekal,
E-mail: [email protected]
Copyright: © the author(s), publisher and licensee Medip Academy. This is an open-access article distributed under
the terms of the Creative Commons Attribution Non-Commercial License, which permits unrestricted non-commercial use, distribution, and reproduction in any medium, provided the original work is properly cited.
However, cattle, buffaloes, horses, sheep, goat, pigs, dogs and rodents are common reservoirs of leptospires.
The infection is generally transmitted to humans by water that has been contaminated by animal urine, which comes in contact with skin abrasions or with the mucous membranes. The bacteria can survive for weeks to
months in urine-contaminated water and soil.3
Approximately 90% of clinical illnesses present as a nonspecific acute febrile illness, while approximately 10% progress to severe, potentially fatal illness with multi-organ dysfunction. The case fatality rate for leptospirosis is approximately 5-15% among patients with severe illness. Among patients with severe pulmonary haemorrhagic syndrome, the case fatality rate
can exceed 50%.4
The core determinants of the disease are the presence of carrier animals, environmental factors and the interaction between man, carrier and the environment. Leptospirosis follows a seasonal pattern in most countries and meteorological factors play an important role in its aetiology. The most important environmental factors associated with leptospirosis are temperature, humidity
and rainfall prevalent in the region.5 An understanding of
the type of relation between these factors and leptospirosis will go a long way in controlling the leptospirosis menace in a community. If we are able to predict the occurrence of cases early enough, it would be a great help to the health administrators to take appropriate actions to control and prevent future outbreaks. The current study intends to find out the trend of leptospirosis cases from January 2013 to June 2018 in Thrissur district, Kerala and to forecast leptospirosis cases in the district from July 2018 to May 2019 based on the above data. The study also intended to find out the cross correlation of number of cases of leptospirosis with different meteorological factors in the region.
METHODS
The month wise data of leptospirosis cases in Thrissur district was obtained from the office of Integrated Disease Surveillance Project (IDSP), Thrissur. The cases of leptospirosis in IDSP were defined as IgM/MAT positivity for leptospiral antibodies. The meteorological data (maximum and minimum temperature, humidity, rainfall, total number of rainy days) were obtained from Agro-meteorological Department of Horticulture College, Thrissur. The study has been approved by the Institutional ethical committee, Government Medical College, Thrissur.
Statistical analysis
The data was initially entered in MS- Excel and further statistical analysis was done using the software SPSS-16.0 version. For analysing the trend of leptospirosis in the region and to forecast the same, time series analysis
method was used. Time series analysis is the ideal method of analysing a series of observations which are correlated over time by fitting the best model. Trend analysis using time series method was done from January 2013 to June 2018 and forecasting was attempted from July 2018 to May 2019. Forecasting was done by comparing with actual number of confirmed leptospirosis cases reported to Thrissur district as per IDSP data in the period July 2018 to May 2019. For creating the time series, the expert modeller method in SPSS was used. For finding out time trend and forecasting, number of cases of leptospirosis was used as the dependant variable and the
meteorological factors (maximum and minimum
temperature, humidity, rainfall, total number of rainy days) were used as independent variables for modelling. We tested the correctness of the model using Ljung-Box statistics. Ljung-Box test is a diagnostic tool used to test
the lack of fit of a time series model.6 The test is applied
to the residuals of a time series after fitting an autoregressive moving average model to the data. The test examines autocorrelations of the residuals. If the autocorrelations are very small, we conclude that the model does not exhibit significant lack of fit. Autocorrelation and partial autocorrelation functions were used to check for trend and seasonality. Cross correlation function in time series was used to find out the relationship between dependent and independent variables.
RESULTS
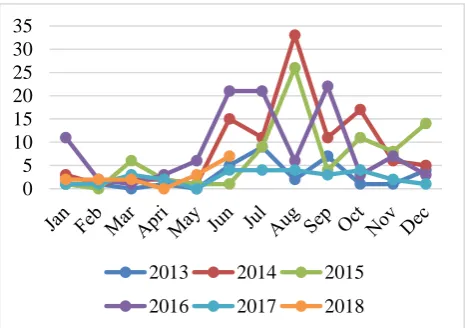
Total number of leptospirosis cases reported in Thrissur district from January 2013 to June 2018 was 373. Maximum number of cases was reported in the year 2014 (107 cases) followed by 2016 (106 cases). Least number of cases was reported in 2017 (29 cases). Comparing the monthly data of leptospirosis cases from 2013-2018, clearly shows that the number of cases starts to increase every year from June, reaches peak in august and comes down to basal levels by September/October (Figure 1). This corresponds with the rainy season of Kerala every year.
Figure 1: Trends of leptospirosis in Thrissur district (2013-2018).
0 5 10 15 20 25 30 35
2013 2014 2015
The time series chart created by SPSS with number of cases of leptospirosis as dependent variable and meteorological factors as independent variable showed seasonal periodic fluctuations. The expert modeller in SPSS suggested a simple seasonal model as the best fitting model for this time series data. Ljung- Box statistics test indicated that the model was correctly specified for the data [p=0.349 (p>0.05)]. The expert modeller did not find any outliers in the model.
Figure 2: Residual autocorrelation and partial auto correlation of leptospirosis cases.
Autocorrelation and partial autocorrelation showed that leptospirosis follows a seasonal trend. Both these showed significant values at lag of 12, indicating seasonal variation (Figure 2). Since seasonality is present, instead of R square, stationary r square is taken as the model’s r
value.7 It is a measure that compares the stationary part of
the model to a simple linear model. Positive value means that the model under consideration is better than baseline model. In our model, stationary r square was 0.775 and r square was 0.387. R square shows how much of the variation can be explained by the model. In this case 77.5% of the variations in number of cases could be explained with the model.
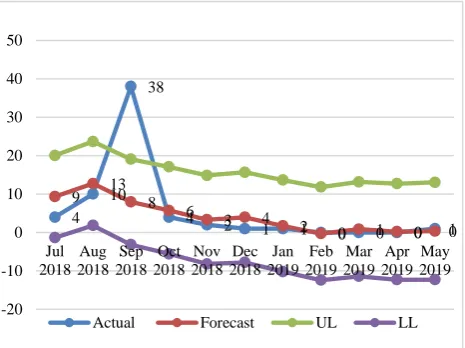
Figure 3: Forecast of leptospirosis cases from July 2018-May 2019.
As per the figure (Figure 3) it can be seen that the forecast for number of leptospirosis cases from July 2018 to May 2019 made by the model matches with original number reported in Thrissur district as per IDSP data. Only variation in the prediction was in September 2019. But it must be remembered that there was an epidemic of leptospirosis cases following the massive flood that affected Kerala in the later part of August 2018.
Figure 4: Relationship of temperature and number of cases of leptospirosis.
Figure 5: Cross correlation function of mean temperature maximum and number of cases of
leptospirosis.
To find out the associations of meteorological factors with number of cases of leptospirosis, cross correlation function was used. On cross correlation between maximum temperature and cases it can be seen that the highest r value (r=-0.524) was obtained for lag 0 showing that during the months in which maximum temperature was high, number of leptospirosis cases was low. It can also be seen from the graph (Figure 4 and 5), wherever lowest points of maximum temperature are seen, cases of leptospirosis are peaking.
4 10
38
4 2
1 1 0 0 0 1 9 13 8
6
3 4
2 0 1 0 0
-20 -10 0 10 20 30 40 50
Jul 2018
Aug 2018
Sep 2018
Oct 2018
Nov 2018
Dec 2018
Jan 2019
Feb 2019
Mar 2019
Apr 2019
May 2019
Actual Forecast UL LL
0 5 10 15 20 25 30 35 40
Jan
-1
3
M
ay
-1
3
S
ep
-1
3
Jan
-1
4
M
ay
-1
4
S
ep
-1
4
Jan
-1
5
M
ay
-1
5
S
ep
-1
5
Jan
-1
6
M
ay
-1
6
S
ep
-1
6
Jan
-1
7
M
ay
-1
7
S
ep
-1
7
Jan
-1
8
M
ay
-1
8
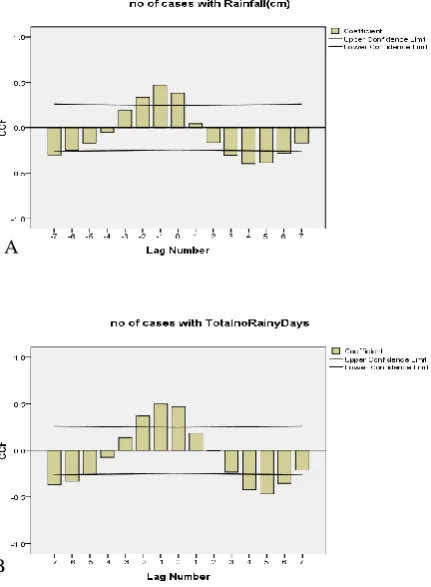
It can be seen from the cross correlation of total rainfall in cm and total rainy days with number of cases of leptospirosis, maximum r value has been found in -1 lag and 0 lag, r=0.471 and 0.380 for total rainfall, for total number of rainy days -1 lag and 0 lag, r=0.501 and r=0.469. Both clearly show that the cases of leptospirosis peak approximately 1 month after the onset of rain or together with the rain (Figures 6, 7A and 7B).
Figure 6: Relationship of rainfall and number of cases of leptospirosis.
Figure 7: Cross correlation function of rainfall and number of rainy days with number of cases of
leptospirosis.
As for the relationship between relative humidity and cases of leptospirosis, maximum r value was obtained in -1 and 0 lag (r=0.464 and 0.435), again shows humidity is positively affecting number of cases of leptospirosis (Figures 8 and 9).
Table 3 summarizes that from the month of June to October seasonally adjusted factor (SAF) was >100%. It means that there were more cases of leptospirosis compared to the typical months. Among them August recorded the highest SAF with 202.2% followed by July 189.1% and September 173.7%.
Figure 8: Relationship of humidity and number of cases of leptospirosis.
Figure 9: Cross correlation function of mean relative humidity and number of cases of leptospirosis. DISCUSSION
The current study in Thrissur district reported 373 cases of leptospirosis from 2013-2018 whereas the whole Kerala had 8183 cases during the same period. There was 0
20 40 60 80 100 120
Jan
-1
3
Ju
n
-1
3
No
v
-1
3
Ap
r-1
4
Sep
-1
4
Feb
-1
5
Ju
l-1
5
Dec-1
5
Ma
y
-1
6
Oct-1
6
Ma
r-1
7
Au
g
-1
7
Jan
-1
8
Ju
n
-1
8
no of cases Rainfall(cm)
TotalnoRainyDays
0 10 20 30 40 50 60 70 80 90 100
Jan
-1
3
Ju
n
-1
3
No
v
-1
3
Ap
r-1
4
S
ep
-1
4
Feb
-1
5
Ju
l-1
5
Dec
-1
5
Ma
y
-1
6
Oct-1
6
Ma
r-1
7
Au
g
-1
7
Jan
-1
8
Ju
n
-1
8
no of cases MeanRelativeHumidity(%)
A
an increase in number of cases from 2013 to 2018 as per the DHS Kerala data (814 to 2078). Monthly data in the current study showed peak of cases between June to October whereas the state data showed peaks from June
to November.8 This is similar to the study conducted by
Sethi et al in North India which showed a hike in
leptospirosis cases between June to October.9 The study
conducted by Pawar et al in Ratnagiri, Maharashtra
showed Leptospirosis peak from July to November.10 The
seasonality of leptospirosis especially between June to November could easily be attributed to its relationship with rainfall, flooding and temperature variations.
It can be seen from Figures 8 and 9, the number of cases of leptospirosis increases with each spike in humidity. It
has been noted that pathogenic Leptospira spp. does not
multiply outside the host. In the environment, they require high humidity for survival and are killed by
dehydration or temperatures greater than 50°C (122°F).11
Similar relationship between cases of leptospirosis and humidity have also been obtained by Pawar et al in Maharashtra who found out a significant positive cross-correlations between monthly leptospirosis cases and relative humidity, which are lagged by 0 to 1 month and shows the strongest significant correlation r=0.70 between relative humidity and number of patients of
leptospirosis.10 Similar results have been found out from
studies from Srilanka by Ehelopola et al which showed leptospirosis incidence follows the same pattern of temporal changes of average weekly humidity after a lag
period.12
The current study also found a positive correlation between rainfall and number of leptospirosis cases (Figures 6 and 7A). This relationship have also been
found out from the study conducted by Matsushita et al in
Philippines who found out that the risk of post-rainfall, leptospirosis peaked at a lag of 2 weeks (using 0 cm/week rainfall as the reference) with RRs of 1.30, 1.53, 2.45, 4.61, and 13.77 for light, moderate, heavy, intense and torrential rainfall (at 2, 5, 16, 32 and 63 cm/week), respectively.13 In the study conducted by Pawar et al in Maharashtra rainfall was associated with increasing cases of leptospirosis at a lag of 1-2 months similar to our
study.10 Flooding after rainfall can force humans and
rodents into closer contact, which can result in further contamination of surrounding water. As per the article by Pappachan et al, periods of heavy rain followed by days of little or no rain seemed to be the setting for leptospirosis epidemics in Kerala. In this scenario Leptospira multiplies in the walking paths, where water remained undrained for a period of two to three days after the rains.14 Most people in the state wore rubber chappals during the rainy season, which offered little protection against possible infection.
From Figures 4 and 5 showing cross correlation between maximum temperature and cases, it can be seen that the highest r value (r-0.524) was obtained for lag 0 showing that during the months in which maximum temperature
was high, number of leptospirosis cases was low. It can also be seen from the figure (Figures 4 and 5) that, wherever lowest points of maximum temperature are seen, cases of leptospirosis is peaking. As per Chadsuthi et al from Thailand; who modelled seasonal leptospirosis transmission and its association with rainfall and temperature in Thailand using time-series and ARIMAX analyses found out a close relationship between
temperature and cases of leptospirosis.15 Rodents as well
as Leptospira require hot and humid conditions to survive, 28-30ºC being the optimum temperature for the growth. In Thrissur a mean maximum temperature of 28-30ºC is seen during the rainy season, which also corresponds with the high humidity resulting in increased cases of leptospirosis in these months.
CONCLUSION
The current study shows a seasonal pattern of leptospirosis in Thrissur district. It also shows the validity of forecasting models in time series analysis for correctly predicting future trends of disease in the community. For
relationship between metrological factors and
leptospirosis, it was found that leptospirosis is closely related with amount of rainfall and rainy days, humidity and temperature between 28-30º.
Recommendations
The authors recommends the extensive use of time series models in prediction of other communicable disease not only at the district level but also at the state level so as to strengthen the health systems capability of handling epidemics in the future.
ACKNOWLEDGEMENTS
The authors would like to place on record their sincere gratitude to IDSP, Thrissur including the district surveillance officer for data on leptospirosis. Heartfelt thanks also to Dr. Ajith Kumar, Head of Agro-meteorological Department of Horticulture College, Thrissur for meteorological data.
Funding: No funding sources Conflict of interest: None declared
Ethical approval: The study was approved by the Institutional Ethics Committee
REFERENCES
1. WHO. Leptospirosis Burden Epidemiology
Reference Group (LERG). Available at: https:// www.who.int/zoonoses/diseases/lerg/en/. Accessed on 30 August 2019.
2. Regional office for South East Asia.
3. Leptospirosis- fact sheet for clinicians. Available at:
https://www.cdc.gov/leptospirosis/pdf/fs-leptospirosis-clinicians-eng-508.pdf. Accessed on 30 August 2019.
4. Leptospirosis: Practice Essentials, Background,
Pathophysiology. Available at: https://emedicine. medscape.com/article/220563-overview. Accessed on 30 August 2019.
5. Joshi YP, Kim EH, Cheong HK. The influence of
climatic factors on the development of hemorrhagic fever with renal syndrome and leptospirosis during the peak season in Korea: an ecologic study. BMC Infect Dis. 2017;17:406.
6. 6.4.4.8.1. Box-Ljung Test. Available at: https://
www.itl.nist.gov/div898/handbook/pmc/section4/p mc4481.htm. Accessed on 31 August 2019.
7. Time Series Model Nugget, 2014. Available at:
www.ibm.com/support/knowledgecenter/en/ss3ra7_ 15.0.0/com.ibm.spss.modeler.help/timeseries_model node.htm. Accessed on 31 August 2019.
8. Director of health services. Public Health. Public
health data, DHS Kerala. 2018. Available at: http://dhs.kerala.gov.in/index.php/publichealth.html. Accessed on 30 August 2019.
9. Sethi S, Sharma N, Kakkar N, Taneja J, Chatterjee
SS, Banga SS, et al. Increasing Trends of Leptospirosis in Northern India: A Clinico-Epidemiological Study. PLoS Negl Trop Dis. 2010;4(1):e579.
10. Pawar SD, Kore M, Athalye A, Thombre PS.
Seasonality of leptospirosis and its association with rainfall and humidity in Ratnagiri, Maharashtra. Int J Health Allied Sci. 2018;7(1):37.
11. Spickler AR, Leedom Larson KR.
Leptospirosis.pdf. Technical Factsheets, 2013. Available at: http://www.cfsph.iastate.edu/Factshee ts/pdfs/leptospirosis.pdf. Accessed on 30 August 2019
12. Ehelepola NDB, Ariyaratne K, Dissanayake WP.
The correlation between local weather and leptospirosis incidence in Kandy district, Sri Lanka from 2006 to 2015. Glob Health Action. 2019;12(1):1553283.
13. Matsushita N, Ng CFS, Kim Y, Suzuki M, Saito N,
Ariyoshi K, et al. The non-linear and lagged short-term relationship between rainfall and leptospirosis and the intermediate role of floods in the
Philippines. PLoS Negl Trop Dis.
2018;12(4):e0006331.
14. Pappachan MJ, Sheela M, Aravindan KP. Relation
of rainfall pattern and epidemic leptospirosis in the Indian state of Kerala. J Epidemiol Community Health. 2004;58(12):1054.
15. Chadsuthi S, Modchang C, Lenbury Y,
Iamsirithaworn S, Triampo W. Modeling seasonal leptospirosis transmission and its association with rainfall and temperature in Thailand using time-series and ARIMAX analyses. Asian Pacific J Trop Med. 2012;5(7):539-46.
Cite this article as: Premdas AK, Areekal B,
Sukumaran ST, Kandi ARK.Trend of leptospirosis