Original Research Article
Ambient air pollution and the susceptibility to develop pulmonary
tuberculosis: a multi country ecological study
Renuka K.
*
, Gopalakrishnan S., Umadevi R.
INTRODUCTION
Tuberculosis is an infectious disease caused by
Mycobacterium tuberculosis. It spreads from one person
to another mainly by droplet infection. Tuberculosis is one of the top 10 causes of death worldwide in 2017, there were an estimated 10 million new (incident) TB cases worldwide and about 1.3 million deaths was caused by tuberculosis among the HIV negative individuals during 2017.1 Despite many progress in the development
of treatment of tuberculosis we are still not able to end the epidemic of the disease.
Although Mycobacterium tuberculosis is the causative agent many environmental factors play a role in disease progression. Several respiratory hazards including smoking and indoor air pollution were suggested to increase the risk of tuberculosis, but only fewer studies has been conducted on the association between ambient air pollution and tuberculosis.
ABSTRACT
Background: Tuberculosis remains a major global health problem with 10.4 million incident cases in 2016. Although Mycobacterium tuberculosis is the causative agent, many environmental factors play a role in disease progression. Several respiratory hazards including smoking and indoor air pollution were suggested to increase the risk of tuberculosis, but only fewer studies has been conducted on the association between ambient air pollution and tuberculosis.
Methods: Data on ambient air quality levels (annual mean concentration of particulate matter 2.5 µg/m3) for the year 2016 was collected from the World Health Organization (WHO) data base for 190 countries which comprises of 6 WHO regions. Similarly data on incidence and mortality rate of tuberculosis for the year 2016 was collected for the above countries from the WHO data base. The data were tabulated and statistical analysis was performed using Pearson’s correlation coefficient model to examine the association of annul mean concentration of particulate matter 2.5 with incidence and mortality rates of tuberculosis.
Results: Incidence and mortality rates of tuberculosis were found to be increasing with increasing levels of air pollution. It was correlated using scatter plot. Pearson’s correlation coefficient for air pollution level and incidence of tuberculosis was 0.331 (95% CI: 0.435-0.883), (p<0.001), and for tuberculosis mortality was 0.39 (95% CI: 0.525-0.906) (p<0.001).
Conclusions: The study suggests there is a significant positive relationship between ambient air pollution level and tuberculosis incidence and mortality rates.
Keywords: Particulate matter 2.5, Air pollutants, Koch’s disease, Tuberculosis
Department of Community Medicine, Sree Balaji Medical College and Hospital, Chennai, Tamil Nadu, India
Received: 20 August 2019
Revised: 05 September 2019
Accepted: 06 September 2019
*Correspondence:
Dr. Renuka K.,
E-mail: [email protected]
Copyright: © the author(s), publisher and licensee Medip Academy. This is an open-access article distributed under the terms of the Creative Commons Attribution Non-Commercial License, which permits unrestricted non-commercial use, distribution, and reproduction in any medium, provided the original work is properly cited.
As the world gets hotter and more crowded, our engines continue to pump out dirty emissions and half the world have no access to clean fuels and technologies the very air we breathe is growing dangerously polluted.
Air pollution is hard to escape no matter how rich an area you live in, it is all around us. Children are highly affected by air pollution because their lungs are still developing and the air pollution can interfere with this biological process, their bodies are less able to metabolize, detoxify and excrete the toxins contained in the air pollution. They inhale more air per unit of body weight than the adults and babies born to mothers who were exposed to air pollution during pregnancy are more likely to be premature and low birth weight babies. Exposure to air pollution is linked to respiratory diseases, cancer and cognitive impairments in infants, children and adolescents.2
Ambient air pollution has various detrimental effects on health which has a major impact globally in the morbidity and mortality pattern of the humans. Globally it is estimated that 9 out of 10 breathe polluted air and about 7 million deaths are attributed to air pollution.3 It is estimated that 91% of the world’s population lives in area where the World Health Organization (WHO) Air Quality Guidelines are not met.4 It is due to these facts that air pollution is regarded as one of the Global Public Health Threats in the year 2019 by WHO.5 Air pollution refers to substances in the air which are capable of causing ill effects to humans and the environment. Pollutants with strong evidence for public health concern are particulate matter (PM), ozone, nitrogen dioxide and sulphur dioxide. Of these the particulate matter 2.5 is very important because it is so tiny that it can pass through many of our body's protective armors such as mucous membrane and other barriers to damage our lungs, heart and brain.
Due to the increasing number of air pollution episodes and increased awareness about its health impact- PM 2.5 is measured and monitored by National Air Quality Monitoring Networks. WHO has been compiling annual mean concentration of particulate matter 2.5 and particulate matter 10 in cities across the world since 2011.6 The WHO Air Quality Guidelines offers guidance on threshold levels on key pollutants of air. The guidelines says that by reducing the concentration of particulate matter 10 from 70 to 20 µg/m3 we can reduce the air pollution related deaths by 15%.4
Based on the above background this study was carried out to determine the association of ambient air pollution levels (PM 2.5) with the incidence and mortality rates of tuberculosis in selected countries, in order to ascertain the gaps existing in the study area and to plan possible preventive measures.
METHODS
Study design
Retrospective data based ecological study on ambient air pollution levels (PM 2.5) and incidence and mortality rates of tuberculosis in 190 countries from the WHO data base.
Data source
Data on ambient air quality levels (annual mean concentration of PM 2.5 mcg/m3) for the year 2016 was collected from the WHO data base for 190 countries which comprises of 6 WHO regions. They are Africa, America, South East Asian, Europe, Western Pacific and Eastern Mediterranean region.
Similarly data on incidence and mortality rates of tuberculosis (2016) for the above said countries were collected from the WHO data base.
Statistical analysis
As the parameters (ambient air pollution level, tuberculosis incidence, tuberculosis mortality) were not distributed normally, logarithmic values of the parameters were taken. The Kolmogorov-Smirnov test was used to assess the normality of distribution of the investigated parameters. Now all parameters in our study were distributed normally. Pearson’s correlation coefficient (r) was used to analyze the association between ambient air pollution level and tuberculosis incidence and tuberculosis mortality. Pearson’s correlation coefficient (r) expresses the strength of linear relationship between two variables and it takes value from +1 to -1. The value of 0 indicates that there is no association between the two variables. A value greater than 0 indicates that there is a positive association and a value less than 0 indicate that there is a negative association. The relationship identified using correlation co-efficient are interpreted for what they are association and not causal relationship. The p value <0.05 were considered statistically significant. Statistical analysis was done using SPSS software version 16.0.
RESULTS
The results of the study on association between ambient air pollution level and pulmonary tuberculosis are presented below as tables, graphs and scatter plots.
25 µg/m3 of 24 hour mean. In general air quality levels are better in American and European regions.
Figure 1: Levels of annual mean concentration of PM 2.5 µg/m3, 2016.
Figure 2 shows the incidence rate of tuberculosis per 100000 populations for the WHO regions for the year 2016. It shows that the incidence rate is higher in African and South East Asian regions compared to other American and European region. The global average of incidence of tuberculosis for the year 2016 was found to be 134 per 100000 populations which were also higher as we are on the verge of end TB strategy.
Figure 2: Incidence of tuberculosis per 100,000 populations, WHO region, 2016.
Similarly, Figure 3 shows the mortality rate of tuberculosis per 100000 populations for the WHO regions for the year 2016. It showed that the mortality rate was higher in African and South East Asian regions compared to the developed regions of the world.
Figure 4 shows the scatter plot in which logarithmic values of annual mean concentration of particulate matter 2.5 is in the X axis and logarithmic values of incidence rate of tuberculosis is in the Y axis. As seen from the figure there is a positive linear relationship between the two variables. As the ambient air pollution level increases the incidence rate of tuberculosis in the countries are also increasing.
Figure 3: Mortality rate of tuberculosis per 100,000 populations, WHO region, 2016.
Figure 4: Scatter plot of ambient air pollution level and incidence of tuberculosis.
Figure 5: Scatter plot of ambient air pollution level and mortality rate of tuberculosis.
35.5
13.5 57.3
17.6 54
42.9 39.6
0 10 20 30 40 50 60 70
P
ar
ticu
lat
e
m
at
te
r
2.
5µ
g/m
3
WHO Region
245
27 230
32 114
96 134
0 50 100 150 200 250 300
In
cid
en
ce
o
f
tu
b
er
cu
lo
sis
WHO Region
41
1.9 34
3 14
5.1 18
0 5 10 15 20 25 30 35 40 45
M
or
tal
it
y
rat
e
of
T
u
b
er
cu
los
is
Similarly figure 5 shows the scatter plot in which logarithmic values of annual mean concentration of PM 2.5 is in the X axis and logarithmic values of mortality rate (per 100000 population) of tuberculosis is in the Y axis. As seen from the figure 5, there is a positive linear relationship between the two variables. As the ambient air pollution level increases the mortality rate of tuberculosis in the countries are also increasing.
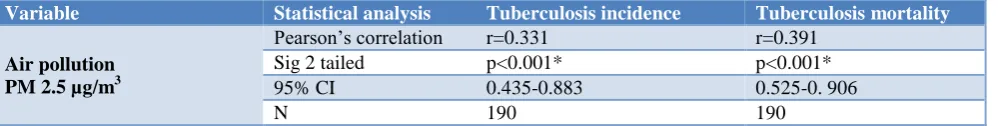
Table 1 shows the Pearson’s correlation coefficient of annual mean concentration of particulate matter 2.5 and the incidence and the mortality rates of tuberculosis. The Pearson’s correlation coefficient (r) for air pollution and Incidence of tuberculosis is 0.331 with a p value of <0.001 and 95% confidence interval (CI) of 0.435-0.883 which means that there is a strong association between the two variables.
Table 1: Pearson’s correlation coefficient of ambient air pollution and incidence and mortality rate of tuberculosis.
Variable Statistical analysis Tuberculosis incidence Tuberculosis mortality
Air pollution PM 2.5 µg/m3
Pearson’s correlation r=0.331 r=0.391
Sig 2 tailed p<0.001* p<0.001*
95% CI 0.435-0.883 0.525-0. 906
N 190 190
*p value (<0.05) statistically significant at 95% CI.
The Pearson’s correlation coefficient (r) for air pollution and mortality rate of tuberculosis is 0.391 with a p value of <0.001 and 95% confidence interval (CI) of 0.525-0.906 which means that there is a strong association between the two variables.
DISCUSSION
The current study suggests that the incidence and mortality rate of tuberculosis in different countries were found to increase as the level of air pollution increases. This is similar to the ecological study done in North Carolina by Smith et al, where they have found evidence suggestive for an association between pulmonary tuberculosis in North Carolina and two indices of air pollution PM 2.5 µg/m3 and PM 10 µg/m3, but this ecological study is restricted to a specific geographical area where both ambient air pollution levels and the incidence and mortality rate of tuberculosis is low.7 In this study we have included all 190 countries of the six WHO region hence we will have a better picture of the situation.
Similarly a cohort study done by Lai et al, revealed that there is a possible link between ambient air pollution and risk of active tuberculosis and a systematic literature review done by Popovic et al, revealed that there is a significant association between the particulate matter and tuberculosis outcomes.8,9 Similarly in a study conducted by Liu et al. It was found that there is a positive association between particulate matter 2.5, sulphur dioxide, ozone and carbon monoxide and the risk of newly developing pulmonary tuberculosis.10
Another ecological study done by Mutalip in Malaysia provided evidence on association between the particulate matter 10 and sulphur dioxide with pulmonary tuberculosis, but this study did not include particulate matter 2.5 which is important in the disease process.11
Limitations
We have used ecological study design to address our hypothesis. It is a retrospective study in which the data is collected from the WHO and the database compiles the ground measurements of annual mean concentration of PM of diameter 2.5 µg/m3. This approach is commonly used to generate hypothesis and to check the biological plausibility. Despite the biological plausibility of ambient air pollution and tuberculosis our results should be interpreted with caution as there are inherent limitations in this kind of study design. As the units of measurement in this study is population and not individuals we cannot apply the end result to the individuals as they are subjected to ecological fallacy. The fallacy of this study is each individual of the group should possess the average characteristic of that entire group, meaning all people residing in a specific country should be exposed to same level of air pollution but this cannot occur as there will be individual variations due to many factors like climate change, humidity, rainfall, exposure to indoor pollution or the people can migrate from one place to another.
There are various other pollutants in the air like sulphur dioxide, carbon monoxide etc., that can also have an effect on tuberculosis but we have considered only particulate matter 2.5 as there is unavailability of data for other factors. Furthermore the available data could not account for people migrating in and out of the country and varying air pollution exposures as a result.
CONCLUSION
epidemiological studies that takes in to account all major confounders
Thus preventing or reducing ambient air pollution levels is one way of reducing the incidence and mortality rates of tuberculosis. This can be achieved by adopting clean and sound energy efficient technologies in industries that could reduce the industrial emissions, proper management of urban and agricultural waste, by ensuring access to clean household energy solutions and shifting to clean modes of power generation.
Funding: No funding sources Conflict of interest: None declared
Ethical approval: The study was approved by the Institutional Ethics Committee
REFERENCES
1. Global tuberculosis report. World Health Organization, 2018. Available at: https://apps.who.int/iris/bitstream/handle/10665/274 453/9789241565646-eng.pdf. Accessed on 13 August 2019.
2. 10 things to know about air pollution. Available at: https://www.who.int/air-pollution/news-and-events/ how-air-pollution-is-destroying-our-health/10-things -to-know-about-air-pollution. Accessed on 15 August 2019.
3. 9 out of 10 people worldwide breathe polluted air, but more countries are taking action. Available at: https://www.who.int/news-room/detail/02-05-2018- 9-out-of-10-people-worldwide-breathe-polluted-air-but-more-countries-are-taking-action. Accessed on 13 August 2019.
4. Ambient (outdoor) air quality and health. Available at: https://www.who.int/news-room/fact-sheets/ detail/ambient-(outdoor)-air-quality-and-health. Accessed on 13 August 2019.
5. Ten threats to global health in 2019. Available at: https://www.who.int/emergencies/ten-threats-to-global-health-in-2019. Accessed on 13 August 2019.
6. Ambient air pollution: a global assessment of exposure and burden of disease. World Health Organization, 2016. Available at: https://www.who.int/phe/publications/air-pollution-global-assessment/en/. Accessed on 13 August 2019.
7. Smith G, Schoenbach VJ, Richardson DB, Gammon MD. Particulate air pollution and susceptibility to the development of pulmonary tuberculosis disease in North Carolina: an ecological study. Int J Environ Health Res. 2014 ;24(2):103-12.
8. Lai TC, Chiang CY, Wu CF, Yang SL, Liu DP, Chan CC, et al. Ambient air pollution and risk of tuberculosis: a cohort study. Occup Environ Med. 2016;73(1):56-61.
9. A systematic literature review and critical appraisal of epidemiological studies on outdoor air pollution and tuberculosis outcomes. Environ Res. 2019;170:33-45.
10. Liu Y, Cui L, Hou L, Yu C, Tao N, Liu J, et al. Ambient air pollution exposures and newly diagnosed pulmonary tuberculosis in jinan, china: a time series study. Sci Rep. 2018;8(1):1-11.
11. Mutalip MHA, Hiong TG, Sarnat SE, Hashim MH, Lodz NA, Pan S, et al. An ambient air pollution and pulmonary tuberculosis in Malaysia. Health. 2018;10(12):1634-49.
Cite this article as: Renuka K, Gopalakrishnan S, Umadevi R.Ambient air pollution and the