Synthesis and Characterization of Lithium Perchlorate Doped
PANI thin films
Ajay Chauhan*1, Rajeev Rathore 2, Rajbir Singh 3
*1Physics Department, Meerut College, Meerut, Uttar Pradesh., India
2Chemistry Department, Meerut College, Meerut, Uttar Pradesh, India
3Physics Department, Meerut College, Meerut, Uttar Pradesh, India
ABSTRACT
PANI (Polyaniline) is synthesized via chemical route based on chemical oxidative polymerization and thereafter in-situ doped with hydrochloric acid and different weight percentage of Lithium perchlorate. Thin films of Polyaniline and its different doped variant are deposited on plain soda glass and ITO conducting glass with chemical bath deposition technique. The obtained sample configurations are characterized by XRD for structural consistency, FTIR for chemical identification, DSC for thermal stability and electric measurements for capacitance and conductance are carried out with LCR and Four Probe arrangements respectively. XRD analysis reveals largely the polycrystalline nature of Polyaniline and its doped variant. FT-IR study of
Polyaniline is found to be in good agreement with standard pronounced peaks in the region of 2000-3500 cm-1,
a slight shifting in the doped Polyaniline is due to displaced hydrogen bonds. DSC reveals significant thermal
stability of doped and undoped Polyaniline below 200 0C. Dielectric measurements in the frequency range 50
Hz - 2 MHz with variable temperature yields the variation of capacitance, that confirms the interfacial
polarization in the PANI matrix. Lithium perchlorate doped PANI exhibits conductivity of 6.19 Sm-1
confirming the existence of bipolaron at higher level of oxidation.
Keywords: Polyaniline, Lithium perchlorate, FT-IR, Dielectric constant, Conductivity
I.
INTRODUCTIONConducting Polymers, in preceding four decades, have caught the fancy of researchers and scientists alike. Its to their novel properties suitable for diverse applications and relative ease of synthesis. Amongst the known conducting polymers, the Polyaniline (PANI) have gained significant attention [1] due to the fact that, unlike inorganic metals and semiconductors, both the synthesis and chemical modification of PANI offer unlimited possibilities [2]. There are numerous factors that affect the conductivity of PANI, such as the degree of oxidation of the polymer, the
fully reduced form, Emeraldine Base (EB) a partially oxidized form and (Per)nigraniline Base (PNB) a fully oxidized form, beside these the different oxidation states of PANI, the emeraldine salt (ES) is the only one that possesses electrical conductivity. The electrical conductivity of PANI salt is primarily affected by the nature of the doping [4]. A different variety of acids can be used to protonate PANI and enhances its conductivity [5,6]. In the doping process,
polarons and bipolarons are generated [7],
contributing to the conduction. The electrical conductivity is also influenced by several factors, such as the structure, the number charge carriers, their transport along and between the polymer chains and across the morphological barriers [8]. On treating PANI-EB with a protonic acid, such as HCl, protons are added to the unprotonated nitrogen sites (imine site) [9,10] and such systems been studied extensively. Its been long established that PANI configurations are suitable electrode material for Lithium (Li)-ion rechargeable cells [11] beside other applications e.g. anti-corrosive coating, electro-magnetic shielding etc. With progress in chemical synthesis, immergence of new dopants and solvents for soluble PANI system has made it a suitable electrode material owing to its environmental stability, higher conductivity and polymer electrolytes compatibility [12].
In presented work PANI is synthesized via chemic route, doped with Lithium perchlorate and its thin film configurations are physically characterized beside electrical measurements for dc conductivity and dielectric constant are carried out.
II.
METHODS AND MATERIALThe PANI base is synthesised via chemic route [13] filtered and dried. PANI thus obtained was dissolved in N-methyl pyrrolidinone (NMP) solvent at 3% wt. ratio with respect to the solvent. The soda glass and ITO glass slide are immersed in the solution (CBD arrangement) for 72 hours and PANI free-standing coating thus obtained are washed, cleaned and dried.
Doping solution of LiClO4 was made by dissolving it
in DMC (dimethyl carbonate, (CH3O)2CO, Mw = 90.08,
density = 1.07 g cm-3) by weight percentage ratio
1%, 2% and 5% respectively. PANI base free-standing films was immersed in the respective solution of Li salt for 48 hours. The doped films were dried in vacuum oven for 6 hours.
Films, thus fabricated were characterised by FT-IR, Bruker Alpha II for molecular analysis in the range of
400 - 4000 cm-1. For structural analysis, XRD was
performed using Cu Kα source and Ni filter on Bruker D8 Advance. Thermal stability was established with DSC on LINESIS L-6. Capacitance of the doped films of PANI was measured with LCR Aplab 4000E and a four-probe method was used to measure the dc conductivity [14].
III.
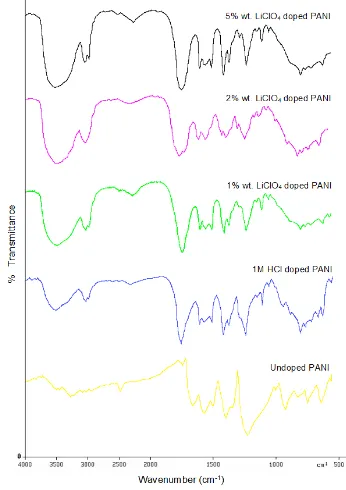
RESULTS AND DISCUSSIONA. FT-IR Spectroscopy
IR spectroscopy can distinguish different states of
PANI in the region of 1300 to 1600 cm-1 wavelength.
The prominent peaks signifying the PANI structure
pre and post doping with LiClO4 are obtained as in Fig.
1.
Figure 1: FT-IR spectrum of PANI Base and doped
The obtained FT-IR spectrum is found to be in good agreement with standard data available for PANI [15,16]. The characteristic absorption peaks are tabulated with respect to their attributes in PANI structure in Table 1.
Out of plane bending vibration of C-H bond of
p-substituted benzene ring appears at 697 and 563 cm–1.
The stretching vibrations of N–B–N and N=Q=N
structures appear at 1480 and 1404 cm–1 respectively,
(where –B– and =Q= stand for Benzenoid and Quinoid moieties in the polyaniline backbone). The peak
appeared at 1115 cm–1 corresponds to –N=Q–N+–B–
(or NH+–PANI) which is characteristic of the
protonated state. The absorption band at 1296 cm–1 is
associated with polaronic structure of PANI. Bands at
878 and 799 cm−1 correspond to PANI in the
para-disubstituted aromatic ring formation [17,18].
TABLE1
ASSIGNMENT OF FT-IR PEAKS FOR UNDOPED AND DOPED PANI IR Peak Assignment (stretching – str, bending – bnd, deformation – def, torsion – trn)
Characteristic absorption peaks (Wave number cm-1)
PA N I - EB 1M HCl do p ed P AN I 1% wt . Li C lO 4 D op ed PAN I 2% wt . Li C lO 4 do p ed P AN I 5% wt . Li C lO 4 D op ed PAN I
N-H str. 3756 3424 3419 3439 3430
C-H / NH2+
str. 3145 2927 2933 2933 2936
C=N+ str. 2365 2164 2148 2149 2140
C=C ‘Q’
str. 1654 1660 1657 1664 1661
N=Q=N
str. 1571 1505 1507 1506 1507
N=B=N
‘B’ str. 1480 1471 1460 1460 1462
C-N str. 1404 1407 1408 1407 1408
C-N-C
bnd. 1296 1302 1304 1303 1304
C-H bnd. 1115 1118 1115 1114 1115
C-C def. 878 986 986 986 986
C-N-C trn. 657 658 659 659 659
The bands corresponding to stretching mode of C-N
bond appear at 1296 cm−1 respectively. The FT-IR
spectra of doped PANI shows a little deviation from the undoped PANI spectra.
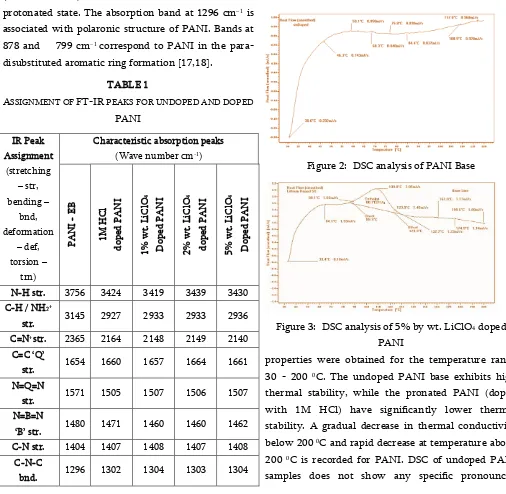
B. Differential Scanning Calorimetry (DSC)
The thermal analysis based on Differential calorimetry revels the behaviour of PANI and its doped variants upon heating and is given in Fig. 2 & 3. The thermal
Figure 2: DSC analysis of PANI Base
Figure 3: DSC analysis of 5% by wt. LiClO4 doped
PANI
properties were obtained for the temperature range
30 - 200 0C. The undoped PANI base exhibits high
thermal stability, while the pronated PANI (doped with 1M HCl) have significantly lower thermal stability. A gradual decrease in thermal conductivity
below 200 0C and rapid decrease at temperature above
200 0C is recorded for PANI. DSC of undoped PANI
thermal transitions below 200 0C, suggesting robust
thermal stability with little weight loss except for expected dehydrations of samples. Very similar
observations are made for HCl and LiClO4 doped
samples of PANI, thus indicating their suitability for most practical applications in batteries and other electronic devices.
C. X-Ray Diffraction (XRD)
XRD pattern of PANI base shows to an extant the amorphous nature, while XRD patterns of doped samples of PANI show slight semi-crystalline nature Fig.4. The semi-crystalline nature of polymers arises
10 20 30 40 50 60 70
2
Undoped PANI 1M HCl doped PANI 1% wt. LiClO4 doped PANI
2% wt. LiClO4 doped PANI 5% wt. LiClO4 doped PANI
Figure 4: XRD of PANI Base and doped PANI with
different wt. % of LiClO4 salt thin films.
owing to the systematic alignment of polymer chain folding or by the formation of single or multiple helices, for part of their length [19]. XRD pattern of undoped PANI sample shows an amorphous hump or diffused peaks around 20 to 25 degrees and the doped samples have slight peaking shifted towards higher angles. There is slight variation in diffraction intensity with dopant ratio exhibiting the interaction
of dopant with PANI network and thus indicating
semi-crystalline nature becoming increasingly
prominent, though not sufficiently to be classified as crystalline as sharp peaks are absent throughout the XRD scan.
D. Dielectric Measurements
The dielectric constant (έ) determined from the measured capacitance with LCR meter PDI controlled at room temperature and plotted for the frequency range 50 Hz – 2 MHz as given in Fig. 5. Maximum value for
Figure 5: Dielectric Constants of PANI Base and
doped PANI with different wt. % of LiClO4 thin films
at 30 0C temperature
PANI Base
1%, 2%, 5% by wt. lithium perchlorate doped PANI. With
increasing LiClO4 weightpercentage there is decrease
TABLE2
DIELECTRIC CONSTANT OF PANI AND DOPED PANI AT 300C AND 600HZ
Sandwiched thin film material
Highest Dielectric Constant at 600 Hz
and 30 0C (x10-6)
PANI Base 106
1M HCl doped PANI 2.24
1% wt. LiClO4 doped
PANI
3.57
2% wt. LiClO4 doped
PANI
2.86
5% wt. LiClO4 doped
PANI
1.42
E. Electrical conductivity
The resistivity and conductivity of the PANI and doped PANI film was measured with a collinear Four-probe array. The volume resistivity ρ (Ω-cm) is defined as the ratio of the potential gradient parallel to the current in the material to the current density. The schematic arrangement of electrical circuit for the Four probe resistivity measurement is shown in fig. 5.
Figure 5: Schematic arrangement for the measurement of Electrical Resistivity of PANI Base and doped thin
films.
The variation in conductivity of PANI and doped PANI was observed. Conductivity PANI base film
sample was found to be 6.98 x 10⁻⁴ Sm-1, while for HCl
doped film samples it increased to a value of 0.106 Sm
-1 and 6.19 Sm-1 for 5% by weight lithium
perchlorate doped samples. The resistivity and conductivity measured for PANI base and doped
PANI thin film samples at room temperature is given in the Table 3.
TABLE3
RESISTIVITY AND CONDUCTIVITY OF PANI AND DOPED PANI AT (~300C) ROOM TEMPERATURE
Thin film samples Resistivity
ρ (Ωm)
Conductivity
σ (Sm-1)
PANI base 1.43E+03 6.98E-04
1M HCl doped PANI 9.45E+00 1.06E-01
1% wt. LiClO4 doped
PANI 3.10E-01 3.27E+00
2% wt. LiClO4 doped
PANI 2.70E-01 3.64E+00
5% wt. LiClO4 doped
PANI 1.60E-01 6.19E+00
Electrical conductivity of doped PANI is associated with the mobile p-electrons excited from the valence band with highest occupied molecular orbital (HOMO) to the conduction band with lowest unoccupied molecular orbital (LUMO) state and also to the charge hopping among the polymer chains. In PANI, the conduction mechanism as observed in the above setup, can be explained with the formation of polaron and bipolaron in the polymer structure [21]. Polarons are associated with lower level of oxidation, while the higher level of oxidation yields bipolaron. Polarons and bipolarons are equally mobile and transverse through the polymer chain via rearrangement of double and single bonds in the conjugated system. Conduction by polarons and bipolarons was supposed to be the dominant factors which determine the mechanism of charge transport in polymer with non-degenerate ground states.
IV.
CONCLUSIONdifferent weight percent of Lithium perchlorate solution was carried out and films formed were subjected to various characterisations. FT-IR spectra reveals standard peaks of PANI and slight shifting of peaks in doped films towards higher wavenumber, as the quinoid stretching diminishes on doping. XRD analysis reveals semi-crystalline nature of PANI and its doped variant. Dielectric study suggest PANI can hold substantial charge and have high capacitance. DSC analysis establish significant thermal stability of PANI and its Lithium doped films at normal temperatures. Resistivity drops significantly on doping with Lithium perchlorate making it a suitable configuration for electronic devices including batteries. These results encourage to venture into device fabrication with Lithium salt doped PANI for practical applications.
V.
REFERENCES[1] V.J. Babu, S. Vempati and S. Ramakrishna, (2013), Materials Sciences and Applications, Vol.4 No.1, pp 1-10 DOI:10.4236/msa.2013.41001
[2] R.K. Devi and G.Mathubala, (2015), International Journal of Innovative Research in Science, Engineering and Technology, Vol. 4, Issue 3, DOI: 10.15680/IJIRSET.2015.0403153 1432
[3] P.K. Kahol, J.C.Ho, Y.Y.Chen, C.R.Wang, S.Neeleshwar, C.B.Tsai and B.Wessling, (2005), Synthetic Metals, Volume 151, Issue 1, pp 65-72, DOI: 10.1016/j.synthmet.2005.03.017
[4] N. Çolak and B. Sökmen, (2012), Designed Monomers and Polymers, Volume 3, Issue 2, pp 181-189, DOI: 10.1163/156855500300142870
[5] V.M Mzendaa, S.A Goodmana, F.D Aureta and L.C. Prinsloob, (2002) Synthetic Metals, Volume 127, Issues 1–3, pp 279-283, DOI: 10.1016/S0379-6779(01)00636-1
[6] A. Kumar, V. Ali, S. Kumar and M. Husain, (2011), International Journal of Polymer Analysis and Characterization, Volume 16, Issue 5, pp 298-306, DOI: 10.1080/1023666X.2011.587945
[7] S. Capaccioli, M Lucchesi, P. A. Rolla and G Ruggeri, (1998), Journal of Physics: Condensed Matter, 10, pp 5595, DOI: 10.1088/0953-8984/10/25/011
[8] D. S. Maddison and T. L. Tansley, (1992), Journal of Applied Physics, 72, pp 4677, DOI: 10.1063/1.352073 [9] J.C. Chiang, A. G. MacDiarmid, (1986), Synthetic
Metals, Volume 13, Issues 1–3, pp 193-205, DOI: 10.1016/0379-6779(86)90070-6
[10] A.J. Epstein, J.M.Ginder, F.Zuo, R.W.Bigelow H.-SWoo, D.B.Tanner, A.F.Richter, W.-Shuang, A.G. MacDiarmid, (1987) Synthetic Metals, Volume 18, Issues 1–3, pp 303-309, DOI: 10.1016/0379-6779(87)90896-4
[11] J. H. Burroughes, D.D.C. Bradley, A.R. Brown, R.N. Marks, K. Mackay, R.H. Friend, P.L. Burns and A.B. Holmes, (1990), Nature, volume 347, pp 539–541, DOI:10.1038/347539a0
[12] A.G. MacDiarmid and A.J. Epstein, (1989), Faraday Discussions of the Chemical Society, Volume 88, pp 317-332, DOI:10.1039/DC9898800317
[13] J. Stejskal and R.G. Gilbert, (2002), Pure and Applied Chemistry, Volume 74, No. 5, pp. 857-867, DOI: 10.1351/pac200274050857
[14] N. Chandrakanthi and M.A. Careem, (2000), Polymer Bulletin, Volume 44, Issue 1, pp 101–108, DOI: 10.1007/s002890050579
[15] G.B. Shumaila, V.S. Lakshmi, M. Alam, A.M. Siddiqui, M. Zulfequar and M. Husain, (2010), Current Applied Physics, Volume 11, No. 2,pp. 217-222, DOI: 10.1016/j.cap.2010.07.010
[16] K. Gupta, P.C. Jana and A.K. Meikap, (2010), Synthetic Metals, Volume 160, No. 13-14, pp. 1566-1573, DOI: 10.1016/j.synthmet.2010.05.026
[17] J. Fink and G. Leising, (1986), Physical Review B, 34, pp 5320, DOI: 10.1103/PhysRevB.34.5320
[18] J.Jooa, H.G.Songb, C.K.Jeongb, J.S.Baeckb, J.K.Leeb, and K.S.Ryuc, (1999) Synthetic Metals, Volume 98, Issue 3, P 215-220, DOI: 10.1016/S0379-6779(98)00193-3
[19] S. Bhadra and D. Khastgir (2008), Polymer Test 27(7),
pp 851-857, DOI:
101016/j.polymertesting.2008.07.002
[20] A. Choudhury, (2009), Sensors and Actuators B: Chemical, Volume 138, Issue 1, pp 318-325, DOI: 10.1016/j.snb.2009.01.019
[21] A. AliKhan and U. Baig, (2013), Solid State Sciences,
Volume 15, pp 47-52, DOI: