Original Research Article
The study of blood pressure profile among school going
adolescents in urban Agra
Akash K. Singh, Sunil K. Misra, Shailendra S. Chaudhary, Geetu Singh
INTRODUCTION
Cardiovascular diseases (CVD) have been declared as „the world‟s number one killer‟ by World health organization in their global heart initiative report 2016.1 Globally it accounts for approximately 17 million deaths a year, nearly one third of the total reported deaths world wide.2 Of these, complications of hypertension account for more than half of the deaths (9.4 million) worldwide every year.3 Hypertension is now a common disease
associated with high morbidity and mortality and is recently described as a "silent killer" by World Health Organization. About one billion of adult world population was hypertensive in the year 2000 and this is expected to increase to two billion by 2025.4
Hypertension once considered a problem of adults only in the high income countries, now dramatically is on the rise in low and middle income countries.5 Childhood hypertension is an established predictor of adult hypertension and organ damage, and it is underestimated
ABSTRACT
Background: Hypertension once considered a problem of adults only in the high income countries, now dramatically is on the rise in low and middle income countries. An established predictor of adult hypertension and organ damage is childhood hypertension. Thus for the control, effective treatment and prevention of its complications, early diagnosis of hypertension in adolescents in an important strategy. The objective was to study the blood pressure profile and its socio-demographic determinants among school going adolescents in urban Agra.
Methods: A cross-sectional survey was done among 534 adolescent in age group of 13-18 years studying in various government and private schools in urban Agra. Socio demographic details, anthropometric measurements and family history of hypertension were obtained. Also the dietary habits, physical activity, mode of transport to school were included in the present study. Blood pressure was measured at 0 and 30 minutes and average of two readings was taken as the final reading of that individual.
Results: It was found that 49.82% of the study subjects had above normal blood pressure and among them 21.16% were hypertensive and 28.66% had pre-hypertension. Higher blood pressure showed a statistically significant (p<0.05) association with gender, age, dietary habits, physical activity, body mass index, and parental history of hypertension.
Conclusions: Hypertension among the adolescent age group was very high. Prevalence of high blood pressure significantly associated with age, gender, family history of hypertension, physical activity, type of school and dietary habits.
Keywords: Prevalence, Hypertension, School, Adolescents
Department ofCommunity Medicine, S.N. Medical College, Agra, Uttar Pradesh, India
Received: 30 March 2019
Revised: 22 May 2019
Accepted: 29 May 2019
*Correspondence:
Dr. Shailendra S. Chaudhary, E-mail: [email protected]
Copyright: © the author(s), publisher and licensee Medip Academy. This is an open-access article distributed under the terms of the Creative Commons Attribution Non-Commercial License, which permits unrestricted non-commercial use, distribution, and reproduction in any medium, provided the original work is properly cited.
problem in developing countries like India.6 An increasing number of healthy children and adolescents across the world are being diagnosed with HTN.6
Early diagnosis of hypertension is an important strategy in its control, effective treatment and prevention of complications. Thus this study was planned with the objective to find the blood pressure profile and its biosocial correlates among school going adolescents of urban Agra.
METHODS
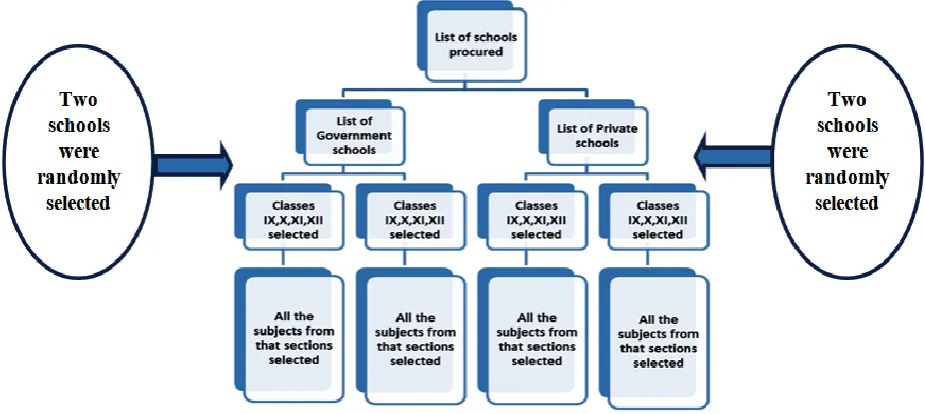
The present community based cross sectional study was planned in urban schools of Agra city. A list of schools was obtained from the government website, then a separate list of Government and Private schools was made to ensure participation of both type of schools.7 The schools were randomly selected and children of the selected school fulfilling the inclusion criteria were included in the present study. Attempts were made to ensure proportionate participation of both male and female subjects (Figure 1).
The purpose and procedure of the study was discussed in detail with the Principal of the selected school and permission was obtained. Students from 9th to 12th class were included in the study.
Inclusion criteria
Inclusion criteria were all students from 9th to 12th class in the school; students who gave consent for the study conducted on them.
Exclusion criteria
Exclusion criteria were students not consenting; students absent on the day to examination; parents not consenting.
Study was done from during April 2018 to October 2018.
Sample size calculation
For this, the study by Saaduddin has been used as reference.8 The study revealed that the cumulative prevalence of hypertension and pre-hypertension in school children in Central India (Aurangabad) was found to be 19.4. Thus Sample size calculated was 426. Adding a figure of 20% for incomplete/incorrectly filled forms the total number came out to be 511.
As all the students from each selected section were taken the final sample size came out to be 534.
Sampling technique
Stratified random sampling was used in the present study.
Figure 1: Flow chart depicting sample selection process.
Blood pressure measurement was measurements were
recorded according to recommended guidelines.9 For each subject, two recordings were taken at an interval of 30 min and the average of two readings was taken as the final reading. Adolescents with average systolic blood pressure (SBP) or diastolic blood pressure (DBP) levels greater than or equal to 90 percentile, but less than the 95 percentile, were classified as pre-hypertensive. The
The semi-structured, self administered questionnaire included details such as personal details (age, sex, Standard of study, school type), family details (Type of family, family history of hypertension among parent), mode of transport of school, sedentary life style questions and physical activities questionnaire (International physical activity questionnaire, IPAQ).10
Dietary pattern questions included frequency of meals, breakfast, intake of vegetables, fruits, sugary drinks and junk food (according to GSHS criteria 2013).11
Adding extra salt to food and eating while watching television or studying were also included in the study. Anthropometric measurements such as height and weight were also recorded.
Body mass index also called as the quetelet‟s index is the ratio of weight (kg)/height (m2). For subjects of adolescent age group, the percentiles of BMI were calculated to assess the prevalence of overweight (≥85th
percentile but <95th percentile) and obesity (≥97th percentile) in the study population (WHO).12
Statistical analysis was done using Epi info software. The results were reported as a proportion with 95% confidence interval. Appropriate statistical tests were applied. The p value less than 0.05 was considered statistically significant.
RESULTS
A total 534 school children (13-18 years) from four different schools, two each from Government and private sector were included in this study.
The age of the study subjects varied from 13 to 18 years. Maximum study subjects (42%) belonged to 15 to 16 years of age group followed by 13 to 14 years (36%) and 17 to 18 years of age group (22%). 300 (56.2%) subjects were male and 234 (43.8%) were female. 53.9% subjects studies in government school and 46.1% subjects studied in private school (Table 1).
Blood pressure distribution among school students shows that half of the subjects (50.18%) had normal blood pressure. While 28.65% of the subjects were pre-hypertensive and 21.6% were pre-hypertensive (Table 2).
Table 1: General profile of study subjects.
Variables Category Total
N (%)
Normal N (%)
Prehypertension N (%)
Hypertension
N (%) P value
Age group (in years)
13 to 14 194 (36.3) 91 (46.9) 55 (28.4) 48 (24.7) χ2
=29.99 d.f. 4 p<0.001
15 to 16 224 (41.9) 138 (61.6) 58 (25.9) 28 (12.5)
17 to 18 116 (21.7) 39 (33.6) 40 (34.5) 37 (31.9)
Sex Male 300 (56.2) 119 (39.7) 111 (37.0) 70 (23.3) χ
2
=33.27 d.f. 2 p<0.001
Female 234 (43.8) 149 (63.7) 42 (17.9) 43 (18.4)
Class
IX 202 (37.8) 101 (50.0) 62 (30.7) 39 (19.3)
χ2=44.44 d.f. 6 p=0.001
X 168 (31.5) 89 (53.0) 42 (25.0) 37 (22.0)
XI 58 (10.9) 46 (79.3) 12 (20.7) 0 (0.0)
XII 106 (19.9) 32 (30.2) 37 (34.9) 37 (34.9)
School type Private 246 (46.1) 56 (22.8) 106 (43.1) 84 (34.1) χ2=137.8
d.f. 2 p=0.001
Government 288 (53.9) 212 (73.6) 47 (16.3) 29 (10.1)
Socio-economic class
Upper 16 1 (6.3) 5 (31.3) 10 (62.5)
χ2=123.39 d.f. 6 p=0.003
Upper middle 244 69 (28.3) 100 (41.00) 75 (30.7)
Lower middle 82 64 (78.0) 8 (9.8) 10 (12.2)
Lower 192 134 (69.8) 40 (20.8) 18 (9.4)
Total 534 268 (50.18) 153 (28.66) 113 (21.16)
Table 2: Distribution of blood pressure among study subjects according to their dietary habits.
Variable Category No. Normal
N (%)
Pre-hypertension N (%)
Hypertension
N (%) P value
Meals Per day
3 or more meals per day 280 103 (36.8) 101 (36.1) 76 (27.1) χ2=42.33 d.f.
2 p=0.000
less than 3 meals per day 254 165 (65) 52 (20.5%) 37 (14.6)
Breakfast Daily
Yes 324 162 (50.0) 91 (28.1) 71 (21.9) χ2=0.318 d.f.
2 p=0.853
No 210 106 (50.5) 62 (29.5) 42 (20.0)
Fruits intake per week
Less than 3 days per week 427 203 (47.5) 129 (30.2) 95 (22.2) χ2=5.972 d.f.
2 p=0.04
3 or more days per week 107 65 (60.7) 24 (22.4) 18 (16.8)
Vegetables intake per week
Less than 3 days per week 355 149 (42.0) 127 (35.8) 79 (22.3) χ2=33.593
d.f. 2 p=0.000
3 or more days per week 179 119 (66.5) 26 (14.5) 34 (19.0)
Variable Category No. Normal N (%)
Pre-hypertension N (%)
Hypertension
N (%) P value
Sugary drinks intake per week
Less than 3 days per week 474 251 (53.0) 125 (26.4) 98 (20.7) χ2=14.56 d.f.
2 p=0.001
3 or more days per week 60 17 (28.3) 28 (46.7) 15 (25.0)
Junk food intake per week
Less than 3 days per week 416 232 (55.8) 110 (26.4) 74 (17.8) χ2=25.014
d.f. 2 p=0.000
3 or more days per week 118 36 (30.5) 43 (36.4) 39 (33.1)
Total 534 268
(50.18) 153 (28.66) 113 (21.16)
Table 3: Association between blood pressure with physical activity
Variable Category No. Normal
N (%)
Pre-hypertension N (%)
Hypertension
N (%) P value
Physical activity
Low 127 61 (48.0) 43 (33.9) 23 (18.1)
χ2
=12.25 d.f. 4 p=0.016
Moderately 158 65 (41.1) 51 (32.3) 42 (26.6)
Highly 249 142 (57.0) 59 (23.7) 48 (19.3)
Eating while studying/ watching T.V.
Yes 335 142 (42.4) 113 (33.7) 80 (23.9) χ2=22.133
d.f. 2 p=0.000
No 199 126 (63.3) 40 (20.1) 33 (16.6)
Mode of transport to school
Manual 332 218 (65.7) 69 (20.8) 45 (13.6) χ2=84.846
d.f. 2 p=0.002
Automobile 202 50 (24.8) 84 (41.6) 68 (33.7)
Total 534 268
(50.18) 153 (28.66) 113 (21.16)
Table 4: Basal Metabolic Index (B.M.I.) and blood pressure distribution among the study subjects.
Variable Category Number
N (%)
Normal N (%)
Pre-hypertension N (%)
Hypertension
N (%) P value
<5th Percentile Underweight 76 (14.2) 59 (77.6) 17 (22.4) 0 (0.0)
χ2=84.67 d.f. 4 p=0.000
5th to <85th
Percentile Normal 334 (62.5) 181 (54.2) 93 (27.8) 60 (18.0)
≥85th
Percentile Overweight/
Obese 124 (23.3) 28 (22.6) 43 (34.7) 53 (42.7)
Table 5: Association between sex, socio-economic class and B.M.I. with blood pressure among study subjects.
Variable Odds ratio C.I. (lower) C.I. (upper) P value
Sex (males v/s females) 2.666 1.874 3.794 0.000
SES* (Class IV-V v/s Class I-III) 7.071 4.832 10.349 0.001
BMI (≥85th Percentile v/s <85th Percentile) 4.840 3.042 7.702 0.001
Type of school (Private v/s Private school) 9.464 6.364 14.074 0.001
Fruits less than 3 days per week 1.708 1.109 2.630 0.015
Eating extra salt with meals 1.766 1.189 2.624 0.005
Vegetables less than 3 days per week 2.742 1.884 3.990 0.000
Sugary drink three or more days per week 2.847 1.579 5.135 0.000
Junk food three or more days per week 2.872 1.855 4.446 0.000
Three or more meals per day 3.186 2.236 4.540 0.000
Saturated oil used for cooking at home 3.499 2.312 5.293 0.000
Father having hypertension (Yes vs No) 3.211 1.703 6.056 0.000
Mother having hypertension (Yes vs No) 2.559 1.199 5.462 0.012
The hypertension was significantly associated with age (p<0.001), male sex (p<0.001), class of study (p<0.001), studying in private school (p<0.001) (Table 1, 2).
Maximum number of the study subjects belong to Upper Middle class (45.69%) and Upper lower class (35.95%). While very few study subjects belonged to upper (2.9%) and lower (0.4%) socio economic class. This was found to be statistically significant (p<0.001) (Table 1).
Hypertension was more prevalent among the subjects taking three or more meals per day (27.1%), taking fruits for less than three days per week (22.2%) and taking vegetables for less than three days per week (22.3%). Prevalence of hypertension was more seen with the subjects taking sugary drinks more than three days per week (20.7%) and taking extra salt with meals (26.5%) and taking junk food for three or more days per week (33.1%). The hypertension showed a significant association with the above mentioned dietary habits. Insignificant association of blood pressure was seen with frequency of eating breakfast. (Table 2)
In the present study prevalence of hypertension increased significantly with decrease in physical activity (p<0.05). Eating while watching T.V. or studying (p<0.001) and going to school via automobile (p<0.05) was significantly associated with increased prevalence of hypertension, 23.9% and 33.7% respectively (Table 3).
Majority of the subjects (62.5%) were having normal B.M.I. (WHO criteria for B.M.I. for gender, age and height for adolescents).12 It was found that more than one fifth (23.3%) of the subjects were either overweight (16.9%) or obese (6.4%) (Table 4).
There were significantly higher odds of having hypertension (p<0.05) among subjects studying in private
school (OR=9.464), higher socioeconomic status
(OR=7.071), high B.M.I. (OR=4.840), eating three or meals per day (OR=3.186), eating vegetables for less than three days per week (OR=2.742), drinking sugary beverages more than three days per week (OR=2.847), eating junk food for three or more days per week (OR=2.872), male subjects (OR=2.666), taking extra salt with meals or fruits (OR=1.766), consumption of fruits less than three days per week (OR=1.708) and less physically active (OR=1.675) (Table 5).
DISCUSSION
In the present study the blood pressure profile of the school going adolescents of urban Agra was observed. The overall prevalence of hypertension was found to be 21.2%. Similar prevalence of hypertension was reported in studies conducted by Sharma et al, Sundar et al and Das et al (20.0%, 21.5% and 19.7% respectively).13-15 The prevalence of pre-hypertension was found to be 28.65%. Similarly Nagar et al reported 30.2% prevalence
of pre-hypertension among School Going Adolescents in Surendranagar City, Gujrat.16 Higher prevalence of pre-hypertension has been reported by Kini et al from Mangalore and by Banker Chirag et al from Ahmedabad (i.e. 42.6% and 100.0% respectively).17,18
In coherence with the present study Sabapathy et al did not find any linear relation of blood pressure with age of the study subjects.19
In the studies conducted by Sundar et al and Katta et al male subjects had significantly higher blood pressure as compared to female subjects and this goes along with the present study.14,20 Subjects studying in private school had significantly higher prevalence of hypertension and as compared to those studying in government schools and similar observations were reported by Nagar et al and Sabapathy et al.16,19
Similar findings were reported by Satyanarayana et al and Kaur et al where the blood pressure was found to increase with rising socio-economic status as in the present study.21,22
Similar to the findings of the present study, Katta et al and Satyanarayana et al also reported that elevated blood pressure was significantly higher among subjects with positive family history of hypertension.20,21
The present study reported significant association of hypertension with increased frequency of meals per day, less intake of fruits and vegetables, more intake of sugary drinks and intake of extra salt with meals and consumption of junk food. Similar findings were observed in the studies done by Satyanarayana et al and Prasad et al.21,23
Similarly studies done by Kini et al, Prasad et al, Naha et al and Hu et al found that higher prevalence of hypertension was associated with decreased physical activity.17,23-25
In the present study subjects who ate while watching television or studying were found to have significantly higher blood pressure as also reported in study conducted by Prasad et al, Naha et al and Hu etal.23-25
Hypertension was significantly associated with higher B.M.I. Similarly cross sectional studies done by Prasad et al and Shaziya et al among adolescent school children reported a highly significant (p<0.001) correlation between BMI and hypertension.23,26
Limitations of the study
The confounding variables whether known or not known
are inevitable in any analytical study. The
memory, which can be subject to recall bias. Similarly physical activity was recorded as told by the children, no observation was done.
CONCLUSION
In the present study statistically significant association is observed between prevalence of high blood pressure with age, gender, academic standard and type of school. Prevalence of higher blood pressure was found to be significantly high among subjects belonging to higher socio-economic class, taking less vegetables and fruits and more number of meals per day, sugary drinks, junk fast food and extra salt in their diet. Other risk factors significantly related directly or indirectly to high blood pressure are physical inactivity, eating while watching T.V. or studying, mode of transport to school, family history of hypertension and high BMI of the study subjects. Findings of this study recommend on creating awareness among school students particularly in adolescent age group regarding hypertension and its complications and educate them about the modifiable risk factors of hypertension and how to lower risk of developing high blood pressure. Their parents should also be educated about increasing prevalence of adolescent hypertension and how to prevent it. School authorities should organize screening programs in school particularly for hypertension.
ACKNOWLEDGEMENTS
Authors are thankful to thank the principal of each school included in this study for giving permission to conduct this study. We also thank the adolescent students for their patients and support who took part in this study.
Funding: No funding sources Conflict of interest: None declared
Ethical approval: The study was approved by the Institutional Ethics Committee
REFERENCES
1. WHO. Global hearts initiative. Available at:
https://www.who.int/cardiovascular_diseases/global -hearts/Global_hearts_initiative/en/. Accessed on 24 August 2018.
2. WHO. Global Burden of Disease. Available at: http ://www.who.int/healthinfo/global_burden_disea se/cod_2008_sources_methods.pdf. Accessed on 24 June 2018.
3. Lim SS, Vos T, Flaxman AD, Danaei G, Shibuya K,
Adair-Rohani H, et al. A comparative risk assessment of burden of disease and injury attributable to 67 risk factors and risk factor clusters in 21 regions, 1990-2010 : A systematic analysis for the Global Burden of Disease Study 2010. Lancet. 2012;380(9859):2224-60.
4. WHO Global brief on Hypertension 2013. Available
at: https://www.who.int/cardiovascular_diseases/
publications/global_brief_hypertension/en/. Accessed on 24 August 2018.
5. Sherlock PL, Beard J, Minicuci N, Ebrahim S, Chatterji S. Hypertension among older adults in low- and middle-income countries: prevalence,
awareness and control. Int J Epidemiol.
2014;43(1):116-28.
6. Matto TK. Hypertension in pediatric patients. Indian Pediatr J. 2010;47:473-4.
7. Agra District government website. Available at: https://agra.nic.in/education/ Accessed on 3 January 2018.
8. Saaduddin M. Study of the Prevalence and Trends of Hypertension Among School Children in Aurangabad City MS, India. IJCMAS. 2015;8(1):1. 9. The Fourth Report on the Diagnosis, Evaluation,
and Treatment of High Blood Pressure in Children and Adolescents. Pediatrics. 2004;114(2):555-76. 10. Craig CL, Marshall AL, Sjöström M, Bauman AE,
Booth ML, Ainsworth BE, et al International
Physical Activity Questionnaire: 12-Country
Reliability and Validity. Med Sci Sports Exerc. 2003;35(8):1381-95.
11. School based student health survey (GSHS) 2013 core questionnaire modules. Updated 01 January 2013. Available at: www.who.int/chp/gshs/india/en Accessed on 24 June 2018.
12. World Health Organization (2007). Growth
reference data for 5-19 years. Available at: http://www.who.int/growthref/en/. Accessed on 23 June 2018.
13. Sharma A, Grover N, Kaushik S, Bhardwaj R, Sankhyan N. Prevalence of hypertension among school children in Shimla. Indian Pediatr. 2010;47:873-6.
14. Sundar JS, Adaikalam JMS, Parameswari S,
Valarmarthi S, Kalpana S, et al. Prevalence and Determinants of Hypertension among Urban School Children in the Age Group of 13- 17 Years in, Chennai, Tamil Nadu. Epidemiol. 2013;3:130.
15. Das MK, Bhatia V, Sibal A. Prevalence of
Hypertension in urban school children aged 5to10 years in North India. Int J Contemp Pediatr. 2017;4:2055-9.
16. Nagar S, Thomas E, Mahyavanshi D, Patel H, Nagar
N, Nagar SS. A Study on Hypertension and Prehypertensive Status and Their Key Determinants among School Going Adolescents in Surendranagar City. Healthline J. 2017;8(2):47-53.
17. Kini S, Ramaswamy P, Jaison M, Raj R, Ranjitha RK, Kundapur R, et al. Association of obesity with physical activity, television viewing, video computer gaming among school children in Mangalore. Indian J Comm Health. 2015;27.
18. Chirag AC, Chavda J, Khyati M, Kakkad, Damor P.
A Study of Prevalence of Hypertension in School Children. Guj Med J. 2013;68.
19. Sabapathy S, Nagaraju BA, Bhanuprakash CN
rural district: a cross sectional study. Int J Contemp Pediatr. 2017;4(5):1701-4.
20. Katta A.V, Kokiwar PR. A cross-sectional study on correlates of high blood pressure among school-going children in an Urban Area. Indian J Community Med. 2018;43:82-5.
21. Satyanarayana K, Kandhi P, Pereira KR. Study of prevalence and determinants of hypertension among the urban school going children aged 10–15 years. Ann Trop Med Public Health. 2016;9:421-4.
22. Kaur S, Sachdev H, Dwivedi SN, Lakshmi R, Kapil
U, Sareen N. Association of Obesity with Hypertension Amongst School Age Children Belonging to Lower income group and middle income group in national capital territory of Delhi. Indian J Community Med. 2013;38:175-9.
23. Prasad S, Masood J, Srivastava AK, Mishra P. Elevated blood pressure and its associated risk factors among adolescents of North Indian City A cross sectional study. Indian J Community Med. 2017;42:155-8.
24. Naha NK, John M, Cherian VJ. Prevalence of hypertension and risk factors among school children in Kerala, India. Int J Contemp Pediatr. 2016;3:931-8.
25. Hu G, Qiao Q, Tuomilehto J, Balkau B, Borch-Johnsen K, Pyorala K. prevalence of the metabolic syndrome and its relation to all-cause and cardiovascular mortality in nondiabetic European
men and women. Arch Intern Med.
2004;164(10):1066-76.
26. Shaziya S, Soumya M. A study on prevalance of pre-hypertension in relation to various obesity indicators in tenth standard healthy school children aged 14 to 16 years. Int J Contemp Pediatr. 2016;3:35-40.