Original Research Article
The association between pulmonary function test and anthropometric
measurements using bioelectric impidence analysis in adolescents
Rahul R. Surve*, Rajesh K. Dase
INTRODUCTION
The pulmonary function tests are considered as an essential part for evaluation of lung functions. PFTs are influenced by various factors like anthropometric, geographic, genetic, socioeconomic and life style.1 The development of pulmonary functions and growth of physical parameters i.e. height and weight are coexistent. These physical parameters are further affected by nutrition and physical activities of children.2
During last few decades, PFTs have been evolved from the tool for physiological study to clinical investigation in assessing respiratory status of the patients. The
development of pulmonary function and growth of physical parameters go hand in hand in children.3 Therefore measurement of lung functions is important for the evaluation of physical development and diseases. The prevalence of childhood pulmonary diseases especially bronchial asthma is increasing worldwide and this necessitates the need for establishing regression equations for predicting pulmonary function in children.4 Usually the values are compared with the standards obtained from healthy individuals of similar age and height. Development of pulmonary function is then described by means of regression equations usually employing sex, age and standing height as independent variables.5
ABSTRACT
Background: The development of pulmonary functions and growth of physical parameters i.e. height and weight are
coexistent. These physical parameters are further affected by nutrition and physical activities of children. The aim of present study was to find correlation between pulmonary function test and anthropometric measurements using bioelectric impedance analysis in adolescence.
Methods: A cross sectional observational study conducted at Sanskar Madhmik Vidhylay, Mayur Park, Aurangabad
during July to December 2017. Adolescent between the age group between 11 to 18 years were enrolled in present study.
Results: Out of 138 total students 80 (57.97%) were male and 58 (42.02%) female. As per person correlation test analysis weight, height, Hip circumference and body surface area are found to be positively correlated to FVC, FEV1, PEFR and FEF25-75. As per person correlation test analysis total body fat, trunk subcutaneous fat and whole body subcutaneous fat are found to be negatively correlated to FVC, FEV1, PEFR and FEF25-75. Muscle mass and basal metabolic rate are found to be positively correlated to FVC, FEV1, PEFR and FEF25-75.
Conclusions: Total body fat, trunk subcutaneous fat and whole body subcutaneous fat are negatively correlated with
pulmonary function test. The body fat percentage had a stronger correlation than BMI, thus suggesting that body fat percentage was a major determinant of the reduced pulmonary functions in both sexes.
Keywords: Total body fat, Lung function test, Body mass index
Department ofCommunity Medicine, MGM Medical College and Hospital, Aurangabad, Maharashtra, India
Received: 01 June 2018
Accepted: 05 July 2018
*Correspondence:
Dr. Rahul R. Surve,
E-mail: [email protected]
Copyright: © the author(s), publisher and licensee Medip Academy. This is an open-access article distributed under
the terms of the Creative Commons Attribution Non-Commercial License, which permits unrestricted non-commercial use, distribution, and reproduction in any medium, provided the original work is properly cited.
Obese and overweight people are at an increased risk of respiratory symptoms, such as breathlessness, particularly during exercise, even if they have no obvious respiratory illness. The association between obesity and asthma has also raised new concerns about whether the mechanical effects of obesity on the respiratory system contribute to airway dysfunction that could induce or worsen asthma.6 Although obesity-related lung function changes have been described in adults, there is a lack of data on such changes in children.7 The increase in childhood obesity is an emerging problem worldwide and directly contributes to obesity in adulthood; as a result, there is an increase in the incidence of fatal diseases such as cardiovascular disease, metabolic syndrome, dyslipidemia, diabetes mellitus, arterial hypertension, and even respiratory changes.8
Anthropometric measurements are an important, widely applicable, noninvasive, and inexpensive technique for assessing body size, proportions, and composition.9 Differences in LF parameters (forced expiratory volume in 1 s [FEV1] and forced vital capacity [FVC]) are due in part to differences in body proportions as well as several other factors. Some evidence also suggest that psychosocial factors, and family problems, may influence truncal length and height in childhood.10,11
Aim and objectives
Aim
To find correlation between pulmonary function test and
anthropometric measurements using bioelectric
impidence analysis in adolescence.
Objective
To study relationship between anthropometric measurement like weight, height, body mass index (BMI) and pulmonary function test in adolescence.
To study relationship between body fat percentage and Muscle mass with pulmonary function test in adolescence.
METHODS
Study design
Cross sectional observational study.
Study area
Sanskar Madhmik Vidhylay, Mayur Park Aurangabad.
Inclusion criteria
Inclusion criteria were adolescent between the age group between 11 to 18 years.
Exclusion criteria
Exclusion criteria were cardiorespiratory diseases;
thoracic cage disorders; children with H/O bronchial asthma, COPD or allergic diseases; children on treatment of respiratory tract infection; smoking.
Sampling method
Purposive sampling
Study instrument
Performa containing identifying data
Bioelectric Impidence analysis - Karada scan A complete spirogram was performed according to American Thoracic Society (ATS) guidelines by using an computerized spiromrtere.15 The test was carried out in a private and quiet room in a standing position with the nose clip held in position on the nose. The flow, volume/timed graph were taken out in accordance to the criteria based on the ATS. The subject was instructed to take a deep breath until the lung were full and then blow out through mouth as forcibly and as fast and as long as possible till the maximum capacity, sealing the lips tightly around a clean mouth piece. Best of the three acceptable curves was selected as the recording. Spirometric parameters recorded for analysis were forced expiratory volume in 1 second (FEV1), forced vital capacity (FVC), FEV1/FVC ratio, peak expiratory flow rate (PEFR), forced expiratory flow FEF25‑ 75%.
Anthropometric measurement
Weight: It was measured without shoes with the help of weighing machine to the nearest 0.1 kg mark.
Standing height: It was measured against wall inscribed with measuring scale to the nearest centimeter.
BMI:- Weight in kg/height in m2
Chest circumference: Measured at the level of nipple in mid-inspiration.
Waist circumference: Midpoint between lower margine of last palpable rib and top of iliac crest
Hip circumference: Measurement should be taken around
widest portion of the buttocks.
Waist to hip ratio: Waist circumference/hip
circumference
Body surface area: Mosteller formula-
Study period
July to December 2017.
Sample size
Sample size was calculated using stastical software for calculating Sample Size using Estimation of Sample Mean by considering confidence level of 95% and absolute precision of 1%. The mean of 89.95 with SD of 5.82.
M- Your guess of population M- 89.95 S - Standard deviation of M- 5.82
1-alpha - set level of confidence (value <1.0) - 0.95 Z1- Z value associated with confidence - 1.96 d - Absolute precision (=value <M) - 1 n - Minimum sample size– 131.
RESULTS
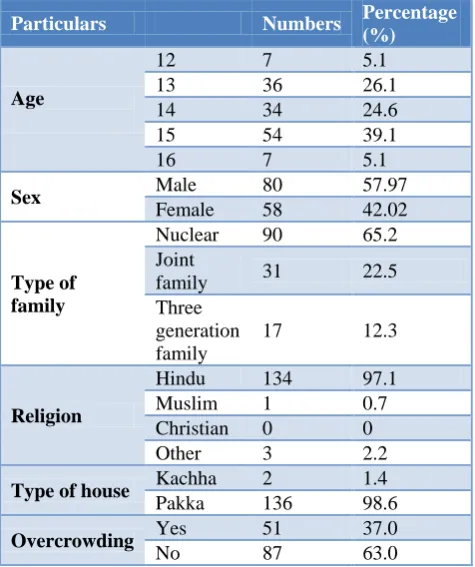
Table 1 shows the demographic profile of the students studied, the students were from age group 12 to 16 of which 39.1% from age 15, 26.1% and 24.6% from 13 and 14 age group. Out of 138 total students 80 (57.97%) were male and 58 (42.02%) female. 65.2% of all were from nuclear, 22.5% from joint and 12.3% from three generation family. 37% students are living in overcrowded conditions.
Table 1: Demographic profile of students.
Particulars Numbers Percentage
(%)
Age
12 7 5.1
13 36 26.1
14 34 24.6
15 54 39.1
16 7 5.1
Sex Male 80 57.97
Female 58 42.02
Type of family
Nuclear 90 65.2
Joint
family 31 22.5
Three generation family
17 12.3
Religion
Hindu 134 97.1
Muslim 1 0.7
Christian 0 0
Other 3 2.2
Type of house Kachha 2 1.4
Pakka 136 98.6
Overcrowding Yes 51 37.0
No 87 63.0
Table 2 shows the various anthropometric parametric Mean and Standard deviations in students. The mean
weight was 47.88 kg and 43.20 kg in male and females respectively, height was 163.55 cm and 151.08 cm in male and female respectively.
Table 2: Anthropometric parameters in students.
Sr.
no. Parameters
Male (Mean±SD)
Female (Mean±SD)
1 Weight 47.88±8.64 43.20±6.79
2 Height 163.55±8.5 151.08±18.9
3 Body mass index 17.85±2.63 18.26±2.57
4 Chest
circumference 29.34±2.62 29.49±2.16
5 West
circumference 27.01±2.88 26.96±2.65
6 Hip
circumference 33.66±2.49 33.50±2.80
7 W/h ratio 0.79±0.60 0.80±0.05
8 Body surface
area 1.46±0.17 1.34±0.11
Table 3: Mean of body fat analysis as per bioelectric impidence analysis.
Sr.
no. Parameters
Male (Mean±SD)
Female (Mean±SD)
1 Total body fat 14.62±4.30 22.53±3.59
2 Trunk
subcutaneous fat 8.16±2.80 14.66±3.62
3 Whole body
subcutaneous fat 9.82±2.91 18.80±3.69
4 Muscle mass 37.08±2.21 27.74±2.78
5 Basal metabolic
rate 1275±140.56 1033±100.02
Table 3 shows mean of body fat analysis as per bioelectric impedance analysis, all the total body fat, trunk subcutaneous fat and whole body subcutaneous fat was significantly higher in females than males, but muscle mass is more in males than females.
Table 4: Outcome of lung function test.
Sr.
no. Parameters
Male (Mean±SD)
Female (Mean±SD)
1 FVC 2.67±0.67 2.05±0.52
2 FEV1 2.55±0.61 1.98±0.47
3 PEFR 6.10±1.28 4.79±0.99
4 FEF 25-75 3.93±1.08 3.49±0.91
Table 5: Restriction of lung function test found in spirometry with its severity classification.
Particulars Numbers %
Restriction Yes 50 36.2
No 88 63.8
Restriction classification
Mild 18 36
Moderate 26 52
Table 5 shows the distribution lung function test in male and female students. It shows the mean and standard deviation of FVC (forced vital capacity), FEV1 (forced expiratory volume 1), PEFR (peak expiratory flow rate), FEF25-75 (forced expiratory flow between 25% and 75% expired volume (FEF25‑75%).
The difference between male and female for FVC and PEFR are statistically significant, but FEV1 and FEF25-75 are not significant.
As per person correlation test analysis weight, height, Hip circumference and body surface area are found to be positively correlated to FVC, FEV1, PEFR and FEF25-75 but chest circumference is positively correlated with FVC, FEV1 and PEFR. Waist to Hip ratio is found to be negatively correlated to FVC, FEV1, PEFR and FEF25-75. BMI and hip circumference are not correlated to FVC, FEV1, PEFR and FEF25-75.
Table 6: Relationship between anthropometric parameters with lung function test.
FVC FEV1 PEFR FEF 25-75
1 Weight r=0.436* r=0.427* r=0.405* r=0.260*
2 Height r=0.440* r=0.447* r=0.353* r=0.207*
3 BMI r=0.071 r=0.051 r=0.091 r=0.073
4 Chest circumference r=0.287* r=0.273* r=0.228* r=0.157*
5 Waist circumference r=-0.062 r=-0.072 r=-0.030 r=-0.38
6 Hip circumference r=0.279* r=0.264* r=0.242* r=0.155
7 Waist/hip ratio r=-0.385* r=-0.385* r=-0.288* r=-0.220*
8 Body surface area r=0.529* r=0.525* r=0.486* r=0.309*
Table 7: Relationship between body fat distributions as per bioelectric impedance analysis with lung function test.
FVC FEV1 PEFR FEF 25-75
1 Total body fat r=-0.409* r=-0.430* r=-0.434* r=-0.230*
2 Trunk subcutaneous fat r=-0.372* r=-0.388* r=-0.398* r=-0.201*
3 Whole body subcutaneous fat r=-0.425* r=-0.440* r=-0.436* r=-0.214*
4 Muscle mass r=0.452* r=0.462* r=0.487* r=0.230*
5 Basal metabolic rate r=0.582* r=0.577* r=0.571* r=0.325*
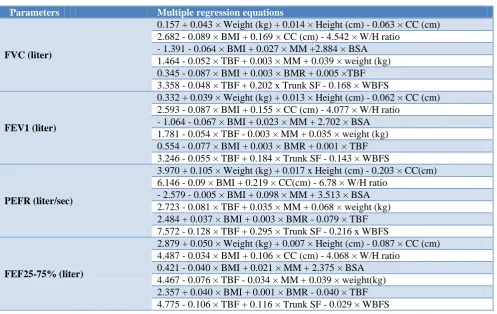
Table 8: Multiple regression equations for pulmonary function of adolescent.
Parameters Multiple regression equations
FVC (liter)
0.157 + 0.043 × Weight (kg) + 0.014 × Height (cm) - 0.063 × CC (cm) 2.682 - 0.089 × BMI + 0.169 × CC (cm) - 4.542 × W/H ratio
- 1.391 - 0.064 × BMI + 0.027 × MM +2.884 × BSA 1.464 - 0.052 × TBF + 0.003 × MM + 0.039 × weight (kg) 0.345 - 0.087 × BMI + 0.003 × BMR + 0.005 ×TBF 3.358 - 0.048 × TBF + 0.202 x Trunk SF - 0.168 × WBFS
FEV1 (liter)
0.332 + 0.039 × Weight (kg) + 0.013 × Height (cm) - 0.062 × CC (cm) 2.593 - 0.087 × BMI + 0.155 × CC (cm) - 4.077 × W/H ratio
- 1.064 - 0.067 × BMI + 0.023 × MM + 2.702 × BSA 1.781 - 0.054 × TBF - 0.003 × MM + 0.035 × weight (kg) 0.554 - 0.077 × BMI + 0.003 × BMR + 0.001 × TBF 3.246 - 0.055 × TBF + 0.184 × Trunk SF - 0.143 × WBFS
PEFR (liter/sec)
3.970 + 0.105 × Weight (kg) + 0.017 x Height (cm) - 0.203 × CC(cm) 6.146 - 0.09 × BMI + 0.219 × CC(cm) - 6.78 × W/H ratio
- 2.579 - 0.005 × BMI + 0.098 × MM + 3.513 × BSA 2.723 - 0.081 × TBF + 0.035 × MM + 0.068 × weight (kg) 2.484 + 0.037 × BMI + 0.003 × BMR - 0.079 × TBF 7.572 - 0.128 × TBF + 0.295 × Trunk SF - 0.216 x WBFS
FEF25-75% (liter)
2.879 + 0.050 × Weight (kg) + 0.007 × Height (cm) - 0.087 × CC (cm) 4.487 - 0.034 × BMI + 0.106 × CC (cm) - 4.068 × W/H ratio
As per person correlation test analysis total body fat, trunk subcutaneous fat and whole body subcutaneous fat are found to be negatively correlated to FVC, FEV1, PEFR and FEF25-75. Muscle mass and basal metabolic rate are found to be positively correlated to FVC, FEV1, PEFR and FEF25-75.
DISCUSSION
The main objective of this study was to investigate the relationship between the lung function parameters (FVC, FEV1, PEFR and FEF25-75) and selected anthropometric variables, which included height, weight, WC, HC, CC, Waist to hip ratio and Body surface area and also to determine the body fat percentages according to bioelectric impidence analysis in adolescence (total body fat, trunk subcutaneous fat and whole body subcutaneous fat).
In our study we found weight, height, Hip circumference and body surface area were found to be positively correlated to FVC, FEV1, PEFR and FEF25-75 as Ganguli et al and Sachin Pawar et al had similar results.5,16 Manoj also found similar results with the anthropometric variables with urban and rural student.2 Height is considered as better index of body size and body size is proportional to lung size. This might be the reason for its best correlation with PFTs. Lad and Ganguli found negative correlation of FVC, FEV1, PEFR and FEF25-75 with BMI but no such correlation was found in our study.5,6 But we found Waist to Hip ratio to be negatively correlated to FVC, FEV1, PEFR and FEF25-75 which was inverse to Choudhuri who found positive correlation.17
We studied relationship between body fat (total body fat, trunk subcutaneous fat and whole body subcutaneous fat) and lung function parameters, we found total body fat, trunk subcutaneous fat and whole body subcutaneous fat found to be negatively correlated to FVC, FEV1, PEFR and FEF25-75 all the three parameters of body fat were significantly higher in females. Similar results were found with Lad high amounts of fat mass and adiposity may be related to a greater degree of airway narrowing.6,7 The results of the present study matched with those of Joshi et al’s and Collins et al’s studies, who found that the increased body fat% in the males and females showed a negative correlation with FVC.18,19 The results of this study disagreed with those of Muralidhara’s and Bhat’s studies, who found no correlation between BMI, body fat percentage and the pulmonary functions.20
For prediction of multiple regression equations three independent variables were selected: weight, height & chest circumference, BMI chest circumference and W/H ratio, BMI muscle mass and BSA, total body fat (TBF) muscle mass and weight, BMI BMR (basal metabolic rate) and TBF, TBF trunk subcutaneous fat & whole body subcutaneous fat.
CONCLUSION
Weight, height, hip circumference and body surface area are the strong determinants of pulmonary function test. Total body fat, trunk subcutaneous fat and whole body subcutaneous fat are negatively correlated with pulmonary function test. The body fat percentage had a stronger correlation than BMI, thus suggesting that body fat percentage was a major determinant of the reduced pulmonary functions in both sexes.
Funding: No funding sources Conflict of interest: None declared
Ethical approval: The study was approved by the Institutional Ethics Committee
REFERENCES
1. Akgün N, Özgönül H. Spirometric studies on normal Turkish subjects aged 8 to 20 years. Thorax. 1969;24(6):714-21.
2. Jiwtode MT, Raikar PR. Comparison of pulmonary function tests in urban and rural children of Nagpur,
Maharashtra, India. Int J Res Med Sci.
2017;5(3):908-11.
3. Deshpande JN, Dahat HB, Shirole CD, Pandc AH, et al. Pulmonary function and their correlation with anthropometric parameters in rural children. Indian J Pediatr. 1983;50:375-8.
4. Mitchell EA. International trend in hospital admission rates for asthma. Arch Dis Child. 1985;60:376-8.
5. Pawar S, Taksande AB. Prediction of pulmonary norms in healthy school boys 5-15 years - A review article. J Mahatma Gandhi Institute Med Sci. 2011;16(1).
6. Lad UP, Vilas G. Correlation Between Body Mass Index (BMI), Body Fat Percentage and Pulmonary Functions in Underweight, Overweight and Normal
Weight Adolescents. J Clin Diagnos Res.
2012;6(3):350-3.
7. Lazarus R, Colditz G, Berkey CS, Speizer FE. Effects of body fat on ventilator function in children and adolescents: cross-sectional findings from a random population sample of school children. Pediatr Pulmonol. 1997;24(3):187-94.
8. Assunção SNF, Daltro CHC. Lung function in the absence of respiratory symptoms in overweight children and adolescents. J Bras Pneumol. 2014;40(2):134-41.
9. Mohammed J, Maiwada SA. Relationship between anthropometric variables and lung function parameters among primary school children: Annals of Nigerian Med. 2015;9(1):20-5.
10. Onyiriuka AN, Egbagbe EE. Anthropometry and menarcheal status of adolescent nigerian urban senior secondary school girls. Int J Endocrinol Metab. 2013;11:71-5.
11. Whitrow MJ, Harding S. Ethnic differences in
socioeconomic, and psychosocial factors. Am J Respir Crit Care Med. 2008;177:1262-7.
12. Cole TJ, Bellizzi MC, Flegal KM, Dietz WH. Establishing a standard definition for child overweight and obesity worldwide: international survey. Br Med J. 2000;320:1–6.
13. Li AM, Chan D, Wong E, Yin J, Nelson EAS, Fok
TF. The effects of obesity on pulmonary function: Arch Dis Child. 2003;88:361-3.
14. Furqan M, Haque A. Surface area in children: a simple formula. Indian Paediatr. 2009;46(12):1085-7.
15. Richardson D, Cavill N, Ells L, Robert K. Measuring diet and physical activity in weight
management intervention. National Obesity
Observatory. 2011.
16. Ganguli IN, Pramanik P. Predicted Equations of Pulmonary Function Indices for East Indian Adolescent Girls. IOSR J Dent Med Sci. 2016;15(5):67-71.
17. Choudhuri D, Sutradhar B. Pulmonary function of adolescents from Tripura, a North‑eastern state of India. Lung India. 2015;32(4):353–8.
18. Joshi AR, Singh R, Joshi AR. Correlation of the pulmonary function tests with the body fat percentage in young individuals. Indian J Physiol Pharmacol. 2008;52(4):383–8.
19. Collins LC, Hoberty PD, Walker JF, Fletcher EC, Peiris AN. The effect of the body fat distribution on the pulmonary function tests. Chest. 1995;107:1298-302.
20. Muralidhara DV, Bhat MR. Some aspects of the pulmonary functions in underweight and overweight human subjects. Thai J Physiological Sci. 2007;20:3-7.
Cite this article as: Surve RR, Dase RK.The