Int. J. Nanosci. Nanotechnol., Vol. 15, No. 1, March. 2019, pp. 37-44
Effect of Dopant on Improving Structural,
Density and Functional Properties of Ceria
Based SOFC Electrolyte
A. Senthil Kumar1*, R. Balaji1 and S. Jayakumar2 1
Ceramic processing lab, Department of Physics, PSG College of Technology, Coimbatore-04, Tamilnadu, India.
2
Department of Physics, PSG Institute of Technology and Applied Research, Coimbatore-62, Tamilnadu, India.
(*) Corresponding author: [email protected]
(Received: 25 January 2018 and Accepted: 26 August 2018)
Abstract:
In the present work, Gadolinium Doped ceria (GDC) based solid electrolyte was successfully synthesized through wet chemical method to operate at intermediate temperature (500–700C) for SOFCs. DSC study revealed the formation of GDC phase at 900C during calcination. The crystal structure of GDC was identified as cubic fluorite phase and the crystallite size was found to be around 23 nm. The density of the material was found to increase with increase the conventional sintering temperature and the concentration of gadolinium content. SEM analysis revealed that the particles were uniform in size and shape. From the above results it was understood that the obtained particle was a single crystallite with the absence of agglomeration. Functional group analysis, confirmed the O-H bond stretching. Hence, GDC based electrolyte can be a good choice for SOFC applications.
Keywords: GDC, Conventional sintering, Electrolyte, SOFCs.
1. INRODUCTION
Solid oxide fuels cell was considered as one of the best electrochemical device for the direct conversion of chemical energy into electrical energy. SOFCs consist of three main components such as anode, cathode, and an electrolyte. Out of these three, electrolyte plays an important role for the conversion of energy with high efficiency [1]. Yttrium stabilized zirconia (YSZ) based materials are considered as the most efficient electrolyte with high ionic conductivity of 0.1 S/cm at 1000 C. This high temperature operation may leads to establish some practical difficulties such as thermal instability, thermal expansion mismatch and interfacial reaction between the electrodes and electrolyte, which severely hampers the practical application of YSZ as an electrolyte for solid oxide fuel cells [2].
In order to overcome the above stated problems, ceria based materials are doped
ions at higher operating temperature > 800
C [21, 22, 27, 29]. Further, the incomplete reduction reaction occurred in ceria system would also consequently decrease the mechanical strength of the electrolyte [9, 10]. So, operating temperature of such solid electrolyte must be reduced below 800 C to meet the commercial requirement. Hence, the present research work aims to prepare a suitable electrolyte to operate at intermediate temperature (500 C-700 C) for solid oxide fuel cell applications. Gadolinium doped ceria (GDC) powder was successfully synthesized through chemical route and the solid electrolyte was sintered through conventional sintering method. XRD and SEM analysis were carried out to study the effect of dopant in enhancing the structural, density and functional properties of ceria based electrolyte for SOFC applications.
2. EXPERIMENTAL METHODS 2.1 Powder Synthesis
The gadolinium doped ceria based electrolyte powder has been successively synthesized by co precipitation method. Flowchart for the synthesis of the sample was shown in Figure.1. Cerium nitrate and gadolinium nitrate (99.5% pure) were purchased from Sigma–Aldrich, Italy, dissolved in 50 ml of distilled water in a separate beaker. Two solutions with ceria (90%) and gadolinium (10 – 40%) were poured in a burette one by one and added together in a beaker drop-by-drop slowly with continuous stirring at 500 rpm using magnetic stirrer.
Figure 1. Flowchart to synthesis of GDC powder.
Ammonium hydroxide solution was then added to the mixture to maintain the pH >10. By the addition NH4OH, the mixture was precipitated out as hydroxides of Cerium/Gadolinium and stirrer with 1000 rpm for 30 minutes. In order to obtain the gel, the mixture was added with 10% of PEG (Poly Ethylene Glycol) as a binder and stirred well to improve green body formation [13].
To dry out the gel, the precipitate was then dried in hot air oven at 105 °C for 6 hours. The obtained gel was kept in furnace at 300 °C for 1 hr to get the dry powder. The powder was grained for 30 minutes and undergone calcinations to get the required phase formation at 400 °C and 500 °C for 4 hours. DSC was carried out with the help of TA Instruments to ascertain the calcination temperature. XRD analysis was performed to determining the crystallinity and the phase purity of the as-prepared green powder.
2.2 Pellet Preparation
Green pellets were obtained by uniaxial pressing the as prepared powder at 10 MPa, using a steel die of 12 mm diameter. Polyvinyl alcohol (PVA) was added as a binder with the green powder to increase the green strength of the pellets for good compaction [11]. The percentage of PVA addition was limited to 3% to avoid the formation of cracks and also to have proper bonding with oxide ions during sintering process [12, 27]. The pressed pellets were taken in alumina boat for sintering at 1100
C, 1200 °C, 1300 °C, and 1400 °C for 6 hours in air with a heating rate of 5 °C per minutes. When compared with the earlier work reported [1] sintering temperature of the pressed pellets was reduced from 1550 o
3. RESULT AND DISCUSSIONS 3.1 DSC Analysis
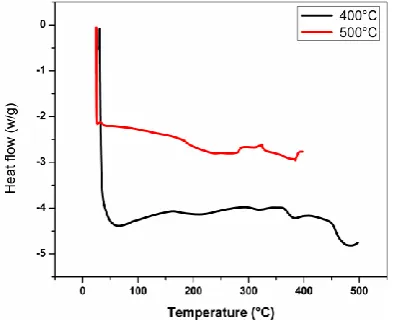
DSC phase analysis was carried out using DSC Q20 V24.2 Build 107 analyzer. GDC10 powder with molecular formula Gd0.1Ce0.9O2-δ was calcined at 400 °C and 500 °C in the temperature range from 30 °C to 500 °C at a constant heating rate of 5 °C per min. From the DSC curve shown in Figure.2, it was understood that the required phase formation was recognized with a small exothermic peak in the region around 286 °C to 290 °C and it was attributed as the decomposition temperature of PEG ( polyethylene glycol) and the organic solvent was completed only at 500 °C [2].
Figure 2. DSC patterns for GDC10 powder calcined at 400 °C and 500 °C for 4 hours.
An endothermic peak at 382 oC was observed as the temperature to form the required phase in GDC10 powder calcined at 400 °C and similarly in endothermic curve around 381 oC for the powder calcined at 500 °C. Based on this DSC results, calcinations temperature of the as prepared powder was identified as 500 °C and further works were carried out for the powder calcined at this prominent temperature.
From DCS curve (Figure.1) it’s also to understand that the GDC10 phase formation was completed at 500 °C at which it can get completely crystallized into cubic fluorite structure. The sign of two sharp endothermic peaks are observed at 382 °C and 475 °C. The first endothermic peak may be due the combustion of residual
organic species with 1.87% weight loss and the second one was mainly due to the decomposition of nitrates with 1.68% weight loss after which there was no sign of any loss from 500 °C, indicates that the completion of phase formation for ceria based electrolyte (GDC) [19, 23, 28].
3.2. Structural Analysis for Powder
XRD analysis was carried out for GDC10 powder calcined at 400 °C and 500 °C to confirm the presence of required phase. XRD pattern has been recorded using PANalytical X-ray diffractometer with Cu K alpha (λ-1.5406 Å) at 40 kV and 20mA in the two-theta value range of 10 C to 110
C. Figure.3 shows the XRD pattern for GDC10 powder calcined at 500 °C. Interestingly, the predominant peak and all the required planes are highly oriented at (111) for the GDC10 powder calcined at this temperatures. On the other hand, the peaks correspond to GDC phases are sharp and high intense. The high intense peak present at 29.39o corresponds to GDC phase and hence confirms that most of the grains are highly oriented in (111) plane.
Figure 3. X-ray diffraction pattern for GDC10 powder calcined at 500 °C.
where D is crystallite size in nm, λ is the radiation wavelength (for Cu Kα radiation, λ = 1.5406 Å), θ is the diffraction peak angle and β is the broadening of the line (“half width”) measured at half of its maximum intensity (in radians).
3.3 Structural Analysis for Pellet
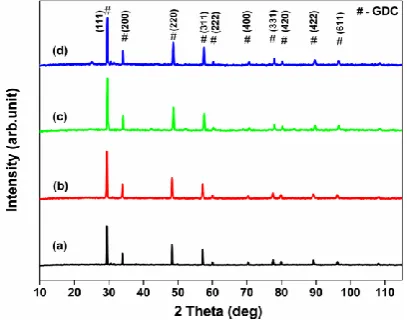
Figure.4. Shows the XRD pattern for GDC10 pellet sintered at (a) 1100 C (b) 1200 C (c) 1300 C (d) 1400 C conventionally. Even though the increase in sintering temperature from 1100 C to 1400
C, ceria based material can able to retain the GDC phase at higher temperature (1400 °C). Further, there was no sign of any decrease in phase with increase in sintering temperature was also observed.
Figure 4. X-ray diffraction patterns for GDC10 pellet sintered at (a) 1100 C (b)
1200 C (c) 1300C (d) 1400 C
conventionally.
Crystallite size for GDC powder was found to increase from 18 nm to 23 nm with increase in sintering temperature. However, few reports are available on GDC electrolytes materials prepared through conventional sintering (<1200 °C), but the morphology of the composites suggests incomplete densification [19, 20, 24]. It was understood from the available literature that increase in sintering temperature of ceria based materials can able to densify well
below 1500 °C [14] and also to avoid the loss of GDC phase at (111) plane.
3.3 Study on Densified GDC10 Electrolyte
The green powder was compressed using static press machine to obtain compact disc shaped pellet. In order to determine the most favorable sintering temperature, GDC10 pellet was heated at 1100 C, 1200
C, 1300 C and 1400 C using muffle furnace (conventional method). The density of GDC10 pellet sintered at 1100 C, 1200 °C, 1300 °C and 1400 °C through conventional method was measured using Archimede’s principle(liquid displacement) method .
The theoretical density of each composition is measured from the average mass per unit cell divided by the unit cell volume as determined from X-ray powder diffraction method [28]. The theoretical density (th) of the pellet is calculated from the following equations:
where th is the theoretical density of pellet (%), M is the molecular mass (gmol-1), V is the unit cell volume (cm3) and Na is the Avogadro number:
Figure 5.Variation of density with increase in sintering temperature.
The density of GDC10 sintered at 1100 °C was found to be ~70% of theoretical density. The maximum density (~87%) was achieved for the composite sintered at 1400 °C. The theoretical density was calculated using Archimedes principle and the percentage of theoretical density was shown in Table.1. The density of the GDC10 electrolyte was increased from 70 to 87%. The increased densification may be due to the fine grains size distribution of particles with reduced porosity and are in good agreement with the available literature [28].
Table 1. Variation of density with increase in sintering temperature(C).
Sample
Name
Temper ature
C
Th
g/cc
exp
g/cc
% )
GDC10 1100 6.222 4.357 70.02
GDC10 1200 6.221 4.392 70.59
GDC10 1300 6.220 5.056 81.28
GDC10 1400 6.220 5.417 87.09
3.5. Surface Morphology
The morphological analysis was carried out for GDC10 sample sintered at 1200 C, 1300 C and 1400 C. The SEM morphology for GDC10 sintered at 1200 C and 1300 C exhibits pores with coalesced grains. The presence of coalesced grains indicates that sintering temperature was not sufficient for completing the densification
process at lower temperature [19, 25, 29]. The absence of coalesced grains with few pores at higher temperature indicates that the densification process completes at 1400
C and the development of morphology was shown in Figure 6.
Figure 6. SEM image of GDC10 pellet sintered at (a) 1200 C (b) 1300 C (c) 1400 C (Conventional).
The above studies clearly reveal that the sintering temperature for GDC10 pellet was 1400 C, albeit the GDC phase was exist in the calcined powder. Further to increase the percentage of densification, gadolinium content in the electrolyte was increased from 10 – 40 mole%.
3.6. Study on Densified Electrolyte with Gd Content (10-40 mole %)
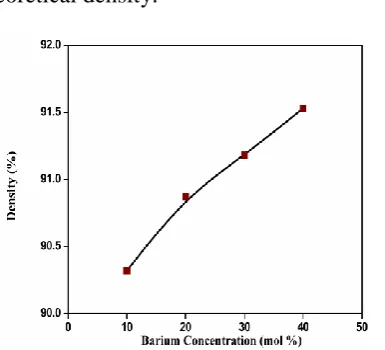
Figure 7. The density of GDC10 sintered at 1400 C was found to be ~87% of theoretical density.
Figure 7. Variation of density with increase in barium content (mol%)
The maximum density (~91%) was achieved for the GDC40 electrolyte. The density value was highly comparable to the reported value [15]. Table.2 shows that the variation in theoretical and experimental density of the pellet processed at 1400°C through conventional method with increase in Gd content.
Table 2. Density of GDC electrolyte heated at 1400 C (Conventional).
Sample
Code
Th
g/cc
exp
g/cc ( % )
GDC10 6.217 5.427 87.29
GDC 20 6.184 5.485 88.69
GDC 30 6.169 5.564 90.19
GDC 40 6.203 5.650 91.08
Hence, from density measurement it was understood that the increase in gadolinium content can increase the densification process in the electrolyte sintered at 1400°C conventionally.
3.7 SEM Measurement
The microstructural investigation was carried out for the pellets sintered at 1400
C for 6 hours using Hitachi S3400N SEM
analyzer. The surface micrograph of GDC (10-40 mole%) electrolyte shows the development of uniform grain size. From this SEM results shown in Figure.8, the average grain size was found to be around 1m. The SEM image reveals that the increase in gadolinium content tends to increases the grain size of the sample and leads to the development of high grain boundary resistance and tents to have higher ionic conductivity [20, 26].
Figure 8. SEM image for GDC (10-40 mole %) pellet sintered at 1400C.
The diffusion of oxide ions are highly expected to migrate through the oxygen vacancies created in between the GDC phase and crystallites [19]. Hence, high oxygen ionic conductivity can be made easy in GDC based electrolyte for SOFCs.
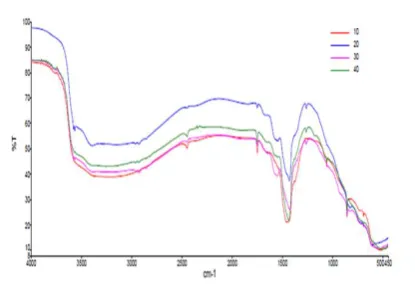
3.8 Functional Group Analysis
strong band below 700 cm-1 was assigned to the Ce-O stretching mode [13, 16]. The broad band, corresponding to the Ce-O stretching mode of CeO2 was seen at 500 cm-1 in GDC compound. The electronic structure of the optical band gap of the GDC material was basically implicit from UV-visible absorption spectrum. Absorption in the near ultraviolet region was mainly occurred from electronic transitions associated within the host oxide material [17].
Figure 9. FTIR spectrum for GDC (10-40 mole %) sample
In the as-prepared GDC powder, the strong absorption band nearer to low wavelengths at 380 nm corresponds to band gap energy of 3.26 eV and for calcined GDC nanoparticles, the strong absorption band at low wavelength near 385 nm corresponds to 3.22 eV. In dissimilarity with UV-visible absorption spectrum of the
as prepared nanoparticles, peak located in the spectrum around 400-700 nm were observed to be shifted towards the lower wavelength side and evidently illustrate the blue shift occurred in the material [18]. It signifies that the absorption positions depend on the morphologies of the sample and sizes of GDC particles. The UV absorption ability of CeO2 is related with band gap energy.
4. CONCLUSIONS
A DSC study confirms the calcination temperature of the as prepared powder as 900 C. The crystal structure of GDC based electrolyte was identified as cubic fluorite and crystallite size was found to be around 23 nm. The density of GDC electrolyte sintered at 1400 C was found to increase from 87-91% by the addition of gadolinium content. The development of fine grain microstructure was found in the sample with higher gadolinium content. The rate of oxygen ion diffusion was expected to be higher through GDC phase. Functional group analysis reveals that the band stretching with the band gap of 3.22 eV. Hence, GDC based electrolyte can act as a good choice of electrolyte for SOFC applications.
REFERENCES
1. Venkatasubramanian, A., Gopalan, P., Prasanna, T. R. S., (2010). “Synthesis and characterization of electrolytes based on BaO–CeO2–GdO1.5 system for intermediate temperature solid oxide fuel cells”,
International Journal of Hydrogen Energy, 35(10): 4597-4605.
2. Fuentes, R. O., Baker, R. T., (2008). “Synthesis and properties of Gadolinium-doped ceria solid solutions for IT-SOFC electrolytes”, International Journal of Hydrogen Energy, 33(13): 3480-3484.
3. Steele, B. C. H., (2000). “Materials for IT-SOFC stacks: 35 years RD: the inevitability of gradualness”, Solid state ionics, 134(1): 3-20.
4. Köferstein, R., Hesse, D., Ebbinghaus, S. G., (2011). “Synthesis and characterization of a nano-scaled barium cerate perovskite powder using starch as polymerization agent”, Solid State Ionics, 203(1): 52-56. 5. Kumar, A. S., Balaji, R., Puviarasu, P., Jayakumar, S., (2015). “Microwave and conventional sintering of
gadolinium doped barium cerate: a comparative study”, Optoelectronics and Advanced Materials-Rapid Communications, 9(5-6): 788-791.
6. Jadhav, L. D., Pawar, S. H., Chourashiya, M. G., (2007). “Effect of sintering temperature on structural and electrical properties of gadolinium doped ceria (Ce0· 9Gd0· 1O1· 95)”, Bulletin of Materials Science, 30(2): 97-100.
8. Shao, Z., Haile, S. M., (2004). “A high-performance cathode for the next generation of solid-oxide fuel cells”, Nature, 431(7005): 170-173.
9. Zhang, X., Robertson, M., Deĉes-Petit, C., Qu, W., Kesler, O., Maric, R., Ghosh, D., (2007). “Internal shorting and fuel loss of a low temperature solid oxide fuel cell with SDC electrolyte”, Journal of Power Sources, 164(2): 668-677.
10. Matsui, T., Kosaka, T., Inaba, M., Mineshige, A., Ogumi, Z., (2005). “Effects of mixed conduction on the open-circuit voltage of intermediate-temperature SOFCs based on Sm-doped ceria electrolytes”, Solid State Ionics, 176(7): 663-668.
11. Nernst, W., (1899). “On the electrolytic conduction of solid bodies at high temperatures”, Z. Electrochem, 6(2): 41-43.
12. Singh, V., Babu, S., Karakoti, A. S., Agarwal, A., Seal, S., (2010). “Effect of submicron grains on ionic conductivity of nanocrystalline doped ceria”, Journal of Nanoscience and Nanotechnology, 10(10): 6495-6503.
13. Ho, C., Yu, J. C., Kwong, T., Mak, A. C., Lai, S., (2005). “Morphology-controllable synthesis of mesoporous CeO2 nano-and microstructures”, Chemistry of Materials, 17(17): 4514-4522.
14. Abduraoof, K., Balaji, R., Jayakumar, S., Joshi, G.M., (2015). “Abnormal Grain Growth Free Strontium Barium Niobate by Microwave Assisted Sintering”, Ferroelectrics, 481(1): 196-205.
15. Gorbova, E., Maragou, V., Medvedev, D., Demin, A., Tsiakaras, P., (2008). “Investigation of the protonic conduction in Sm doped BaCeO3”, Journal of Power Sources, 181(2): 207-213.
16. Khan, S. B., Faisal, M., Rahman, M. M., Jamal, A., (2011). “Exploration of CeO 2 nanoparticles as a chemi-sensor and photo-catalyst for environmental applications”, Science of the total Environment, 409(15): 2987-2992.
17. Tao, Y., Wang, H., Xia, Y., Zhang, G., Wu, H., Tao, G., (2010). “Preparation of shape-controlled CeO 2 nanocrystals via microwave-assisted method”, Materials Chemistry and Physics, 124(1): 541-546.
18. Kumar, E., Selvarajan, P., Muthuraj, D., (2013). “Synthesis and characterization of CeO2 nanocrystals by solvothermal route”, Materials Research, 16(2): 269-276.
19. Kumar, A.S., Balaji, R., Jayakumar, S.,Pradeep, C., (2016). “Microwave assisted sintering of gadolinium doped barium cerate electrolyte for intermediate temperature solid oxide fuel cells”, Materials Chemistry and Physics, 182: 520-525.
20. Kumar, A. S., Balaji, R., Agalya, P., Bhuvanasundari, S., Jayakumar, S., Venkateswaran, R., (2017). “Investigation on structural and electrical property of gadolinium doped barium cerate electrolyte for SOFCs”, Optoelectronics and Advanced Materials-Rapid Communications, 11(1-2): 109-112.
21. Esposito, V., Traversa, E., (2008). “Design of electroceramics for solid oxides fuel cell applications: playing with ceria”, Journal of the American Ceramic Society, 91(4): 1037-1051.
22. Jud, E., Huwiler, C. B., Gauckler, L. J., (2005). “Sintering analysis of undoped and cobalt oxide doped ceria solid solutions”, Journal of the American Ceramic Society, 88(11): 3013-3019.
23. Zhang, T. S., Ma, J., Kong, L. B., Hing, P., Leng, Y. J., Chan, S. H., Kilner, J. A., (2003). “Sinterability and ionic conductivity of coprecipitated Ce0.8Gd0.2O2−δ powders treated via a high-energy ball-milling process”,
Journal of power sources, 124(1): 26-33.
24. Ahmad, S. I., Koteshwar Rao, P., Syed, I. A., (2016). “Sintering temperature effect on density, structural and morphological properties of Mg-and Sr-doped ceria”, Journal of Taibah university for science, 10(3): 381-385.
25. Dönmez, G., Sarıboğa, V., Gürkaynak Altınçekiç, T., Öksüzömer, M. A. F., (2015). “Polyol Synthesis and Investigation of Ce1−xRE x O2− x/2 (RE= Sm, Gd, Nd, La, 0≤ x≤ 0.25) Electrolytes for IT‐SOFCs”, Journal of
the American Ceramic Society, 98(2): 501-509.
26. Ahmad, S. I., Mohammed, T., Bahafi, A., Suresh, M. B., (2017). “Effect of Mg doping and sintering temperature on structural and morphological properties of samarium-doped ceria for IT-SOFC electrolyte”, Applied Nanoscience, 7(5): 243-252.
27. Jasmine Ketzial, J., Samson Nesaraj, A., (2010). “Chemical Precipitation of BaCeO3–CeO2 Based
Nano-ceramic Composite Oxide Materials and Their Physical Characterization”, International Journal of Nanoscience and Nanotechnology, 6(3): 179-190.
28. Maghsoudipour, A., (2013). “Sintering Behavior of Porous Nanostructured Sr-Doped Lanthanum Manganite as SOFC Cathode Material”, International Journal of Nanoscience and Nanotechnology, 9(2): 71-76. 29. Esmaeili, E., Rashidi, A. M., Jafari-Jozani, K., (2014). “Cerium-Promoted PtRu/MWNTs as the Anode