IJSRSET1841080 | Received : 10 Dec 2018 | Accepted : 25 Dec 2018 | November-December-2018 [ 4 (11) : 277-282]
Themed Section : Engineering and Technology DOI : https://doi.org/10.32628/IJSRSET1841080
277
Pattern Recognition Using Image Processing
Gayathri J, Ramya S
Department of Computer Science and Engineering, Bannari Amman Institute of Technology, Coimbatore, Tamil Nadu, India
(An Autonomous Institution, Affiliated to Anna University, Chennai) ABSTRACT
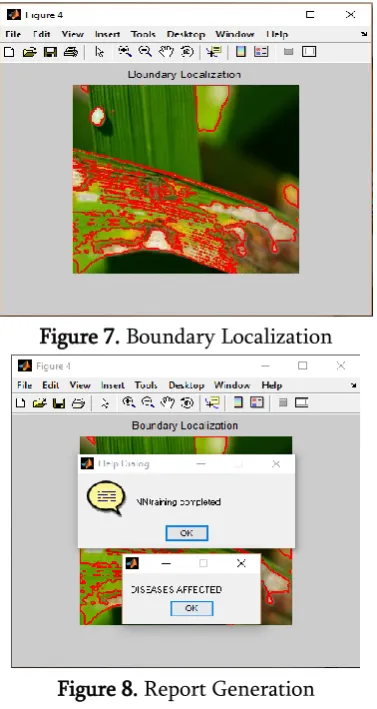
Paddy cultivation plays an important role in agriculture. But the growth of crop is affected by various diseases. If detection of disease is not properly done at earlier stage, then it may result in decrease of paddy production. India is agriculture based country and it provides employment to peoples in rural areas.. The agricultural sector plays major role in development of our economy by providing employment for rural peoples. Paddy is the staple food of Indians and hence it is considered as nation’s important product. Crop management is followed to protect paddy plants from fungal and bacterial diseases. The main goal is to develop an image processing system to identify and classify the various diseases affecting the growth of paddy plants. The work is divided into two parts paddy crop disease detection and recognition of paddy crop diseases. Disease detection technique is used to detect the disease affected portion in the paddy plant. The techniques used to detect diseased portions of paddy crop are Boundary localization and Haar-like features methods and neural network is employed based on diseases classification.
Keywords: Paddy cultivation, paddy crop diseases, geometric properties, PCA, computed tomography, Probabilistic Neural Networks, Regression Neural Networks
I. INTRODUCTION
Image processing techniques is used to identify objects by noise removal feature extraction to find regions, lines and textures. Single objects is a collections of shapes which is an AI problem that can be viewed different at different angles. Also deciding of shadows and features to which object it belongs also difficult. Humans perform their tasks by understanding but a computer requires a human skill and some more processing steps to perform equal to humans. Manipulation of data into an image has several techniques. An image is basically represented as a 2-Darray and is represented by patterns. An image is processed optically or digitally in a computer. In a digital processing, first an image is transformed to a sequence of numbers which can be handled by the
computer. Number represents the quality of an image at a particular point is called a picture element or pixel. A digitized image will have 512 × 512 or roughly 250,000 pixels. Once the image is digitized, then three basic operations are performed by using a computer. In a point operation, output images pixel value depends on input image single pixel value. In local operations, several adjacent pixels of input images determines the pixel value of an output image. For an overall operation, pixel value of input image contribute to pixel value of output image.
Noise smoothing is an example for appealing. For smoothing median filtering is applied with a 3 × 3 pixel window. This means that every pixel value of the noisy image and values of its nearby eight neighbors is recorded. The recorded nine numbers are arranged according to their size, and with the pixel value of the new image the median is selected. The filtered image is formed as the 3 × 3 window is moved one pixel over the noisy image once a time. Contrast manipulation is an additional example of enhancement where each pixel's value in the new image depends on the pixel's value of the old image; also referred as point operation. Contrast manipulation is performed by adjusting the brightness and contrast controls on a television set, or by controlling the exposure and development time in print making. Another point operation is that of pseudo coloring a black-and- white image, by assigning arbitrary colors to the gray levels. This technique is popular in thermograph (the imaging of heat), where hotter objects (with high pixel values) are assigned one color (for example, red), and cool objects (with low pixel values) are assigned another color (for example, blue), with other colors assigned to intermediate values. Long standing goal of computer vision is recognition of object in real-world images. Variations of object instances belonging to the same class is difficult due to larger appearance. Additionally, distortion scanrender appearances of same object to be different from framework clutter, scale, and judgement variations. The challenge is instances from various classes can appear very similar which arises from interclass similarity.
Models for entity classes must be versatile enough to satisfy class variability and discriminative enough to riddle out true entity instances in cluttered images. The contradictory requirements of an object class model make acceptance difficult. This paper focuses mainly on two goals of acceptance are image classification and object detection. The image classification task is to check if an object class is available for an image, while object
combination by exploiting distinguishing shape, geometric, and structural constraints of an object class. Shape constraints describe the visual aspect of shape tokens, while geometric constraints describe its spatial layout (configurations). Structural constraints enforce possible poses/structures of an object by the relationships ( e.g.,XOR relationship) between shape-tokens.
II. PRINCIPAL COMPONENT ANALYSIS
The available spectral images expand the capability of classifying the characteristics of objects. Spectral scene used is well-known AVFINGERPRINT image. Noisy bands or coverings are removed and the remaining are taken into account. Data is normalized to aero mean and unit variance before training. 20% of samples were used for building the model and the rest were used for testing. PCA rely on fact that nearby bands of spectral images are highly correlated. This analysis is performed to remove the correlation over the bands. Band dependencies are examined by static properties of spectral bands of images.
PCA follows orthogonal transformations for converting observed correlated variables into an uncorrelated variables called principal components.
PCA steps: 1) Input.
2) Subtract the mean
3) Calculate co-variance matrix
4) Calculate the eigenvectors and eigen values of the co-variance matrix
5) Choosing components and forming a feature vector
6) Derive the new data set.
PCA can be done by eigen value decomposition of a covariance matrix usually after mean centering (and normalizing or using Z-scores) the data matrix for each attribute. The results of a PCA are in terms of component scores (transformed variable values
corresponding to a particular data point), and loadings (the weight by which each standardized original variable should be multiplied to get the component score).
The singular value decomposition of X is X = WΣVT, where the m × m matrix W is the matrix of eigenvectors of the covariance matrix XXT, the matrix Σ is an m × n rectangular diagonal matrix with nonnegative real numbers on the diagonal, and the n × n matrix V is the matrix of eigenvectors of XTX. The PCA transformation preserves dimensionality (which gives the same number of principal components as original variables) which is given by:
V is not uniquely defined in the usual case when m<n − 1, but Y will usually still be uniquely defined. Since W (by definition of the SVD of a real matrix) is an orthogonal matrix, each row of YT is simply a rotation of the corresponding row of XT. The first column of YT is made up of the "scores" of the instances with respect to the "principal" component, the next column has the scores with respect to the "second principal" component.
The singular values (in Σ) are the square roots of the eigen values of the matrix XXT. Each eigen value is proportional to the portion of the"variance" (more correctly of the sum of the squared distances of the points from their multidimensional mean) that is correlated with each eigenvector. The sum of all the eigen values is equal to the sum of the squared distances of the points from their multidimensional mean.
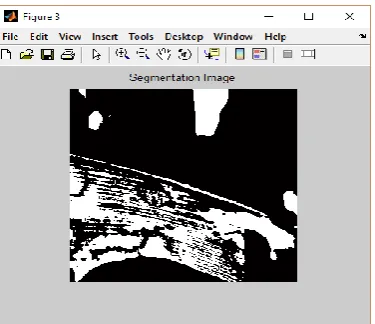
III. IMAGE SEGMENTATION
threshold value which turns a gray-scale image into a binary image. The key method is to select the threshold value (or values when many-levels are selected). Other popular methods includes maximum entropy method, Otsu's method (maximum variance), and k-means clustering. Recently, method that have been developed for threasholding is computed tomography (CT) images. The idea is that thresholds are derived from the radiographs instead of an(reconstructed) image.
A. Design Steps
1) Set the initial threshold T= (the maximum value of the image brightness + the minimum value of the image brightness)/2.
2) Using T segment the image to get two sets of pixels B (all the pixel values are less than T) and N (all the pixel values are greater than T);
3) Calculate the average value of B and N separately, mean ub and un.
4) Calculate the new threshold: T= (ub+un)/2
5) Repeat Second steps to fourth steps upto iterative conditions are met and get necessary region from the brain image.
IV.CLUSTERING
Clustering is considered as the most predominant unsupervised learning problem which deals with determining a structure from a collection of unlabeled data. A cluster is defined as a collection of objects which are “similar” between them and “dissimilar” to the objects of other clusters.
Clustering algorithms is classified as listed below
Exclusive Clustering
Overlapping Clustering
Hierarchical Clustering
Probabilistic Clustering
V. KMEANS CLUSTERING
Cluster algorithm groups the data into classes or clusters so that objects within a cluster have high similarity in comparison to one another, and are dissimilar to objects in other clusters. Dissimilarities are evaluated based on the attribute values describing the objects. The widely used clustering error criterion is squared-error criterion, it can be defined as
where J, is the sum of square-error for all objects in
the database, is the point in space representing a
given object, and is the mean of cluster
.Adopting the squared-error criterion, K-means works well when the clusters are compact clouds that are rather well separated from one another and are not suitable for discovering clusters with non-convex shapes or clusters of very different size. To minimize the square-emor criterion, it will divide the objects in one cluster into two or more clusters. In addition to that, while applying this square-error criterion to evaluate the clustering results, the optimal cluster corresponds to the extremum. Since the objective function has many local minimal values, the results of initialization is exactly near the local minimal point, than the algorithm will terminate at a local optimum. Hence, random selection of initial cluster center is easy to get in local optimum but not the entire optimal. For overcoming that square-error criterion is hard to distinguish the big difference among the clusters, one technique has been developed which is based on representative point-based technique. A. The Multilayer Perceptron Neural Network Model The following diagram illustrates a Perceptron network with three layers:
B. Probabilistic Neural Networks (PNN)
Probabilistic (PNN) and General Regression Neural Networks (GRNN) have similar architectures, but there is a underlying difference: Probabilistic networks perform classification where the target variable is definite(categorical), whereas general regression neural networks perform regression where the target variable is constant(continuous). If you select a PNN/GRNN network, DTREG will automatically select the correct category of network based on the type of target variable.
C. Architecture of a PNN
Figure 2 D. Actual Architecture
Figure 3
VI.RESULT
Figure 4. Input Paddy Image
Figure 5.
urE. PCA Singleband Image
Figure 7. Boundary Localization
Figure 8. Report Generation
VII.
CONCLUSION
This paper is an attempt to implement paddy disease detection using a machine by developing a software. It is developed with the implementation of understanding how to extract features, segmentation and boundary analysis based on the data information collected from the user. If the system is implemented then the plenty of disease detection system can be developed for further improvement in the field of agriculture.
VIII. REFERENCES
[1]. http://www.codeforge.com/read/237841/detectfeat
ures.mhtml
[2].
http://epubs.surrey.ac.uk/726872/1/Tuytelaars-FGV-2008.pdf
[3]. Sandesh Raut, Amit Fulsunge " Plant Disease
Detection in Image Processing Using MATLAB" International Journal of Innovative Research in
Science, Engineering and Technology, Vol. 6, Issue 6, June 2017.
[4]. Revanna Rama Gavade, Sanjeevakumar Ganapati
Khichade, Chithra J L, Nayana M C "Leaf Infection Detection And Diagnosis Using Image
Processing Technique", Project Reference
Number: 38s0895.
[5]. https://in.mathworks.com/matlabcentral/fileexcha
nge/55098-plant-leaf-disease-detection-and-
classification-using-multiclass-svm-classifier?focused=5974461&tab=function, "Plant Leaf Disease Detection and Classification using Multiclass SVM Classifier",version 1.0 (884 KB) by Manu BN.
[6]. R. Uma Rani , P. Amsini "Pest Identification in
Leaf Images using SVM Classifier", International Journal of Computational Intelligence and Informatics, Vol. 6: No. 1, June 2016.
[7]. Savita N. Ghaiwat, Parul Arora "Detection and
Classification of Plant Leaf Diseases Using Image processing Techniques: A Review",International Journal of Recent Advances in Engineering& Technology (IJRAET).
[8]. Kamil Dimililera *, Ehsan Kianib "Application of
back propagation neural networks on maize plant detection", 9th International Conference on Theory and Application of Soft Computing, Computing with Words and Perception, ICSCCW 2017, 22-23 August 2017, Budapest, Hungary.
[9]. T. Rumpf a,∗,1, A.-K. Mahleinb,1, U. Steiner b,
E.-C. Oerke b, H.-W. Dehne b, L. Plümer "Early detection and classification of plant diseases with Support Vector Machines based on hyperspectral reflectance", Computers and Electronics in Agriculture74 (2010) 91-99.
Cite this article as :
Gayathri J, Ramya S, "Pattern Recognition Using Image Processing", International Journal of Scientific Research in Science, Engineering and Technology (IJSRSET), ISSN : 2456-3307, Volume 4 Issue 11, pp. 277-282, November-December 2018.
Available at doi :