Anthony L. Menendez
Cleveland State UniversityLinda Donica Payne
East Tennessee State Universityand
Michel R. Mayton
Tennessee Technological University
The Implementation of Positive Behavioral
Support in an Elementary School:
Processes, Procedures, and Outcomes
This article presents the processes and outcomes of a year of School-Wide Positive Behavior Support in a North Texas elementary school serving kindergarten through grade 3 students. Included is a description of a school treatment package that incorporated components such as facilitation of the teaming process, a lottery-type system of
intermittent reinforcement, mystery motivators, and recognition assemblies, all targeted at increased student compliance with school rules. Positive outcomes included: (a) a reduction in the number of office referrals; (b) reduced frequency of rules-based violations on the part of students; (c) reduced use of punitive consequences such as time-outs, written
reprimands, and student conferences on the part of the faculty and administration; and (d) an increase in scores on a state-mandated academic achievement assessment administered to grade 3 students.
Cet article présente les processus et les résultats découlant de la mise en application, pendant une année, d’un programme de gestion de classe et d’école pour contrer l’indiscipline et les conflits (SchoolWide Positive Behavior Support) dans une école primaire (maternelle-troisième) dans le nord du Texas. Nous décrivons le programme et ses composantes telles la facilitation du processus de formation d’équipes, un système
ressemblant à un jeu de loterie et visant le renforcement intermittent, des facteurs motivants «mystères» et des rencontres de reconnaissance du mérite – le tout pour stimuler chez les élèves un comportement conforme aux règlements de l’école. Parmi les résultats positifs, notons : (a) une diminution du nombre d’élèves envoyés à la direction; (b) une diminution de la fréquence des infractions; (c) une diminution de l’emploi des
Anthony Menendez is a faculty member in the Department of Teacher Education where he teaches courses on classroom management and instructional strategies for students with severe disabilities. His research interests include positive behavior support and research-based instruction.
Linda Donica Payne is an assistant professor. She integrates a background in regular education, counseling, and special education to provide support for students with behavioral disorders. Her interests include functional behavioral assessments, positive behavior supports, and training preservice special education teachers.
punitions telles la suspension de renforcement, les réprimandes écrites et les conférences entre les élèves et le personnel enseignant et l’administration; et (d) une hausse des scores obtenus par les élèves en 3e aux évaluations d’état du rendement académique.
Positive behavior support (PBS) is a general term that refers to positive havioral interventions that are designed to achieve socially important be-havioral change (Sugai et al., 2000a). In addition, PBS is premised on the use of non-aversive strategies (Clark, Worcester, Dunlap, Murray, & Bradley-Klug, 2002; Taylor-Greene & Kartub, 2000) that have at their core an instructional component that is complemented by the systematic use of positive reinforce-ment (Netzel & Eber, 2003; Taylor-Greene & Kartub).
This approach, which centers on creating environments that are conducive to student success, has been shown to be effective with individual students (Artesani & Mallar, 1998) as well as with groups of students in public school settings (Warger, 1999). As such, an ever-emerging database is accruing cor-relating PBS with a reduction in problematic behavior as evidenced by a reduction in office referrals (Turnbull et al., 2002; Warren et al., 2003). School-wide PBS has been shown to be effective with elementary students (Colvin & Fernandez, 2000; Sadler, 2000; Scott, 2001) as well as with students in middle grades (Taylor-Green & Kartub, 2000; Turnbull et al.) and high school students (Bohanon et al., 2006).
The literature is replete with examples of successful implementation of school-wide PBS (Lohrmann-O’Rourke et al., 2000; Metzler, Biglan, Rusby, & Sprague, 2001; Scott, 2001). In particular, Sprague et al. (2001) published a study delineating the process of implementing school-wide PBS in nine ele-mentary and middle schools using six comparison schools to measure the effect. The measures used included office discipline referrals and student and staff surveys. In this study, the schools implementing PBS showed a reduction in office referrals.
Colvin and Fernandez (2000) reported 10 years of successful use of school-wide PBS at Clear Lake Elementary, a small, rural elementary school in Oregon. Specifically, office referrals were reduced. In addition, the school climate was reported by the principal to be positive. The principal also repor-ted that currently, the staff is able to focus on teaching academic and behavioral skills proactively, rather than spending time and energy on reactive discipline interactions with students. Similarly, Sadler (2000) reported that she had re-ceived numerous comments from teachers and staff members that equated the use of PBS with a more positive and calmer school environment.
The Bangor Area School District implemented school-wide PBS in one elementary and one middle school in its district (Lohrmann-O’Rourke et al., 2000). The elementary school incorporated a pledge comprising the four tar-geted rules repeated by all students each morning, whereas the middle school developed an acronym—BAMS: Be respectful, Act appropriately, Manage your time and task, and Strive to succeed—as vehicles for teaching the school expectations. Both schools reported a reduction in office referrals.
workshops. In a follow-up evaluation, schools reported reduced office referrals and an improved tone in their school climates.
The collective field literature served a valuable purpose in the planning of school-wide PBS for the elementary school noted in this study. Consistent with the related literature, the use of office discipline referrals was one of the measures used to evaluate success. Although certainly an indirect measure, office discipline referrals provide a useful index for two reasons. First, schools are busy institutions, and office discipline referral systems are already in place. Second, office referrals provide valuable data including the dates and times that problem behavior occurs. In addition, referrals provide a student’s name, the rule that was violated, and the consequence that resulted. This can be of benefit in measuring trends in behavior and preventing inappropriate behavior (Sugai, Sprague, Horner, & Walker, 2000b; Taylor-Greene & Kartub, 2000).
The purpose of this article is to disseminate information about the efficacy of a one-year, school-wide PBS program conducted in an elementary school setting in the North Texas area. Data accrued demonstrate a significant change in the number office referrals as well as other information that contributes to the emerging database that supports the use of PBS in applied educational settings. Specifically, this article delineates the processes, procedures, and out-comes associated with a systematic and proactive school-wide PBS program.
Methodology Participants and Setting
The subject of this school-wide study was a rural elementary school located in the North Texas area. During the 2000-2001 school year, the school served 652 students in grades K-3. Three administrators coordinated the activities of 44 teachers who were supported by 14 educational aides. Across all grade levels, the ratio of teachers to students was approximately 1 to 15.
During the 2000-2001 school year, the student racial distribution was main-ly Caucasian (82.1%) and Hispanic (15.5%) with small numbers of students classified as African American (1.2%) and Native American (1.2%). The stu-dents were distributed across grades as follows: kindergarten 133, grade 1 147, grade 2 158, grade 3 171. During this same school year, 38.5% of the school’s population was listed as economically disadvantaged. Limited English-profi-cient students comprised 7.2% of the student population. Special education services were provided for 14.7% of the students.
In addition, the building housed a pre-kindergarten program and an early childhood special education program that served adjoining districts. These students, representing a little over 6% of the school population, were not included in the study data due to the school’s record-keeping system.
kinder-garten 158, grade 1 143, grade 2 156, and grade 3 158. The building continued to house a pre-kindergarten program and an early childhood special education program that served adjoining districts. The number of students in these two programs remained relatively constant (6.6%).
For the 2001-2002 school year, 39.9% of the school’s population was listed as economically disadvantaged. Limited English-proficient students comprised 10.2% of the student population. Special education services were provided for 14.7%. Thus there was a slight increase in the number of economically disad-vantaged students as well as an increase in the Limited English-proficient students over the previous year.
Procedure
Consistent with the collective field literature, the teaming process was critical to the successful implementation of the school-wide support program (Colvin & Fernandez, 2000; Lewis & Sugai, 1999; Lewis, Sugai, & Colvin, 1998; Sugai & Horner, 2006; Taylor-Green & Kartub, 2000). The teaming process began with a thorough examination of field literature by the first two authors. This extensive effort yielded many usable documents/articles that were instrumental in guid-ing the plannguid-ing and implementation of the program. The seminal piece that served as the blueprint for the program was the implementation guide avail-able from Fern Ridge Middle School (1999).
A number of important events followed this research effort including se-quential activities that were critical in terms of planning and implementation (see Table 1). It is important to note that information in the form of inservice trainings, both in and outside the school building, is believed to have been of the utmost importance. These opportunities for learning provided the informa-tional foundation that was necessary to garner the support of key personnel. Administrative support was also seen as conducive to the success of the pro-gram (Scott & Hunter, 2001). Administrators were directly involved in the earliest planning stages as well as in securing funding for inservices and providing release time for professional staff to attend a full-day training away from the school building. The training was offered through an educational services center and was taught by Tim Lewis.
Early in the planning process, a half-day retreat was held. Key personnel were invited to attend this gathering, which served as an opportunity to provide an overview of PBS to professional staff members who were repre-sentative of teams in the building (e.g., grade-level teachers, special education teachers). The goal of this meeting was to demonstrate how PBS can be imple-mented school-wide and determine if sufficient support existed. At the con-clusion of this half-day meeting, approximately 80% of those in attendance indicated their approval of the plan. As a result, a planning team was formed.
in the school, they served as informational liaisons. We believe that this en-hanced the commitment of faculty and staff.
The CHIPS team subsequently met during the summer to begin to plan for the upcoming school year. This core of professionals brainstormed and thus developed consistent ways to reinforce behavior. Members of the CHIPS com-mittee developed behavioral expectations for each area of the building (e.g., cafeteria, hallways, classrooms, etc.). The behavioral expectations related to the
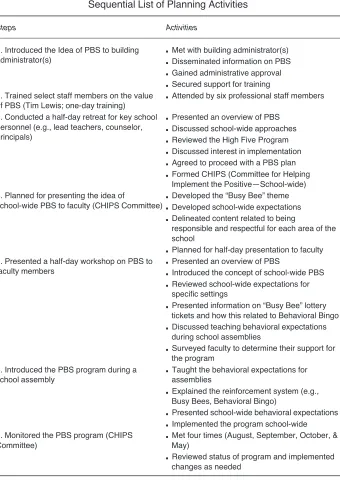
Table 1
Sequential List of Planning Activities
Steps Activities
1. Introduced the Idea of PBS to building administrator(s)
Met with building administrator(s) Disseminated information on PBS Gained administrative approval Secured support for training 2. Trained select staff members on the value
of PBS (Tim Lewis; one-day training)
Attended by six professional staff members
3. Conducted a half-day retreat for key school personnel (e.g., lead teachers, counselor, principals)
Presented an overview of PBS Discussed school-wide approaches Reviewed the High Five Program Discussed interest in implementation Agreed to proceed with a PBS plan Formed CHIPS (Committee for Helping Implement the Positive—School-wide) 4. Planned for presenting the idea of
school-wide PBS to faculty (CHIPS Committee)
Developed the “Busy Bee” theme Developed school-wide expectations Delineated content related to being
responsible and respectful for each area of the school
Planned for half-day presentation to faculty 5. Presented a half-day workshop on PBS to
faculty members
Presented an overview of PBS
Introduced the concept of school-wide PBS Reviewed school-wide expectations for specific settings
Presented information on “Busy Bee” lottery tickets and how this related to Behavioral Bingo Discussed teaching behavioral expectations during school assemblies
Surveyed faculty to determine their support for the program
6. Introduced the PBS program during a school assembly
Taught the behavioral expectations for assemblies
Explained the reinforcement system (e.g., Busy Bees, Behavioral Bingo)
Presented school-wide behavioral expectations Implemented the program school-wide 7. Monitored the PBS program (CHIPS
Committee)
Met four times (August, September, October, & May)
positively stated themes: (a) be responsible, and (b) be respectful. An example of the application of these themes involves being respectful while in class-rooms. In this example, respect is exhibited when students attend to and follow teachers’ directives. During this planning process, many helpful materials were downloaded from the Positive Behavioral Interventions and Supports Web site (i.e., PBIS.org).
The CHIPS committee then presented a half-day training for all faculty members to provide information about the implementation and value of school-wide positive behavioral supports. General information on PBS im-plementation and expected outcomes was presented. In addition, the setting-specific behavioral expectations were presented. At the conclusion of this meeting, faculty members were surveyed to ascertain their interest in the program. A vote indicated that more than 80% of the staff members were interested in proceeding with the PBS plan. It is believed that a vote of 80% indicates that sufficient support exists. This support is believed to be critical for the success of the program. All classroom teachers participated in implement-ing the PBS program.
A school-wide assembly was used in order to introduce the PBS program to students, faculty, and staff. At this assembly, the systematic reinforcement system was explained in detail. Also, how appropriate behaviors would be taught was subsequently introduced.
Committee members selected a lottery-type vehicle to reinforce students systematically across the elementary school setting. The idea was found in the work of Jenson, Rhode, and Reavis (1997). Adults in the building reinforced students with “Busy Bee” tickets for exhibiting appropriate behavior (Lewis & Sugai, 1999). On receiving a ticket, each student was prompted to write his or her name on the back of the ticket, which was then placed into a “hive” contained in each classroom. Twice during the day, once in the late morning for 30 minutes and once in the early afternoon for 30 minutes, teachers would draw from the hive and send the selected student(s) to the office to sign the Behavioral Bingo board. As rows were filled, all students in the row would receive mystery motivators (Jenson et al., 1997). In addition, the school coun-selor, three building administrators, and office staff members assisted students who drew numbers for board placement and name recording. Generally, only one adult at a time served in this capacity. While the students were participat-ing in the Behavioral Bparticipat-ingo process, this adult reinforced students orally. The Bingo board was placed prominently in the main hallway near the school office. This location was believed to keep students interested in the program as well as introducing the program to visitors.
projects in the form of songs and skits. Many of these were directly related to the behavioral expectations of specific areas of the building, thus providing additional opportunities for learning appropriate behaviors.
Results Referrals
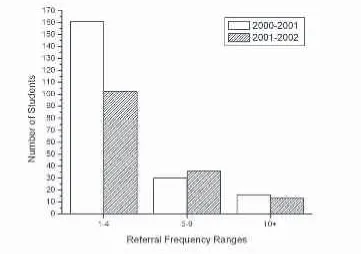
To determine the outcomes of this study, office discipline referrals were used. The first and third author used SPSS to process the related student data. During the PBS implementation year (2001-2002), the number of discipline referrals for eight of the 10 school months was lower than that of the previous year, with reductions ranging from 2-48.3% (SD=16.9). The number of referrals during two of the 10 months showed comparative increases from the previous year, one being relatively low (+1.4% in May) and the other higher (+34.2% in September). There were 130 fewer referrals during the implementation year, representing an 18.3% reduction from the previous year. Also interesting to note is that: (a) the largest percentage reduction in the number of referrals occurred in the first month of PBS implementation; (b) the marked increase in referrals during February (month 7) of the baseline year also occurred in the implementation year but to a notably lesser degree (–45.8%); and (c) a similar pattern of peaks and valleys is reflected across monthly referrals occurring in each 10-month period (see Figure 1).
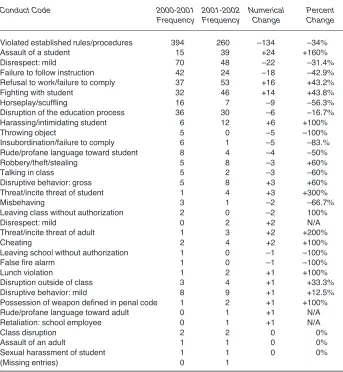
Based on the three-tiered model of school-wide discipline strategies (Sugai et al., 2000), students receiving referrals were categorized as those who re-ceived one to four referrals per school year, those who rere-ceived five to nine referrals, and those who received 10 or more referrals. The implementation of school-wide PBS seemed to have the greatest overall effect on those students prone to receive the fewest cumulative referrals, as evidenced by a 36.6% reduction in referrals for this group during the implementation year. The
percentage reduction in students receiving 10 or more referrals was about half that of the 1-4 group (18.8%), whereas the number of students in the 5-9 group increased by 20% (see Figure 2).
Conduct Codes and School Actions
Conduct codes were the customized designations that the elementary school used to categorize and differentiate between types of discipline referrals. School actions were the responses of the school administration to individual referrals. The various conduct codes and school actions were ordered from those with the highest numerical change between baseline and implementation years to those with the lowest numerical change between years. The largest numerical changes in the list were concentrated in approximately four conduct codes: (a) violated established rules/procedures, (b) assault of a student, (c) mild disrespect, and (d) failure to follow instruction. Although reaching a peak in month 9 that was similar to that of the baseline year, the implementation year monthly numbers of school/classroom rules violations were for the most part substantially lower. Similarly, but to a somewhat lesser degree, mild disrespect violations and failure to follow instruction violations showed rela-tive reductions in the implementation year. Interesting to note is that an in-crease in mild disrespect violations in month 7 of the baseline year did not recur during the implementation year. Similarly, an increase in failure to follow instruction violations, also in month 7 of the baseline year, was not seen during the implementation year. Assaults did not follow this pattern, however, for the number of assault violations more than doubled during the implementation year. The reasons for this increase are not known, but beginning in month 6 of the implementation school year, there was a steep climb in number of these violations through the end of the year.
School Actions
Like the situation with the conduct codes, the largest numerical changes in the list of school actions were concentrated in approximately four categories: (a) student conference, (b) written warning/reprimand, (c) withdrawal of privileges, and (d) time-out. The number of student conferences in the im-plementation year was substantially lower than that of the baseline year. Also, the number of written warnings and time-outs showed relative reductions in the implementation year. Interesting to note here is that increases occurring in the baseline year of each of the three school actions did not recur in the implementation year. Although in two of the three cases (student conferences and time-outs), the number of school actions was gradually increasing as the end of the implementation school year drew nearer.
The withdrawal of privileges action increased by 38% during the im-plementation year. The exact reasons for this increase are not known, but it appears that the number of privilege withdrawals was more evenly distributed across the implementation year when compared with the baseline year when almost all the privilege withdrawals occurred in the second half of the school year (see Tables 2 and 3).
Comparison by Gender
The number of referrals for both male and female students decreased in the implementation year, –19.6% and –13.2% respectively. Boys were referred 79.5% more often than girls during the baseline year and were referred 77.8% more often than girls during the implementation year.
Comparisons by Grade
Grade comparisons were made using both the total number of office referrals per grade level and the number of students receiving referrals in each grade. Because one student could be responsible for multiple referrals, viewing the data both ways helped to form a more accurate picture.
Number of Referrals
Across kindergarten and grades 1 and 2, there were reductions in the number of office referrals during the implementation year, with first grade showing the biggest reduction (–41.5%). Grade 2 referrals decreased by 18.1%, and kinder-garten referrals decreased by 16.7%. The number of referrals in grade 3 was not positively affected, however. Referrals for grade 3 students showed a relative increase of 7.6% in the implementation year.
Number of Students Referred
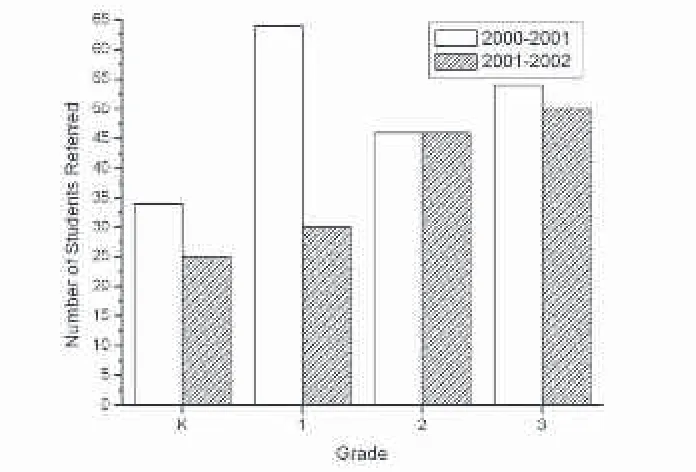
In kindergarten and grades 1 and 3, there were relative reductions in the number of students referred during the implementation year (–26.5%, –51.6%, and –7.4% respectively). Grade 2 experienced no change in the number of students referred during both years. It is interesting to note that whereas fewer students in grade 3 were referred during the implementation year (–7.4%), the number of office referrals during the implementation year increased (+7.6%, see Figure 3).
Standardized Test Scores
implemen-tation year than corresponding percentages across the previous three years. Before rising to higher levels in 2002, reading test pass rates were on a downward trend, and composite test pass rates had reached a plateau. Math test pass rates, however, seemed already to be on an upward trend. Also interesting to note is that there appears to be less variance between these three percentages during the implementation year compared with the previous three years (see Figure 4).
Discussion
The study is consistent with similar studies in reporting a reduction in office referrals. Specifically, the total number of referrals was reduced 18% during the year that the school-wide positive behavioral support program was imple-mented. In addition, during the implementation year, less volatility was seen in the behavioral data. That is, behavior was more stable with smaller extremes in terms of magnitude. In much of the data, similar increases and reductions
Table 2
Conduct Codes Ordered by Numerical Change in Frequency
Conduct Code 2000-2001 2001-2002 Numerical Percent Frequency Frequency Change Change
Violated established rules/procedures 394 260 –134 –34%
Assault of a student 15 39 +24 +160%
Disrespect: mild 70 48 –22 –31.4%
Failure to follow instruction 42 24 –18 –42.9%
Refusal to work/failure to comply 37 53 +16 +43.2%
Fighting with student 32 46 +14 +43.8%
Horseplay/scuffling 16 7 –9 –56.3%
Disruption of the education process 36 30 –6 –16.7%
Harassing/intimidating student 6 12 +6 +100%
Throwing object 5 0 –5 –100%
Insubordination/failure to comply 6 1 –5 –83.%
Rude/profane language toward student 8 4 –4 –50%
Robbery/theft/stealing 5 8 –3 +60%
Talking in class 5 2 –3 –60%
Disruptive behavior: gross 5 8 +3 +60%
Threat/incite threat of student 1 4 +3 +300%
Misbehaving 3 1 –2 –66.7%
Leaving class without authorization 2 0 –2 100%
Disrespect: mild 0 2 +2 N/A
Threat/incite threat of adult 1 3 +2 +200%
Cheating 2 4 +2 +100%
Leaving school without authorization 1 0 –1 –100%
False fire alarm 1 0 –1 –100%
Lunch violation 1 2 +1 +100%
Disruption outside of class 3 4 +1 +33.3%
Disruptive behavior: mild 8 9 +1 +12.5%
Possession of weapon defined in penal code 1 2 +1 +100%
Rude/profane language toward adult 0 1 +1 N/A
Retaliation: school employee 0 1 +1 N/A
Class disruption 2 2 0 0%
Assault of an adult 1 1 0 0%
Sexual harassment of student 1 1 0 0%
related to specific months of the school year were evident. Accordingly, the school-wide program may have been a factor in creating a more consistent and predictable school environment.
Figure 3. Number of students referred by grade.
Table 3
School Actions Ordered by Numerical Change in Frequency
School Action 2000-2001 2001-2002 Numerical Percent Frequency Frequency Change Change
Student conference 258 179 –79 –30.6%
Written warning/reprimand 106 52 –54 –50.9%
Withdrawal of privileges 100 138 +38 +38%
Time out 128 108 –20 –15.6%
Parent conference 31 48 +17 +54.8%
Verbal warning/reprimand 33 19 –14 –42.4%
Area cleanup 18 6 –12 –66.7%
Corporal punishment 5 0 –5 –100%
School detention 1 6 +5 +500%
Step program 2 0 –2 –100%
In-school suspension 2 0 –2 –100%
N/A 9 11 +2 +22.2%
Expulsion without placement 0 2 +2 N/A
Suspension 4 3 –1 –25%
Other 1 0 –1 –100%
Restitution of damages 1 0 –1 –100%
Alter education plan 3 4 +1 +33.3%
Reassigned to another class 1 2 +1 +100%
Suspension from bus 0 1 +1 N/A
Referred to counseling 1 1 0 0
The study corroborated similar studies by presenting data that indicate that students who did not demonstrate serious behavior problems benefited most from the program. Thus the study contributed to the emerging database that is showing that universal interventions can be successfully used with large groups of public school students (Sugai et al., 2000). In terms of office referrals, students who received one to four office referrals benefited most from the program (Sugai et al., 2000b). The group of students who benefited least from the program had 10 or more referrals. The behavior of these students, as is consistently reported in field literature, necessitates the use of individualized supports (Walker, Colvin, & Ramsey, 1995).
The study continued the line of research that supports the use of key essential features reported by Sprague et al. (2001). This allows for the com-parison of programs across settings. Accordingly, the study featured: (a) staff training, (b) clear behavioral expectations, (c) effective motivational systems, (d) monitoring systems, and (e) comparative behavioral data.
The study extends the literature in several ways. Specifically, due to the robust nature of the discipline referral data, much analysis was possible allow-ing comparison of large datasets. Thus the data in this study can potentially serve as a comparison point for similar studies in the future. Below we explore the top four conduct codes and consequences. An exploration of these high-fre-quency occurrences is significant to understanding the effect of the study.
Data for the study included more than 30 conduct codes representing the reason for the discipline referral (e.g., failure to follow instructions). As such, a careful examination of increases and reductions among these codes provides valuable information. In terms of numerical change in frequency, four codes demonstrated great variance. Problems associated with violations of estab-lished rules/procedures and mild disrespect dropped over 30% each. In
tion, the conduct code failure to follow instructions dropped over 40%. It is important to note that these conduct codes are directly related to the setting-specific procedures that were systematically taught school-wide during the weekly assemblies (i.e., “be respectful”).
The conduct code assault of a student rose 160% during the intervention year as indicated by 24 office referrals. It is important to note that students who are aggressive commonly exhibit chronic behavioral problems. School-wide posi-tive behavioral supports are based on a model of primary prevention (Lewis & Sugai, 1999). As such, they have not been shown to be a particularly effective intervention when working with aggressive students who need comprehen-sive individualized behavior management plans (Walker, Colvin, & Ramsey, 1995).
The consequences that administrators used when responding to referrals appear in Table 3. School actions are ordered by numerical change in frequen-cy. Accordingly, the top four in terms of change in frequency are of particular significance. Written warning/reprimand, student conferences, and time out showed significant reductions of over 50%, 30%, and 15% respectively. These codes relate directly to consistent instruction and review of desired behaviors in the educational environment. As such, setting-specific behaviors were sys-tematically taught throughout the intervention year. In addition, students who exhibited the clearly delineated behaviors related to being respectful and responsible participated in a comprehensive system of reinforcement. One of the four behaviors showing great variance increased significantly. Withdrawal of privileges rose almost 40% during the intervention year. Possibly this school action became a stronger deterrent to problematic behavior because the educa-tional environment was indicative of a school-wide system of reinforcement. Thus given this system-wide positive focus, withdrawal of a privilege may have been inherently more useful to administrators. This conduct code repre-sents a trend in that during the intervention year, administrators used less punitive approaches in dealing with office referrals.
As stated above, during the implementation year the number of office referrals dropped 18%. The study indicates variance across grade levels and little gender-related variance. Specifically, grade 1 showed the most benefit. Referrals for this group dropped over 40%. Conversely, grade 3 showed the least apparent benefit as referrals for this group increased almost 8%. It is interesting to note that although the number of referrals for grade 3 increased, the number of total grade 3 students who were referred decreased. Like grade 2, the group demonstrated fewer referrals with the same number of students being referred in both years. The number of referrals for both boys and girls decreased during the implementation year. The percentage reduction for both groups was similar although the size of the groups varied markedly (e.g., more boys were referred). Due to group size, boys benefited more than girls.
academic achievement tests administered to grade 3 is worth noting. Because only grade 3 was tested, generalization to other grades would be inap-propriate. On a related note, a study by Lassen, Steele, and Sailor (2006) reports a similar increase in math and reading scores following the implementation of SW-PBS.
Limitations
Although the implementation of PBS has been correlated with a reduction in referrals and an increase in academic achievement test scores, a number of limitations are worth noting. First, we cannot establish a direct functional relationship between the dependent and independent variables. In addition, a number of independent variables can be identified including instruction in setting-specific behaviors, individual reinforcement, intermittent reinforce-ment, and the systematic review of school-wide expectations. It is unclear what individual or collective combinations of these independent variables may have contributed to the results of the study. Second, students who were at risk of performing poorly on the TAAS were tutored. This individualized instruction may have influenced the rise in scores on academic achievement tests that were administered to grade 3, although group instruction previous years had no apparent positive effect. In addition, the program did not directly involve parents and/or members of the immediate community although parents were believed to be aware of the programming because the Bingo board was placed in a prominent location near the main office.
References
Artesani, A., & Mallar, L. (1998). Positive behavior supports in general education settings: Combining person-centered planning and functional analysis. Intervention in School and Clinic, 34(1), 33-38.
Bohanon, H., Fenning, P., Carney, K.L., Minnis-Kim, M.J., Anderson-Harriss, S., Moroz, K.B., et al. (2006). Schoolwide application of positive behavior support in an urban high school: A case study. Journal of Positive Behavior Interventions, 8, 131-145.
Chapman, D., & Hofweber, C. (2000). Effective behavior support in British Columbia. Journal of Positive Behavior Interventions, 2, 235-237.
Clark, S., Worcester, J., Dunlap, G., Murray, M., & Bradley-Klug, K. (2002). Using multiple measures to evaluate positive behavior support: A case example. Journal of Positive Behavior Interventions, 4, 131-145.
Colvin, G., & Fernandez, E. (2000). Sustaining effective behavior support systems in an elementary school. Journal of Positive Behavior Interventions, 2, 251-253.
Fern Ridge Middle School. (1999). The high five program: A positive approach to school discipline. Elmira, OR: Author.
Jenson, W.R., Rhode, G., & Reavis, H.K. (1997). The tough kid tool box. Longmont, CO: Sopris West. Lassen, S.R., Steele, M.M., & Sailor, W. (2006). The relationship of school-wide positive behavior
support to academic achievement in an urban middle school. Psychology in the Schools, 43, 701-712.
Lewis, T.J., & Sugai, G. (1999). Effective behavior support: A systems approach to proactive school-wide management. Focus on Exceptional Children, 31(6), 1-24.
Lewis, T.J., Sugai, G., & Colvin, G. (1998). Reducing problem behavior through a school-wide system of effective behavioral support: Investigation of a school-wide social skills training program and contextual interventions. School Psychology Review, 27(3), 446-460.
Lohrmann-O’Rourke, S., Knoster, T., Sabatine, K., Smith, D., Horvath, B., & Llewellyn, G. (2000). School-wide application of positive behavior support in the Bangor area school district.
Journal of Positive Behavioral Interventions, 2, 238-239.
Netzel, D.M., & Eber, L. (2003). Shifting from reactive to proactive discipline in an urban school district: A change of focus through PBIS implementation. Journal of Positive Behavior Interventions, 5, 71-79.
Sadler, C. (2000). Effective behavior support implementation at the district level: Tigard-Tualatin school district. Journal of Positive Behavior Interventions, 2, 241-243.
Scott, T.M. (2001). A schoolwide example of positive behavioral support. Journal of Positive Behavior Interventions, 3, 88-94.
Scott, T.M., & Hunter, J. (2001). Initiating schoolwide support systems: An administrator’s guide to the process. Beyond Behavior, 11(1), 13-19.
Sprague, J., Walker, H., Golly, A., White, K., Myers, D.R., & Shannon, T. (2001). Translating research in effective practice: The effects of a universal staff and student intervention on indicators of discipline and school safety. Education and Treatment of Children, 24, 495-511. Sugai, G., & Horner, R.R. (2006). A promising approach for expanding and sustaining
school-wide positive behavior support. School Psychology Review, 35, 245-259.
Sugai, G., Horner, R.H., Dunlap, G., Hieneman, M., Lewis, T.J., Nelson, et al. (2000a). Applying positive behavior support and functional behavioral assessment in schools. Journal of Positive Behavior Interventions, 2, 131-143.
Sugai, G., Sprague, J.R., Horner, R.H., & Walker, H.M. (2000b). Preventing school violence: The use of office discipline referrals to assess and monitor school-wide discipline interventions.
Journal of Emotional and Behavioral Disorders, 8(2), 94-101.
Taylor-Green, S.J., & Kartub, D.T. (2000). Durable implementation of school-wide behavior support: The high five program. Journal of Positive Behavior Interventions, 2, 233-235. Turnbull, A., Edmonson, H., Grigs, P., Wickham, D., Sailor, W., Freeman, R., et al. (2002). A
blueprint for schoolwide positive behavior support: Implementation of three components.
Exceptional Children, 68, 377-402.
Walker, H.M., Colvin, G., & Ramsey, E. (1995). Antisocial behavior in school: Strategies and best practices. Pacific Grove, CA: Brooks/Cole.
Warger, C. (1999). Positive behavior support and functional assessment. Washington, DC: Special Education Programs (ED/OSERS). (ERIC Document Reproduction Service No. ED434437) Warren, J.S., Edmonson, H.M., Griggs, P., Lassen, S.R., McCart, A., Turnbull, A., et al. (2003).