Abstract—Body mass index (BMI) is one of the different ways to monitor the health of a person. It is based on the height and weight of the person. This study aims to compute for the BMI using an Android tablet by obtaining the height of the person by using a camera and measuring the weight of the person by using a weighing scale or load cell. The height of the person was estimated by applying background subtraction to the image captured and applying different processes such as getting the vanishing point and applying Artificial Neural Network. The weight was measured by using Wheatstone bridge load cell configuration and sending the value to the computer by using Gizduino microcontroller and Bluetooth technology after the amplification using AD623 instrumentation amplifier. The application will process the images and read the measured values and show the BMI of the person. The study met all the objectives needed and further studies will be needed to improve the design project.
Index Terms—Artificial neural network, bluetooth, body mass index, vanishing point, wheatstone bridge load cell.
I. INTRODUCTION
Health consciousness is becoming a factor and important part of the Filipino consumers’ life and starts preferring herbal or traditional products, invests in preventive medication and starts participating in sports activities as stated by the report by the Euromonitor International (2013). With the increasing number of health conscious Filipinos, different center for health and gym for fitness are becoming popular, even home-based body workout. There are different ways on monitoring the health and body composition of a person for their fitness which includes the Body Mass Index (BMI).
Body mass index (BMI) is a measurement of the body fat level among people. It is computed using the height and weight of a person and is related to the age of the person. BMI determines the distribution of the mass of the person with its height. There are several categories that a person could fall into base on the value of their BMI including underweight, normal weight, overweight and obesity. The increasing demands on the health conscious Filipinos resulted to the automation of different techniques in monitoring the body fat level through the computation of
Manuscript received November 14, 2014; revised April 20, 2015. This work was supported in part by the Department of Science and Technology – Engineering Research and Development for Technology (DOST – ERDT).
The authors are with the Department of Electrical, Electronics, and Computer Engineering, Mapua Institute of Technology, Intramuros, Manila, Philippines (e-mail: [email protected], [email protected]).
BMI.
The weight of the person can be obtained by using a weighing scale with load cells that were configured to Wheatstone bridge. Load cells can be applied as a sensor for measuring the weight of different objects [1]. Load cells are usually used for weight measurement for food, vehicles and animals [2].
The height of the person can be computed using the camera of an Android tablet and image processing. The person or the foreground object can be extracted by removing the unwanted region or the background [3] and it is called background subtraction. Background subtraction can be implemented by using artificial neural network (ANN) for self-organizing image processing to detect objects in a scene [4]. The height of the person in the image (in pixels) can be related to its height in the real world (in meters) by getting the vanishing point of the image [5].
II. METHODOLOGY
This part of the study shows the procedure of measuring the parameters needed to determine the Body Mass Index (BMI) of a person.
Weighing scale/ Load cells
Gizduino Microcontroller Instrumentation
Amplifier
Bluetooth
Android Tablet Built-in Camera
Android App
Fig. 1. Block diagram of the system.
Application of Artificial Neural Network and Background
Subtraction for Determining Body Mass Index (BMI) in
Android Devices Using Bluetooth
Neil Erick Q. Madariaga and Noel B. Linsangan
Fig. 1 shows the block diagram for the whole system. The diagram shows the two inputs necessary for the system, the weighing scale and the built-in camera of the Android Tablet. The Android App processes data images and the reading from the load cell to compute the BMI of the person.
A. Weight Computation
In this part of the process, the weight of the person will be computed. Fig. 2 shows the block diagram for obtaining the weight of the person.
Load Cells Instrumental
Amplifier Microcontroller Bluetooth Module
Fig. 2. Weight computation block diagram.
Wheatstone bridge load cell configuration comprises of four (4) load cells. The configuration requires positive and negative excitation voltages and produces positive and negative sense values. An instrumentation amplifier, AD623, was used to get the differential voltage of the sense values and amplifies for the microcontroller to read. The read value will be converted into its equivalent weight by equating the slopes of two points. The plot of the values obtained using a weight measuring device was linear [1]. Equation (1) can be used to get the equivalent weight of the read value.
( )( )
)
x A B A
x A
B A
Vout Vout L L
L L
Vout Vout
(1)
Start
Get image
Display vanishing point Apply GaussianBlur
Apply Canny edge detect
Get slant lines using HoughLine
Get point of intersection
Stop
Fig. 3. Vanishing point determination flow chart.
where LA and LB are the known loads in kg and VoutA and
VoutB are the equivalent voltages of LAand LBin volts. Voutx is the output voltage of the weighing person and Lx is the weight of the person. The computed weight will be sent to the Android tablet via Bluetooth.
B. Vanishing Point and Camera Height
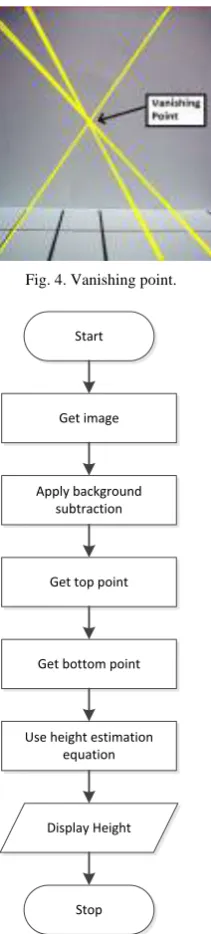
In order to determine the relationship between the real world and the image, the vanishing point must be determined. Fig. 3 shows the flow chart in getting the vanishing point. The vanishing point was determined by getting the intersection of the slant lines in the image. These slant lines were all parallel lines in the real world. The intersection of these slant lines would serve as the height in the image where the camera was supposed to be positioned. Applying Gaussian blur in the image would reduce the small details in the image which means that the small lines are removed. The canny method would generate all the lines from the blurred image. Using the Hough Line transformation, all the points of the lines in the blurred image would be extracted and saved in a vector. The extracted lines were reduced into only slant lines by getting the slopes of the lines. The point of intersection of all the lines will serve as the vanishing point.
Fig. 4 shows the representation of vanishing point in an image. The image has several parallel lines on the ground and the camera captured these lines as slant lines in the image.
Fig. 4. Vanishing point.
Start
Get image
Display Height Apply background
subtraction
Get top point
Get bottom point
Use height estimation equation
Stop
The camera height can be determined by using an object with known height and the vanishing point. The camera height can be computed by manipulating (2).
o inmecers
o inmecers i inmecers vp bp
h
h
h
Y
Y
(2)where hois the actual height, hcis the camera height, hi is the height of the person in the image, yvpis the y-coordinate of the vanishing point in the image and ybp is the y-coordinate of the base point of the object in the image [5].
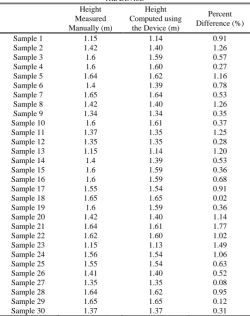
C. Height Estimation
Fig. 5 shows the flow chart for height estimation. The height estimation includes the background subtraction using the Artificial Neural Network (ANN) and determining the height of the foreground image. The vanishing point and the camera height will be used to get the actual height of the person.
The height of the person can be computed using (2).
Fig. 6 shows the detection of the person from a background model. The line on the bottom shows the base point of the object and the difference between the top line and bottom line gives the height of the object in the image. The top line is based on the improved binary image which was the result of the background subtraction and the top most pixel was detected. The binary image was improved by eroding the image to remove the unnecessary pixels. The bottom line was detected by searching for the horizontal line on the pattern on the floor. The difference the y-coordinate of the top and bottom line is the height of the person in the image.
D. Body Mass Index (BMI)
The BMI was computed using (3) and its category was based on the standard BMI table by the World Health Organization (WHO).
2
BMI =
W
H
(3) where W is the weight in kilograms, H is the height in meters and the BMI is the Body Mass Index in kg/m2.The data obtained using the weight measurement and height estimation procedures were used to calculate the BMI of the person.
III. RESULTS AND DISCUSSION
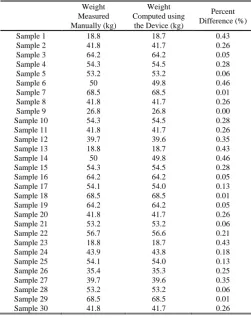
Height Measured Manually (m)
Height Computed using
the Device (m)
Percent Difference (%)
Sample 1 1.15 1.14 0.91
Sample 2 1.42 1.40 1.26
Sample 3 1.6 1.59 0.57
Sample 4 1.6 1.60 0.27
Sample 5 1.64 1.62 1.16
Sample 6 1.4 1.39 0.78
Sample 7 1.65 1.64 0.53
Sample 8 1.42 1.40 1.26
Sample 9 1.34 1.34 0.35
Sample 10 1.6 1.61 0.37
Sample 11 1.37 1.35 1.25
Sample 12 1.35 1.35 0.28
Sample 13 1.15 1.14 1.20
Sample 14 1.4 1.39 0.53
Sample 15 1.6 1.59 0.36
Sample 16 1.6 1.59 0.68
Sample 17 1.55 1.54 0.91
Sample 18 1.65 1.65 0.02
Sample 19 1.6 1.59 0.36
Sample 20 1.42 1.40 1.14
Sample 21 1.64 1.61 1.77
Sample 22 1.62 1.60 1.02
Sample 23 1.15 1.13 1.49
Sample 24 1.56 1.54 1.06
Sample 25 1.55 1.54 0.63
Sample 26 1.41 1.40 0.52
Sample 27 1.35 1.35 0.08
Sample 28 1.64 1.62 0.95
Sample 29 1.65 1.65 0.12
Sample 30 1.37 1.37 0.31
Table I shows that actual and computed height of the person as well as the error percentage from the obtain results. As observed from the table, the percent difference for each sample is very small. The greatest percent different was 1.77% which is very small. With the percent difference obtained, it can be said that the actual height and the computed height from the study is almost similar.
Furthermore, t-test was used to determine if there were significant differences between the values. The values that will be compared are the actual height and computed height using the proposed device. Since the calculated t-value, 0.2462, was less than the p-value, 2.02, and the p-value, 0.8064, was greater than the alpha, 0.05, then, there was no sufficient evidence to reject the null hypothesis. This means that the height from the actual and computed measurements have no significant difference.
The errors are from the inaccurate positioning of the camera as well as the unnecessary inclusion hair in the height measurement. The camera must be position perpendicular to the ground.
Fig. 6. Height estimation.
This part of the study is for the analysis of the data gathered used for computing the BMI of a person. The data were obtained using the weight measurement and height estimation procedures discussed.
For the following data, the computed vanishing point by getting the intersection of the lines was 310.4087 px and the camera height obtained, following (2), was 0.42 m using a 0.335 m object as basis.
TABLEII:WEIGHT MEASURED MANUALLY VS. WEIGHT COMPUTED USING THE DEVICE
Weight Measured Manually (kg)
Weight Computed using
the Device (kg)
Percent Difference (%)
Sample 1 18.8 18.7 0.43
Sample 2 41.8 41.7 0.26
Sample 3 64.2 64.2 0.05
Sample 4 54.3 54.5 0.28
Sample 5 53.2 53.2 0.06
Sample 6 50 49.8 0.46
Sample 7 68.5 68.5 0.01
Sample 8 41.8 41.7 0.26
Sample 9 26.8 26.8 0.00
Sample 10 54.3 54.5 0.28
Sample 11 41.8 41.7 0.26
Sample 12 39.7 39.6 0.35
Sample 13 18.8 18.7 0.43
Sample 14 50 49.8 0.46
Sample 15 54.3 54.5 0.28
Sample 16 64.2 64.2 0.05
Sample 17 54.1 54.0 0.13
Sample 18 68.5 68.5 0.01
Sample 19 64.2 64.2 0.05
Sample 20 41.8 41.7 0.26
Sample 21 53.2 53.2 0.06
Sample 22 56.7 56.6 0.21
Sample 23 18.8 18.7 0.43
Sample 24 43.9 43.8 0.18
Sample 25 54.1 54.0 0.13
Sample 26 35.4 35.3 0.25
Sample 27 39.7 39.6 0.35
Sample 28 53.2 53.2 0.06
Sample 29 68.5 68.5 0.01
Sample 30 41.8 41.7 0.26
TABLEIII:BODY MASS INDEX (BMI)COMPUTED MANUALLY VS .BODY
MASS INDEX (BMI)COMPUTED USING THE DEVICE
BMI Computed Manually
(kg/m2)
BMI Computed using the Device
(kg/m2)
Percent Difference (%)
Sample 1 14.22 14.41 1.39
Sample 2 20.73 21.20 2.25
Sample 3 25.08 25.38 1.20
Sample 4 21.21 21.16 0.26
Sample 5 19.78 20.23 2.26
Sample 6 25.51 25.79 1.09
Sample 7 25.16 25.42 1.04
Sample 8 20.73 21.20 2.25
Sample 9 14.93 15.03 0.70
Sample 10 21.21 21.11 0.47
Sample 11 22.27 22.77 2.24
Sample 12 21.78 21.83 0.20
Sample 13 14.22 14.50 1.97
Sample 14 25.51 25.67 0.61
Sample 15 21.21 21.42 1.00
Sample 16 25.08 25.43 1.41
Sample 17 22.52 22.90 1.70
Sample 18 25.16 25.16 0.02
Sample 19 25.08 25.27 0.77
Sample 20 20.73 21.15 2.01
Sample 21 19.78 20.48 3.49
Sample 22 21.60 22.00 1.83
Sample 23 14.22 14.58 2.56
Sample 24 18.04 18.39 1.93
Sample 25 22.52 22.77 1.12
Sample 26 17.81 17.95 0.79
Sample 27 21.78 21.74 0.20
Sample 28 19.78 20.15 1.84
Sample 29 25.16 25.22 0.22
Sample 30 22.27 22.35 0.35
Table II shows that actual and computed weight of the person as well as the error percentage from the obtain results. As observed from the table, the percent difference for each
sample is very small. The greatest percent different was 0.46% which is very small. With the percent difference obtained, it can be said that the actual weight and the computed weight from the study is almost similar.
Moreover, t-test was used to determine if there were significant differences between the values. The values that will be compared are the actual weight and computed weight using the proposed device. Since the calculated t-value, 0.0139, was less than the p-value, 2.02, and the p-value, 0.9890, was greater than the alpha, 0.05, then, there was no sufficient evidence to reject the null hypothesis. This means that the weight from the actual and computed measurements have no significant difference.
The error came from the inaccurate values of the calibration parameters.
TABLEIV:BMICATEGORY DETERMINED MANUALLY VS . BMICATEGORY
DETERMINED USING THE DEVICE
BMI Category Determined Manually BMI Category Determined using the Device Comparison
Sample 1 Underweight: Severe Thinness
Underweight:
Severe Thinness Similar
Sample 2 Normal Normal Similar
Sample 3 Overweight: Pre-obese
Overweight:
Pre-obese Similar
Sample 4 Normal Normal Similar
Sample 5 Normal Normal Similar
Sample 6 Overweight: Pre-obese
Overweight:
Pre-obese Similar
Sample 7 Overweight: Pre-obese
Overweight:
Pre-obese Similar
Sample 8 Normal Normal Similar
Sample 9 Underweight: Severe Thinness
Underweight:
Severe Thinness Similar
Sample 10 Normal Normal Similar
Sample 11 Normal Normal Similar
Sample 12 Normal Normal Similar
Sample 13 Underweight: Severe Thinness
Underweight:
Severe Thinness Similar
Sample 14 Overweight: Pre-obese
Overweight:
Pre-obese Similar
Sample 15 Normal Normal Similar
Sample 16 Overweight: Pre-obese
Overweight:
Pre-obese Similar
Sample 17 Normal Normal Similar
Sample 18 Overweight: Pre-obese
Overweight:
Pre-obese Similar
Sample 19 Overweight: Pre-obese
Overweight:
Pre-obese Similar
Sample 20 Normal Normal Similar
Sample 21 Normal Normal Similar
Sample 22 Normal Normal Similar
Sample 23 Underweight: Severe Thinness
Underweight:
Severe Thinness Similar
Sample 24 Underweight: Mild Thinness
Underweight: Mild
Thinness Similar
Sample 25 Normal Normal Similar
Sample 26 Underweight: Mild Thinness
Underweight: Mild
Thinness Similar
Sample 27 Normal Normal Similar
Sample 28 Normal Normal Similar
Sample 29 Overweight: Pre-obese
Overweight:
Pre-obese Similar
Sample 30 Normal Normal Similar
percent difference obtained, it can be said that the actual Body Mass Index (BMI) and the computed Body Mass Index (BMI) from the study is almost similar.
T-test was used to determine if there were significant differences between the values. The values that will be compared are the actual BMI and computed BMI using the proposed device. Since the calculated t-value, -0.2842, was less than the p-value, 2.02, and the p-value, 0.7774, was greater than the alpha, 0.05, then, there was no sufficient evidence to reject the null hypothesis. This means that the BMI from the actual and computed measurements have no significant difference.
The error came from the accumulated error from the height and weight.
Table IV shows the comparison between the categories of the BMI obtained from the manual and automated measurement. As observed from the table, the BMI categories from the actual and automated measurement of all the samples are all the same. This means that the automation is successful.
IV. CONCLUSION
As a result of this study, the Body Mass Index (BMI) of the person could be computed in an Android device using image processing and wireless weight measurement.
Using a camera, the images could be processed in order to identify the foreground object in the image by applying background subtraction. The background subtraction removed the background scene in the image. The vanishing point was an important factor in the process because it allowed the image to be related to the real world. Height estimation is better if higher pixel rating was used.
The weight of the person can be measured using load cell configured to a Wheatstone bridge. The force exerted to the load cells was converted into weak electrical signal and could be amplified using an instrumentation amplifier.
With proper calibration and amplification, the signal could be read by using a microcontroller. Wireless transmission was also possible by using wireless modules such as Bluetooth module configured to transmit data.
With the obtained data from different processes, the BMI and its classification could be identified by using the standard BMI formula and the standard BMI table.
ACKNOWLEDGMENT
The authors would like to thank the people who helped in
finishing the research especially those who helped in testing the system. We would also like to thank Department of Science and Technology – Engineering Research and Development for Technology (DOST – ERDT) for funding and providing the necessary materials for this research.
REFERENCES
[1] A. S. Prabuwono et al., “PC based weight scale system with load cell for product inspection,” in Proc. the International Conference on
Computer Engineering and Technology, 2009, vol. 1, pp. 343-346,.
[2] I. Muller et al., “Load cells in force sensing analysis-Theory and a novel application,” IEEE Instrumentation and Measurement Magazine, vol. 13, no. 1, pp. 15-19, 2010.
[3] A. J. Shelley and N. L. Seed, “Approaches to static background identification and removal,” in Proc. the IEE Colloquium on Image
Processing for Transport Applications, 1993, pp. 6/1-6/4.
[4] L. Maddalena and A. Petrosino, “A self-organizing approach to background subtraction for visual surveillance applications,” IEEE Transactions on Image Processing, vol. 17, no. 7, pp. 1168-1177, 2008.
[5] M. K. Momeni, S. C. Diamantas, F. Ruggiero, and B. Siciliano, “Height estimation from a single camera view,” in Proc. the International Conference on Computer Vision Theory and
Applications, 2012, pp. 358-364, vol. 1, Rome, Italy.
Neil Erick Q. Madariaga is a graduating student of the Computer Engineering (CpE) Department at Mapua Institute of Technology, Manila, Philippines. He is also currently pursuing his master’s degree in computer engineering (MSCOE) in the same Institute. He is expected to finish both degrees this coming February 2015.