Abstract— This paper develops a visual images insulator spark detection system (VIISDS) associated with logistic regression model to study the relationship between spark discharge and leakage current in transmission insulators. In this study, image processing technology which comprises images preprocessing, detecting and analyzing the spark characteristics is first applied to deal with visual images of sparks discharged on the surface of insulators captured by the developed remote monitoring system. The logistic regression model is then applied to establish a probability model that uses visual images as the determining factor for insulator cleaning (with early warning for leakage current) to identify the relationship between spark intensity and leakage current. The leakage current of insulators could be estimated according to spark intensity observed in the images, and no remote leakage current measuring device was required. This enabled the early warning of leakage current at varying levels and facilitated the development of an insulator maintenance mechanism for transmission lines that uses discharge images of insulators over traditional night-time observations.
Index Term— nsulator, leakage current prevision, logistic regression model, spark characteristic, spark intensity, transmission line tower.
I. INTRODUCTION
Iumid environments, salts pollution on the surface of insulators become moistened, which reduces the ionized insulation capability of soluble salts and increases leakage current, ultimately causing ground discharge, a phenomenon called ―pollution flashover‖ [1]–[4]. The leakage current of insulators is a byproduct of voltage, climate, and pollutants (salt deposit density) and can objectively reflect the process from pollution on the surface of operating insulators to pollution flashover.
To prevent salt pollution on suspended transmission lines from creating pollution flashover, electric power companies are suggested to perform regular or irregular transmission line maintenance to clean insulators in order to reduce leakage
This work was supported in part by the Taiwan Power Company , Taiwan, R.O.C. under project with TPC-546-4835-9901.
M.Y. Cho and P.S. Lin are with the Department of Electrical Engineering, National Kaohsiung University of Applied Sciences, Kaohsiung 807 Taiwan, R.O.C. (e-mail:[email protected] and [email protected]).
T.F. Lee is with the Department of Electronic Engineering, National Kaohsiung University of Applied Sciences, Kaohsiung 807 Taiwan, R.O.C. (e-mail: [email protected]).
C.H. Lee is with the Department of Systems and Naval Mechatronic Engineering, National Cheng Kung University, Tainan 701 Taiwan, R.O.C. (e-mail: [email protected]).
current and restore the insulation capability of insulators. The
most commonly adopted technique for measuring
contamination on the surface of insulators is the equivalent salt deposit density (ESDD) [5]–[7], for which the extent of salts pollution is determined and staff must be dispatched to actual transmission towers at night to observe, record, and analyze patterns and sounds of electrostatic discharge on the surface of insulators. The data are used to establish maintenance mechanisms for both live-line and offline insulator cleaning. However, night-time observations lead to differences in the assessment of the electrostatic discharge situation because the experience of the staff as well as the different observation distance. In addition, because electrostatic discharge on the surface of insulators occurs at random times, the precise time for observations is difficult to control.
Diagnostic tools [8] that can be used to identify the leakage current of insulators in live-line working environments have been proposed in related literature. Such tools are employed to monitor pollution found on the surface of insulators to improve maintenance efficiency. The literature indicates that the most common method for measuring leakage current is to use current transformers on transmission towers [9]–[12]. However, for online measurements, this method is prone to electromagnetic inferences produced by high-voltage transmission lines. Fontana [13] and Oliveira et al. [14] have proposed an optical detection method that eliminates such electromagnetic inferences in online-based measurements. Subsequent analyses are performed to determine the degree of pollution on the surface of the insulators and the possibility of flashover. However, currently, the optical detection sensor system lacks remote control capability.
Current maintenance mechanisms used by Taipower when engaging in live-line and offline insulator cleaning mainly involve measuring the ESDD of insulators and conducting observations at night. In this study, the transmission line and remote salt fog pollution monitoring system [15] designed, developed, and installed in two transmission towers located in key lines exposed to salt fog pollution in Yunlin County, Taiwan was used. This system combined meteorological data with insulator leakage current data or spark discharge images collected through automatic monitoring. The highlight of this study was that spark discharge images captured on the insulators in real time were incorporated into a proposed VIISDS suitable for insulator observations. This system substituted the traditional transmission line maintenance
Using Logistic Regression Model To Construct
Insulator Spark Detection System
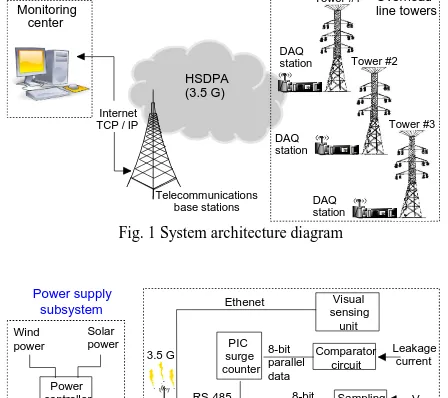
method that requires maintenance staff to conduct night-time observations. The proposed system as shown in Fig. 1 is dedicated to the real-time remote continuous detection and monitoring of spark discharge on insulator strings associated with the leakage current. It comprises data acquisition stations to acquire the online spark discharge data with a visual sensing unit, and HSDPA (high-speed downlink packet access) to maximize downlink-intensive services and deliver the captured data of spark discharges in a mobile way.
II. DESIGN OF THE VIISDS
A. System Architecture
As shown in Fig. 2 [15], the image capture device installed at the front-end data collection point of the remote monitoring system developed in this study was used to capture close-up images of the insulators over an extended period of time. The images were sent, along with meteorological and insulator leakage current data, to an advanced ARM9 microprocessor embedded system via a general packet radio service (3.5G) wireless communication network, where the data are then sent back to the back-end monitoring center.
Tower #1 Telecommunications base stations Overhead line towers Tower #2 Tower #3 HSDPA (3.5 G) Internet TCP / IP Monitoring center DAQ station DAQ station DAQ station
Fig. 1 System architecture diagram
Power supply subsystem Power controller Deep cycle batteries DAQ subsystem 3.5 G Ethenet ARM9/x86 PIC surge counter RS-485 PIC core processor PLC analog module Sampling circuit Comparator circuit 8-bit parallel data Leakage current V Enviromental factors R S -4 8 5 RS-485 Wind power Solar power Visual sensing unit I 8-bit parallel data
Fig. 2 System function block
The VIISDS was introduced as the processing architecture in this study, as shown in Fig. 3. In the system, the core design involved preprocessing insulator images, detecting and analyzing insulator spark characteristics, and developing a probability model for insulator cleaning. Research and analysis were performed according to this processing architecture. The insulator image preprocessing process involved capturing images and filtering image noise (i.e., adjusting image brightness and contrast and using an image Gaussian smoothing filter). The insulator spark characteristics detection and analysis process involved the detection of spark
characteristics, analysis and tallying of the regions of interest (ROI), and spark intensity computation. The insulator cleaning probability model was developed using the logistic curve fitting model as well as performing model accuracy and leakage current assessments.
B. Insulator Image Preprocessing Process
1) Image Capture and Color Space Conversion: An image capture device was first installed on a transmission tower. The camera lens of the device was then adjusted to be in focus and facing the insulators to enable observations and video capture. The NTSC/PAL videos were transferred from the video capture device and compressed into MPEG format by using image compression technology. The dynamic videos were converted into static images, and those with spark discharge were collected as samples for subsequent analysis.
Analyzing the sample images by employing the computer RGB color model requires that the three light beams (one red, one green, and one blue) be processed first. To simplify the operation and reduce the size of the information to be processed, the image was preprocessed using color space conversion first, in which the RGB colors of the images were converted into a YCbCr-based color space by using (1), and luminance (component Y) was used for analysis to identify intense light or sparks. 128 128 0 08 . 0 42 . 0 50 . 0 50 . 0 33 . 0 17 . 0 11 . 0 59 . 0 30 . 0 B G R r C b C Y (1)
2) Filtering Noise of Images: This study applied a filtering method in which background noise did not need to be filtered. Image brightness and contrast were adjusted and noise was filtered using a Gaussian smoothing filter to ensure that the insulator image quality was sufficient for identifying spark characteristics. Detailed descriptions are provided as follows:
a) Adjust image brightness and contrast to obtain spark characteristics: An examination of the sample insulator images captured in this study showed traces of white noise contamination on all the images. Such noise had to be suppressed or eliminated to reduce errors when detecting sparks on the surface of insulators. Noise could be removed and images could be enhanced by adjusting the contrast of night-time images. In this study, the image contrast was set at 100.0. Fig. 4 shows the before and after images after image contrast was adjusted.
Before After
b) Using a Gaussian smoothing filter for image processing: In the field of image processing, linear filters can be adopted to smooth images [16], [17]. A Gaussian filter is a type of linear filter typically used to reduce or eliminate white Gaussian noise found in images and employs a filtering technique called Gaussian blur [18]. Fig. 5 shows the use of a 5 × 5 discrete Gaussian smoothing filter by the VIISDS to perform sequential Gaussian smoothing on the luminance values of the images to reduce the white Gaussian noise that may exist.
Fig. 5. Processing architecture of the Gaussian smoothing filter when processing insulator images.
According to (2), a 5 × 5 discrete Gaussian smoothing filter was developed using a Gaussian coefficient (σ) of 1.0 [19]. The images were masked using a 25-pixel wide square before (3) was used to perform weighted calculations to determine the luminance values of the pixels in the masked areas and to smooth the sharpened images.
1 4 7 4 1
4 1 6 2 6 1 6 4
7 2 6 4 1 2 6 7
4 1 6 2 6 1 6 4
1 4 7 4 1
5 5 ... 5 1
: :
1 5 ... 1 2
P P
P P
(2)
273
55 55 ... 12 12 11 11 33
Y P P
Y P Y Y
(3)
C. DETECTING AND ANALYZING SPARKS IN THE INSULATOR IMAGES
1) Region of Interest Analysis: The ROI in insulator images was used to analyze the target objects located in the image. Only pixels in these regions were analyzed. Contrary to global analyses of images, the ROI analysis reduced potential biases and misjudgments created by computation analyses conducted for invalid regions. An appropriate ROI mask range
provides a highly accurate detection of spark characteristics, thereby preventing system resource waste.
In this study, day-time images of the insulators were observed before four corresponding coordinates [(130, 130), (221, 55), (495, 350), and (402, 435)] were made as the ROI for analysis. The masked region, measured 4993 in area, is shown in white in Fig. 6.
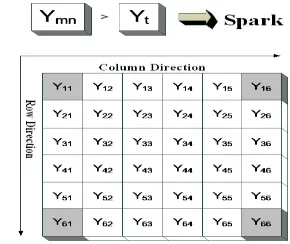
2) Detecting the Spark Characteristics on the Surface of Insulators: As shown in Fig. 7, the threshold value (Yt) used for detecting the spark characteristics observed in the images was set as 150 (the value was set according to the level of sensitivity desired from the early warning system to bright spots). Subsequently, a pixel spacing of 5 was employed to compare Yt
with the luminance value Ymn (where m and n are the row and column of the image, respectively) of the pixels in the ROIs. During the detection process, pixels with a luminance value higher than the threshold value were considered to exhibit spark characteristics, and subsequent analyses were performed to determine the discharge spark rate and discharge spark intensity. When the luminance value of the pixels was less than the threshold value, the detection process would be repeated. If no pixel in the ROIs showed a luminance value higher than Yt, the image would be considered to exhibit no spark characteristics. The image would subsequently be discarded, and the image capture process would begin once again.
3) Analyzing the Discharge Spark Rate and Discharge Spark Intensity on the Surface of Insulators: After the contrast of the spark images was adjusted, a program was used to calculate the number of pixels contained in the images for the different ranges (e.g., 0–30 and 31–60). Using 60 as the threshold value for luminance detection produced spark data Fig. 7. Schematic diagram illustrating the detection of spark characteristics in
insulator images
Image processed using Mask used for ROI analysis Gaussian smoothing
(i.e., the number (area) of sparks) that were relatively more suitable for analyses. During the analysis process, pixels (Ymn) with a luminance value higher than the threshold value were labeled bright spots; otherwise, they were labeled dark spots. Each bright spot represented the bright spot area for each unit. Image observations showed that, for preprocessed images exhibiting spark characteristics, changes in luminance were conspicuous and that the dark regions on the images displayed a luminance value less than or equal to 60.
By calculating the data from the sample images, the maximum number (area) of pixels with bright spots in the ROI was determined to be 9533, which approached 10000. Therefore, when the leakage current condition of the insulators was 10 000 mA, the maximum bright spot area was expected to be less than or equal to 10000. By taking the min (10000, 49443) and using (4) and (5), the discharge spark rate and discharge spark intensity on the surface of the insulators were calculated. Using the image shown in Fig. 6 as an example, the results from the insulator image analysis are shown in Table I.
Insulator discharge spark rate =
number (area) of bright spots / expected maximum number of sparks for insulators with a leakage current of 10,000 mA
(4)
nsulator discharge spark intensity =
sum of the luminance of all the bright spots found on the surface of insulators / expected maximum number of sparks for insulators with a leakage current of 10,000 mA
(5)
III. DEVELOPINGAPROBABILITYMODELFOR
INSULATORCLEANING
A. LOGISTIC REGRESSION MODEL CURVE FITTING
In 1994, Berkson [20] proposed the logistic regression model, which is used for statistical analysis. The logistic regression model assumes that the dependent and independent variables are continuous or binary, and the analysis results are presented in the form of a probability distribution. Using a simple logistic regression model produces an S-shaped curve, which is a polynomial for independent variables in the form of
f(x) = β0 + β1x. The probability for the dependent variables to occur (p) and the odds ratio (OR) are shown in (6) and (7).
) 1 0 ( 1
1
) 1 0 ( 1
) 1 0 (
) ( 1
) (
x e
x e
x e
x f e
x f e p
f(x) = β0 + β1x
(6)
x p
p OR
1 0 1
ln
(7)
where x is the independent variable, β1 is the independent variable coefficient, and β0 is a constant.
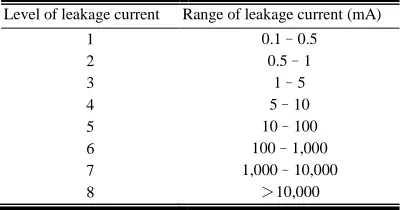
In [15], leakage currents of ceramic-based insulators were divided into eight levels, which represented the varying degrees of deterioration, as shown in Table II. For the 10 000 mA insulator used in this study (levels 69 kV with PRTV-B30), the maximum expected bright spot area was approximately 10 000. The discharge spark rate calculated using (4) was approximately 7.596 times higher than that obtained in [15], which was suitable for the PRTV-B30-type maintenance mechanism used in this study, as shown in Table III. This study subsequently established logistic regression models for leakage currents categorized as Levels 3 (1 mA), 6 (100 mA), and 8 (10,000 mA). The discharge spark rates corresponding to the leakage currents (i.e., 5.191%, 25.065%, and 37.978%) were set as the threshold values, and a sample of 657 visual images that exhibited discharge spark characteristics were analyzed.
Images with a discharge spark rate higher than or equal to (less than) the threshold value signified the need (no need) for insulator cleaning.
TABLE I
RESULTS FROM THE ANALYSIS OF SPARK CHARACTERISTICS FOUND ON INSULATOR IMAGES
Items for the spark characteristic analysis Image from Fig. 6 - Number (area) of pixels with bright spots 3,306 - (Area of) bright spots/dark spots in the
pixels 6,694
- Expected maximum number of bright spots for insulators with a leakage current of 10,000 mA
10,000
- ROI area 49,443
- Insulator discharge spark rate 33.060 - Insulator discharge spark intensity 65.773
TABLE II
THE DIFFERENT LEVELS OF INSULATOR LEAKAGE CURRENT Level of leakage current Range of leakage current (mA)
1 0.1–0.5
2 0.5–1
3 1–5
4 5–10
5 10–100
6 100–1,000
7 1,000–10,000
8 >10,000
Scenarios in which the leakage current was < 0.1 mA were disregarded.
TABLE III
MAINTENANCE MECHANISM FOR 69-KV PRTV-B30 INSULATOR Insulator\cleaning option Level of leakage
current
Discharge spark rate (%)
B. Evaluating Model Accuracy
In this study, a binary logistic regression model was employed to estimate the luminance value when the logistic regression coefficients (β0, β1) of the three leakage current levels (i.e., 1, 100, and 10,000 mA) and the cutoff point equaled 0.5. The three luminance values were used as the correlation coefficients in the conversion calculation between spark intensity and the three leakage current models. Regarding tests performed on the three leakage current models, the Omnibus test [21], [22] was used to test the overall patterns of the models; the Cox and Snell R2 [23] and Nagelkerke R2 [24] tests were performed to test the correlation between the independent and dependent variables of the models; and the Hosmer–Lemeshow test [25] was used to determine whether the models demonstrated favorable goodness of fit and to assess the effect of logistic regression coefficients on classification accuracy. To verify the accuracy of the models, Hanley [26] proposed the use of area under the receiver operating characteristic curve (AUC) to evaluate the accuracy of a model. Therefore, in this study, the AUC was adopted to assess the classification accuracy of the insulator cleaning probability model. AUC values and their definitions [27] are provided in Table IV.
C. Assessments of the Leakage Current of Insulators
Three logistic regression models were developed to analyze the effect that the amount of leakage current required to trigger early warning exerted on insulator cleaning probability. The amounts were set at 1, 100, and 10,000 mA. Through the S-shape curve of each model, the insulator luminance value when the cutoff point equaled 0.5 was obtained. Subsequently, the leakage current conversion parameters for the system were obtained by calculating the correlation between the amounts of leakage current (i.e., 1, 100, and 10,000 mA) and the luminance values.
IV. TEST RESULTS AND DISCUSSION
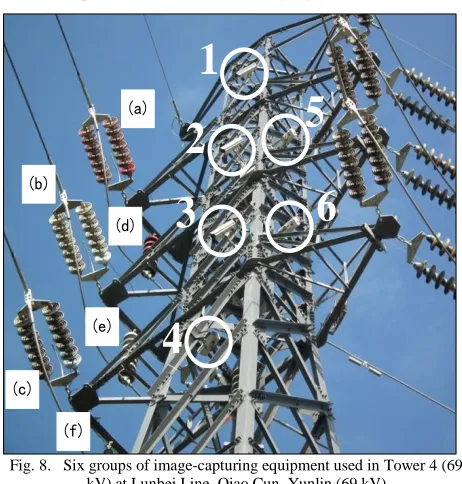
A remote monitoring system [15] was installed on a transmission tower (Tower 4 at Lunbei Line, Qiao Cun) located in a key line exposed to salt fog pollution in Yunlin County, Taiwan. Fig. 8 shows the group of devices used to capture the insulator images. The circled areas mark the location of the image capture devices, the IP cameras, and the squared areas mark the different insulator types:
1. Responsible for recording the ceramic-based B25 insulator coated with PRTV in (a).
2. Responsible for recording the ceramic-based B25 insulator coated with HVIC in (b).
3. Responsible for recording the ceramic-based B25 insulator coated with silicon paste in (c).
4. Responsible for recording the polymer-based insulator in (d). 5. Responsible for recording the ceramic-based B30 insulator
coated with PRTV in (e).
6. Responsible for recording the ceramic-based B30 insulator coated with HVIC in (f).
(a)Line 1: Ceramic-based B25 insulator coated with PRTV (suspended).
(b) Line 2: Ceramic-based B25 insulator coated with HVIC (suspended).
(c) Line 3: Ceramic-based B25 insulator coated with silicon paste (suspended).
(d)Line 1: Ceramic-based B25 insulator coated with PRTV (hanging).
(e)Line 2: Ceramic-based B25 insulator coated with HVIC (hanging).
(f)Line 3: polymeric insulator (hanging).
A total of 657 visual image samples that exhibited discharge spark characteristics were captured from the PRTV-B30 location. The results of analysis are presented as follows:
A. Developing an Insulator Cleaning Probability Model By Using Logistic Curve Fitting
Discharge spark rates corresponding to the three levels of leakage current (i.e., 1, 100, and 10 000 mA) were set as the threshold values (5.191%, 25.065%, and 37.978%). The threshold values were used to analyze the 657 insulator images to determine whether early warning levels for leakage current need to be classified, as shown in Table V. Contrary to [15], which described only the relationship between discharge spark rates and the three leakage current levels, this study applied the relationship between discharge spark rates and discharge spark intensity to indirectly derive the relationship between discharge
(a) (b)
(d) (e) (c)
(f)
6
5
1
2
3
4
Fig. 8. Six groups of image-capturing equipment used in Tower 4 (69 kV) at Lunbei Line, Qiao Cun, Yunlin (69 kV)
TABLE IV
THE DIFFERENT LEVELS OF INSULATOR LEAKAGE CURRENT
AUC value Definition
AUC = 0.5 Close to zero accuracy (similar to random guesses)
0.7≦AUC < 0.8 Acceptable 0.8≦AUC < 0.9 Satisfactory
AUC≧0.9 Excellent
spark intensity and leakage current levels. The greater the leakage current is, the brighter the sparks become. This study considered discharge spark intensity to be critical because even two images with identical discharge spark rates (i.e., the number of bright spots in the ROI is identical) produce different spark intensities when the sum of the luminance values (from the bright spots) differs, leading to varying leakage current. Therefore, in this study, leakage current was assessed by calculating the spark intensity instead.
The classification results and the spark intensity obtained by analyzing the images were used in the logistic regression model. The logistic regression model is shown in (6), where x
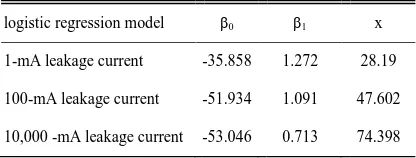
represents luminance and p represents the effect of luminance on whether to initiate early warning for leakage current (and to perform subsequent insulator cleaning). The results were obtained using logistic curve fitting. Table VI shows the logistic regression coefficients (β0, β1) of the three leakage current levels and the luminance value when the cutoff point equaled 0.5. To test whether the parameters of the three logistic regression model were appropriate, related tests and analyses were conducted for the three groups of logistic curve fitting data, as shown in the subsequent paragraph.
Regarding the overall tests performed on the three leakage current models (as shown in Table VII), the chi-square test of independence obtained using the Omnibus test showed values of 815.823, 530.02, and 197.052. The degree of freedom equaled 1, and the p value was less than 0.001 (p < 0.05), indicating that the independent variable (i.e., luminance) could effectively explain the dependent variable (i.e., the degree of influence that luminance has on insulator cleaning).
The logistic regression results for the three leakage current models obtained using the Cox and Snell R2 and Nagelkerke R2
tests were 0.711, 0.554, and 0.259 and 0.951, 0.965, and 0.963,
respectively. All of the results were higher than the significance level of .15, indicating a high degree of correlation between the independent variable and dependent variable and that the models exhibited a favorable goodness of fit.
The Hosmer–Lemeshow test was performed to determine the overall goodness of fit of the three leakage current models. The results showed a p value of 0.997, 0.999, and 0.999, none of which achieved the significance level of .05, indicating that the three models demonstrated favorable goodness of fit in the logistic regression model and that the independent variable could effectively predict the dependent variable.
B. AUC Accuracy Assessment
Fig. 9 shows the AUC results of the three leakage current levels obtained using the logistic regression model, which were 0.997, 0.999, and 0.999. The results were all higher than the area under the random guess probability curve of 0.5, indicating that the AUC model featured high prediction accuracy.
C. Leakage Current Assessment
Table VI shows that substituting the logistic curve fitting coefficients (β0, β1) obtained for the three leakage currents yields (8)–(10) as follows:
TABLE V
THE EFFECT OF INSULATOR SPARK INTENSITY ON WHETHER TO INITIATE EARLY WARNING FOR LEAKAGE CURRENT
Early warning for leakage
current Issue warning Number (%) Early warning for 1-mA
leakage current
Yes No
300(45.7) 357(54.3) Early warning for 100-mA
leakage current
Yes No
100(15.2) 557(84.8) Early warning for 10,000-mA
leakage current
Yes No
24(3.7) 633(96.3)
Fig. 9. ROC curve for leakage currents of 1, 100, and 10,000 mA. TABLE VII
RESULTS OF THE LOGISTIC REGRESSION MODEL ANALYSIS (LEAKAGE CURRENTS LEVELS OF 1, 100, AND 10,000 MA)
Items 1-mA leakage
current
100-mA leakage current
10,000- mA leakage current
Omnibus
χ2 = 815.823 df = 1 p < 0.001
χ2 = 530.02 df = 1 p < 0.001
χ2 = 197.052 df = 1 p <0.001
Cox & Snell R2 0.711 0.554 0.259
Nagelkerke R2 0.951 0.965 0.963
Hosmer-Lemeshow
χ2 = 1.192 df = 8 p = 0.997
χ2 = 0.036 df = 8 p > 0.999
χ2 = 0 df = 8 p > 0.999
Exp(B) 3.569 2.979 2.04
95% CI of Exp(B) 2.522–5.051 1.747–5.079 1.062–3.918
β0 and β1 are logistic regression model coefficients; p represents the effect that luminance exerted on whether to initiate early warning for leakage current; x is the luminance value when the cutoff point of p equaled 0.5.
TABLE VI
) 272 . 1 858 . 35 ( 1
1
i x e
i p
(8)
) 091 . 1 934 . 51 ( 1
1
i x e
i p
(9)
) 713 . 0 046 . 53 ( 1
1
i x e
i p
(10)
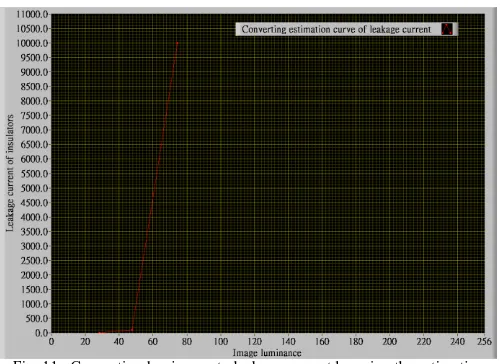
By using (8)–(10), the luminance values for the three leakage current levels (i.e., 1, 100, and 10,000 mA) when the cutoff point was 0.5 were calculated at 28.19, 47.602, and 74.398, respectively. After inputting the varied interval of luminance obtained from the digital images, the logistic regression curves for the three leakage current models are obtained in Fig. 10. The spark characteristic (i.e., luminance) and the change in the leakage current were positively correlated. The relationship between leakage current and changes in the luminance was calculated using the luminance values obtained at the cutoff points of the logistic regression model for the three leakage current levels, which produced the simple leakage current estimation curve shown in Fig. 11. For the leakage current estimation curve, an insulator image analysis program was used to convert (via a chart) luminance values to corresponding leakage current data. When the luminance of the images satisfied the early warning requirement for a leakage
current of 1 mA or higher, the luminance values were converted to corresponding leakage current data, which were then transferred to the back-end early warning system for leakage current to initiate early warning processing.
V. CONCLUSION
This paper has developed a probability model by using logistic regression analysis technology for identifying the leakage current of transmission insulators. The model applies the spark intensity of images for determining the probability of insulator cleaning (early warning of leakage current). This
model was developed by using visual images of sparks discharged on the surface of insulators that were captured using a remote monitoring system; preprocessing the images by employing image processing technology; and detecting and analyzing the spark characteristics. Therefore, the proposed method which monitored images of discharge on the surface of insulators can be established as a new maintenance mechanism for cleaning transmission lines as oppose to using the mechanism involving night-time observations. The conversion estimation curve of luminance and leakage current generated using the method proposed in this study yielded leakage current output values within a reasonable margin of error, revealing the effectiveness and practicality of the proposed method. Thus, engineers may use the leakage current values as indicators of insulator maintenance.
VI. ACKNOWLEDGMENT
The authors gratefully thank the department of power supply of Taipower for their assistance in providing the valuable data, on-site installation, and excellent discussion. The financial support of this work by Taipower is also greatly appreciated.
REFERENCES
[1] De La, A.; Gorur, R.S. ―Flashover of contaminated non-ceramic out-door insulators in a wet atmosphere, ‖ IEEE Trans. Dielectr. Electr. Insul., 5, pp. 814–823, 1998.
[2] R. J. Van Brunt, ―Physics and chemistry of partial discharge and corona—recent advances and future challenges,‖ IEEE Trans. Dielectr. Electr. Insul., vol. 1, no. 5, pp. 761–784, Oct. 1994.
[3] D. L. Williams et al., ―Formation and characterization of dry bands in clean fog on polluted insulators,‖ IEEE Trans. Dielectr. Electr. Insul., vol. 6, no. 5, pp. 724–731, Oct. 1999.
[4] G. Montoya, I. Ramirez, and J. I. Montoya, ―Correlation among ESDD, NSDD and leakage current in distribution insulators,‖ Proc. Inst. Elect. Eng., Gen., Transm. Distrib., vol. 151, no. 3, pp. 334–340, May 2004. [5] An, L.; Jiang, X.; Han, Z. Measurements of equivalent salt deposit density
(ESDD) on a suspension insulator. IEEE Trans. Dielectr. Electr. Insul., 9, pp. 562–568, 2002.
[6] G. Montoya, I. Ramirez, and J. I. Montoya, ―Correlation among ESDD,NSDD and leakage current in distribution insulators,‖ in Proc. Inst.Elect. Eng., Gen., Transm. Distrib., vol. 151, no. 3, pp.334–340, May 2004.
[7] H. Matsuo, T. Fujishima, and T. Yamashita, ―Relation between leakage impedance and equivalent salt deposit density on an insulator under a Fig. 10. Logistic regression curve for leakage currents of 1, 100, 10 000 mA.
saltwater spray,‖ IEEE Trans. Dielectr. Electr. Insul., vol. 6, no. 1, pp.117–121, Feb. 1999.
[8] J.L. Fierro-C havez , I. Ramirez-Vazquez , G. Montoya-Tena , ―On-line leakage current monitoring of 400 KV insulators strings in polluted areas,‖ IEE Proc.-Gener. Trans. Distrib., Vol. 143, No. 6,pp.560-564, Nov. 1996
[9] E. O. Abdelaziz et al., ―Prevention of the interruptions due to the phenomena of the electric insulators pollution,‖ in Proc. 1st Int. Symp. Control,Communications and Signal Processing, pp. 493–497, 2004. [10] T. Suda, ―Frequency characteristics of leakage current waveforms of a
string of suspension insulators,‖ IEEE Trans. Power Del., vol. 20, no.1, pp. 481–487, Jan. 2005.
[11] S. Shihab, V. Melik, L. Zhou, G. Melik, and N. Alame, ―On-line pollution leakage current monitoring system,‖ in Proc. IEEE Properties and Application of Dielectric Materials, pp. 538–541, Jul. 1994.
[12] S. Moorthy, S. Shihab, and X. Cheng, ―Practical on-line partial discharge measuring system for high voltage apparatus,‖ in Proc. IEEE Properties and Applications of Dielectric Materials, pp.586–589, Jul. 1994. [13] E. Fontana, S. C. Oliveira, F. J. M. M. Cavalcanti, R. B. Lima, J. F.
Martins-Filho, and E. Meneses-Pacheco, ―Novel sensor system for leakage current detection on insulator strings of overhead transmission lines,‖IEEE Trans. Power Del., vol. 21, No. 4, pp. 2064–2070, Oct. 2006. [14] S. C. Oliveira, E. Fontana, ―Optical Detection of Partial Discharges on Insulator Strings of High-Voltage Transmission Lines,‖ IEEE Trans. Instrumentation and Measurement, Vol. 58, No. 7, pp.2328-2334, Jul. 2009
[15] M. Y. Cho, T, F, Lee, W.Y. Chang, T. T. Liau, J.J. Liang, System establish and research of remote monitoring technology of transmission line in the polluted salt fogand climate, Final report, Taipower, 2013. [16] A. K. Jain, Fundamentals of digital image processing vol. 3: prentice-Hall
Englewood Cliffs, 1989.
[17] S. E. Umbaugh, Computer imaging: digital image analysis and processing: CRC Press, 2005.
[18] C.-Y. Yen, "Geometrically Invariant Watermarking Using Harris-Laplace Feature Point Detector," 2010.
[19] Y.-C. Chen, "A Comprehensive Motion Videotext," 2005.
[20] J. Berkson, "Application of the logistic function to bio-assay," Journal of the American Statistical Association, vol. 39, pp. 357-365, 1944. [21] Y.-f. Chang, "An Application of the Health Belief Model to Evaluate
Parents' Willingness to Participate in Elementary Schools’ Walking to School Policy in Tainan City, Taiwan," 2010.
[22] C.-c. Wu, "The thermal environment at the planting and pavement of a urban park in Tainan-analyze with infrared measurement," 2011. [23] D. R. Cox and E. J. Snell, Analysis of binary data vol. 32: Chapman &
Hall/CRC, 1989.
[24] N. J. Nagelkerke, "A note on a general definition of the coefficient of determination," Biometrika, vol. 78, pp. 691-692, 1991.
[25] D. W. Hosmer and S. Lemeshow, Applied logistic regression vol. 354: Wiley-Interscience, 2004.
[26] J. A. Hanley, "Characteristic (ROC) Curvel," Radiology, vol. 743, pp. 29-36, 1982.
[27] Y.-Y. Liu, "Improving the predict performance of logistic regression based on model parameters selection for the incidence of xerostomia after radiotherapy in nasopharyngeal carcinoma and head and neck squamous cell carcinoma," 2013.
Ming-Yuan Cho is with the Department of Electrical Engineering, National Kaohsiung University of Applied Sciences (KUAS), where he is currently a distinguished professor associated with the Dean of College of Electrical Engineering and Computer Science at KUAS. He has also served as the chairman of Department of Electrical Engineering at KUAS from August, 2000 to July, 2003. His research interests are smart grid, energy saving technologies and artificial intelligent algorithm for power system applications.
Pou-Sz Lin was born in Yunlin, Taiwan, on June 10, 1970. He obtained the M.S. degree in electrical engineering from National Taiwan University of Science and Tecnology in 1997. He is currently pursuing the Ph.D. degree at National Kaohsiung
University of Applied Sciences in Taiwan. His research interests are artificial intelligent algorithm and digital image processing tecnology for power system applications.
Chien-Hsing Lee (S’93–M’98–SM’06) was born in Pingtung, Taiwan, on June 13, 1967. He received the B.S. degree in electrical engineering from Arizona State University in 1993. Then, he obtained the M.S.E.E. and Ph.D. degrees from the Georgia Institute of Technology in 1995 and 1998, respectively. He is currently a professor at National Cheng Kung University in Taiwan. His research interests are power system modeling and analysis.