ISSN (Online) 2347-3207
Resolution of Ascorbic Acid in The Presence of Uric Acid
by The Montmorillonite K
10
-clay/SDS Modified Carbon
Paste Electrode
P. Jeevan Jyoti, K. Gangadhara Reddy, B. Sivananda Reddy,
Y.Veera Monahara Reddy, G. Madhavi
*Department of Chemistry, S.V.U. College of Sciences,
Sri Venkateswara University, Tirupati-517502, Andhra Pradesh, India.
Corresponding Author E-Mail: [email protected].
Corresponding Author, Tel.: +91-0877-2289303
Abstract:-
Montmorillonite K10-clay/SDS modified carbon paste electrode was developed for thesimultaneous detection of Ascorbic acid in the presence of Uric acid in 0.1 M phosphate buffer solution of pH 7.0. The modified electrode has exhibited a stable and sensitive current response towards the Ascorbic acid and was utilized for the simultaneous detection of Ascorbic acid and Uric acid. When compared with a bare CPE, the modified electrode exhibited a remarkable shift in the oxidation potentials of Ascorbic acid in the cathodic direction. The anodic peak potentials for the Ascorbic acid is 0.299 V in 0.1 M phosphate buffer solution (PBS) at pH 7.0, at modified carbon paste electrode, it was -0.020 V. The Montmorillonite K10-clay/SDS modified CPE was also effective for the simultaneous determination of
Ascorbic acid and Uric acid in a mixture and resolved the overlapping anodic peaks of these two species into two well defined voltammetry peaks in differential pulse voltammetry. The proposed method showed an excellent stability, reproducibility and is well suited for the analysis of real samples.
Keywords- Montmorillonite K
10-clay; Ascorbic acid; Uric acid; Cyclic voltammetry;
Differential pulse voltammetry.
I.
INTRODUCTION
Ascorbic acid, Uric acid and Dopamine are physiologically important components which are widely distributed in the body of many mammals and exhibits message transfer in the brain and defense against the disease among which the Ascorbic acid is a water soluble vitamin and also a compound which takes part in many important life processes. Due to its antioxidant and pH regulator properties, this vitamin is present or added to a variety of food products and pharmaceuticals. Ascorbic acid takes part in several biological reactions. It prevents and treats the scurvy, common cold, mental illness, infertility and cancer. Ascorbic acid plays a unique redox and electrochemical role [1]. Similarly Uric acid (2,6,8–trihydroxypurine, UA) also a major nitrogenous compound in urine, and also a product of purine metabolism in human body and its higher levels leads to many clinical disorders [2]. High levels of UA in the blood (hyperuricemia or Lesch-Nyhan syndrome) are linked with the body disorders like gout, kidney and cardiac problems. Many epidemiological studies have suggested that the elevated serum UA is also a risk factor for cardiovascular disease [3-8]. In the extracellular fluid of the central nervous system, AA and UA are present in very high concentration, while the DA level is over 3 orders of smaller magnitude (< 100 nM) [9].
The simultaneous determination of such compounds in real biological samples is difficult because of redox reactions of both substances at the bare carbon paste electrodes regularly take place at very similar potentials [10] and often suffer from a pronounced fouling effect, which results in rather poor reproducibility and sensitivity. Hence, to explore a simple, accurate and reliable method for the simultaneous determination of uric acid and ascorbic acid became an urgent need. During the last decades, new electrodes using organic molecules as sensing elements have been developed. Due to their ease of construction and low cost, the modified electrodes are most widely used. Also the modification of these electrodes is simple because it only requires mixing the modifier with the carbon paste. In this way, it is possible to add a wide variety of products (inorganic or organic substances [11,12], biomolecules, animal and plant tissues [13].
The traditional analytical techniques like various chromatographic methods are applied for simultaneous determination of UA and AA. In which HPLC with UV [14], MS detection [15,16], GC [17] and HPCE [18] are preferred. Similarly numerous HPLC methods have been developed for the simultaneous determination of AA and UA in serum, plasma, urine and tissues [19,20], but these methods are required costlier instruments, well equipped laboratory and also trainees.
between AA and UA was 20 mV and 340 mV respectively. The potential difference in between AA and UA was 360 mV which is quite sufficient to identify the AA and UA simultaneously.
II. MATERIALS AND METHODS
A. Apparatus
The electrochemical experiments were carried out with a CH-Instruments Model No. CHI610D Electrochemical work station with a connection to a personal computer for the electrochemical measurements and treating of data. All the experiments were carried out in a conventional three-electrode system. The electrode system contained a working carbon paste electrode, homemade cavity of 3 mm diameter, a platinum wire as counter electrode and saturated calomel electrode as reference electrode. Bare carbon paste electrode was prepared by grinding 70% of graphite powder and 30% of silicon oil in an agate mortar by hand mixing for about 30 min to get a homogenous paste. The paste was packed into the cavity of CPE and smoothened on weighing paper.
B. Chemicals
Analytical grade Ascorbic acid, Uric acid, sodium dihydrogen phosphate, disodium hydrogen phosphate and silicon oil were procured from Himedia Chemicals. Fine graphite powder (particle size <20µm) was supplied by Sigma-Aldrich chemicals. All chemicals were used as supplied without further purification. All chemicals were of analytical grade and were used without further purification. Uric acid stock solution was prepared by dissolving known quantity of it in 0.1 M sodium hydroxide solution and Ascorbic Acid in double distilled water. Phosphate buffer (pH 7.0) was prepared as per the literature with 0.1 M NaH2PO4 and Na2HPO4 solution in double distilled water.
C. Preparation of bare carbon paste electrode and modified carbon Paste electrode
The bare carbon paste electrode was prepared by hand mixing of 70% graphite Powder with 30% silicon oil in an agate mortar to produce a homogenous carbon paste. The modified carbon paste electrode was prepared by taking different weights of Montmorillonite K10-clay (10, 20, 30 and 40 mg) in silicon oil (30%) and graphite (70%). The prepared modified carbon paste and bare carbon paste was packed into a homemade Teflon cavity and polished using the soft paper [35].
III. Results and discussion
A. Electrochemical investigation of AA at Montmorillonite K10-clay modified carbon paste Electrode
(MMCPE)
ISSN (Online) 2347-3207
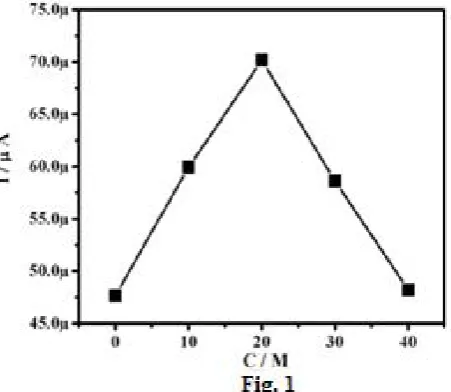
Figure. 1 Effect of concentration of Montmorillonite K10-clay on anodic peak current (Ipa) in 0.1 mM AA and 0.1 M phosphate buffer solution Scan Rate: 50 mVsˉ1
B. The response of AA at the bare CPE and MMCPE
Figure. 2 shows the electrochemical response of 0.1 mM AA in 0.1 M phosphate buffer solution of pH 7.0 at the bare CPE and the MMCPE with a scan rate of 50 mV/s. Compared with the bare CPE there was a remarkable four folds enhancement in the peak current and also there was a reduction in the over potential which showed the electrocatalytic efficiency of the Montmorillonite K10-clay. The mechanism could be explained as follows; under these conditions, the Montmorillonite K10-clay layered lattice structure could strongly incorporate the cations by ion exchange process [36].
Figure. 2 Cyclic voltammogram of 0.1 mM AA at solid line for modified carbon paste electrode prepared with Montmorillonite K10-clay (MMCPE) and at dotted line for bare CPE.
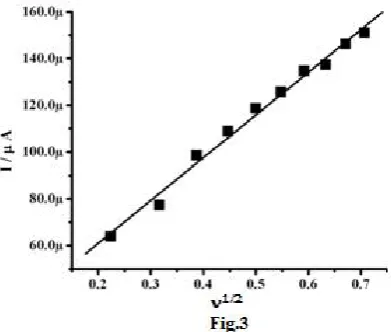
C. Effect of scan rate
phosphate buffer solution at MMCPE.
MMCPE showed an increase in the redox peak currents with an increase in the scan rate (50 to 500 mVsˉ1). The graph of redox peak current (Ipa) vs. square root of scan rate (1/2) was plotted. The graph obtained had a good linearity between scan rates and peak current as shown in Figure.3, in the range from 50–500 mVsˉ1. The redox peak currents were proportional to 1/2 the correlation coefficient (r2) was 0.9952, which indicate that the electrode reaction was a diffusion controlled process.
D. Effect of pH value on the determination of AA at the MMCPE
The suitable pH of the supporting electrolyte had a significant influence on the determination of AA by electro catalysis of MMCPE by affecting both peak currents and peak potentials. The effect of pH value on the determination of AA in the phosphate buffer solution at MMCPE was carefully investigated in a wide pH range of 5.5 to 8.0. Figure. 4 illustrates the dependency of the AA anodic peak current and formal potential [E (V)] on the pH of buffer solution. It could be seen that the anodic peak current of AA increases with increasing pH value until it reaches 7.0, (shown with (-□-) square symbol) and then there was a decrease in the peak current of AA until it reaches 8.0. The formal potential of AA shifts towards lower potential with the increase of the pH value of solution and depends linearly on the pH value in the range of 5.5–8.0 with a slope of 0.07298 V/pH. (R2= 0.981) (Shown with closed circles (-●-)).
Figure. 4 Effect of pH on anodic peak current (Ipa) (-□-), anodic peak potential (Epa (-●-) of 0.1 mM AA in 0.1 M phosphate buffer solution.
E. Concentration effect of AA
ISSN (Online) 2347-3207
Figure. 5 Series of differential pulse voltammograms obtained for AA at MMCPE in 0.1 M (pH 7.0) phosphate buffer solution.
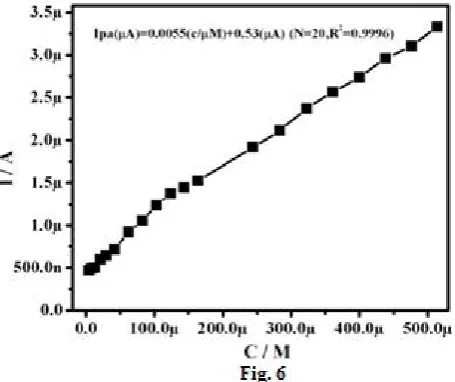
Figure. 6 Graph of anodic peak current Vs concentration of Ascorbic acid at MMCPE in 0.1 M phosphate buffer solution.
Determination of detection limit (DL) and quantification limit (QL) were carried only by using the following equations 1 and 2 [28, 35-38].
DL = 3Sb/S 1
QL = 10Sb/S 2
Where Sb is the standard deviation, S is slope of the working curve DL is the detection limit, QL is the
quantification limit. The determined detection limit and quantification limit were 41 µM and 136 µM respectively.
F. Resolution of AA in the presence of UA by cyclic voltammetry
Figure. 7 Cyclic voltammograms obtained for the electrochemical response of 1mM of AA and UA
G. Effect of various concentration changes of UA in the presence AA and AA in the presence of UA
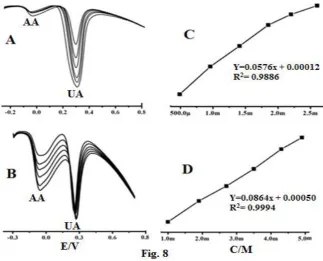
The differential pulse voltammetric study of various Uric acid concentrations in the presence of constant concentration of AA (1 mM) at the MMCPE/immobilized SDS modified electrode for 0.1 M phosphate buffer was studied and is shown in Figure. 8 A. The anodic peak current of UA increases with increase in the concentration from 0.4 mM to 2.6 mM, while the anodic peak current of AA keeps constant due to its constant concentration in the experiment. Furthermore, it was observed that even in the presence of high concentration of AA it did not interfere with the determination of low concentration of UA. Therefore the MMCPE/immobilized SDS modified electrode showed its good selectivity and sensitivity in the electrochemical detection of UA in the presence of AA.
Figure. 8 (A) UA concentration variation at constant AA concentration, (B) AA concentration variation at
constant UA concentration, (C) the linear relationship between the anodic peak current and concentration
variation of UA, (D) the linear relationship between the anodic peak current and concentration variation of AA
ISSN (Online) 2347-3207 concentration of UA (0.4 mM) at the MMCPE/immobilized SDS modified electrode in 0.1 M phosphate buffer was also studied and is shown in Figure. 8. B. The anodic peak current of AA increases with increase in the concentration from 1 mM to 4 mM, while the anodic peak current of UA keeps constant due to its constant concentration in the experiment. Furthermore, it was observed that even in the presence of high concentration of UA it did not interfere with the determination of low concentration of AA. Therefore the MMCPE/immobilized SDS modified electrode showed its good selectivity and sensitivity in the electrochemical detection of AA in the presence of UA. The corresponding graph of anodic peak current versus concentration of UA showed a linear regression (Ipa (mA) =0.08646 Cm M Lˉ1+ 0.505 (N=6, R2=0.9994) and is shown in Figure. 8. D. The detection limit and quantification limit of AA in the presence of constant concentration of UA (0.4 mM) was found to be 1.6 mM and 5.5 mM respectively.
IV. Conclusion
The present study involves the development of MMCPE/immobilized SDS modified carbon paste electrode by bulk modification (direct mixing) of carbon paste followed by immobilization of SDS on the surface of MMCPE for the simultaneous study of AA and UA. The developed MMCPE/immobilized SDS is more sensitive and selective than the bare carbon paste electrode and MMCPE. The selected supporting electrolyte medium i.e 0.1 M phosphate buffer at pH 7.0 plays a crucial role in the determination of UA and AA simultaneously at lower levels. The simultaneous determination of AA and UA by differential pulse voltammetric study at MMCPE showed a poor sensitivity and selectivity. Hence the present developed method of MMCPE/immobilized SDS modified carbon paste electrode was used as chemical sensor for the simultaneous determination of biological active compounds likes UA and AA. The present developed method could be applied for the analysis of AA and UA in real samples.
REFERENCES
[1]
J. W. Mo, and B. Ogoreve, “Simultaneous measurement of dopamine and ascorbate at their physiological levels using voltammetric microprobe based on overoxidized poly (1,2-phenylenediamine)-coated carbon fiber”, Anal. Chem., vol. 73, pp. 1196–1202, (2001).
[2]
S. M. U. Ali, N.H. Alvi, Z. Ibupoto, O. Nur, M. Willander, and B. Danielsson,“Selective potentiometric determination of uric acidwith uricase immobilized on ZnO nanowires”, Sensors and Actuators B., vol. 152, pp. 241–247, (2011).
[3]
J. C. Chen, H. H. Chung, C. T. Hsu, D. M. Tsai, A. S. Kumar, and J. M. Zen,“A disposable single-use electrochemical sensor for the detection ofuric acid in human whole blood”,Sensors and Actuators B., vol. 110, pp. 364–369, (2005).[4]
I. D.P. Wootton, and H. Freeman, “Microanalysis in Medical Biochemistry”, 6th ed, Churchill Livingstone: New York, (1982).[5]
E. Liberopoulos, D. Christides, and E. Moses, “Comparative effects oflosartan and irbesartan on serum uric acid in hypertensivepatients with hyper uricemia and gout”, J. Hypertension., vol. 20, pp. 347–351, (2002).
[6]
F. A. Mateos, and J.G. Puig, “Purine metabolism in Lesch–Nyhan syndromeversus Kelley–Seegmiller syndrome”, J. Inherit.Metab. Dis., vol. 17, pp. 138–142, (1994).
[7]
R. J. Johnson, D. K. Kang, D. Feig, S. Kivlighn, J. Kanellis, S. Watanabe, K. R. Tuttle, B. R. Iturbe, J.H. Acosta, and M. Mazzali,“Is there a pathogenetic role for uric acid in hypertension and cardiovascular and renal disease”, Hypertension., vol. 41, pp. 1183–1190, (2003).
[8]
M. Alderman, and K. J.V. Aiyer, “Uric acid role in cardiovascular disease and effects of losartan”, Curr. Med. Res. Opin., vol. 20,pp. 369–379, (2004).
[9]
A. Ciszewski, and G. Milczarek, “Polyeugenol-modified platinum electrode for selective detection of dopamine in the presence of ascorbic acid”, Anal. Chem., vol. 71, pp. 1055–1061, (1999).[10]
Y. L. Zeng, C.X. Li, C. R. Tang, X. B. Zhang, G. L. Shen, R. Q. Yu, Zhang, and Z. B. Yuan, “The electrochemical properties of co (tpp), tetraphenyl borate modified glassy carbon electrode: application to dopamine and uric acid analysis,”Electroanal., vol. 18, pp. 440–448, (2006).[11]
J. Wang, T. Martinez, D.R. Yaniv, and L. McCornick, “Characterization of the micro distribution of conductive and insulating regions of carbon paste electrodes with scanning tunneling microscopy,” J. Electroanal. Chem., vol. 286, pp. 265–272, (1990).[12]
M.E. Rice, Z. Galus, and R.N. Adams, “Graphite paste electrodes: Effects of paste composition and surface states on electron-transfer rates,”J. Electroanal. Chem., vol. 143 pp. 89–102, (1983).[13]
J. Wang, N. Naser, and M. Ozsoz, “Plant tissue-based amperometric electrode for eliminating ascorbic acid interferences,”Anal. Chim. Acta., vol. 234, pp. 315–320, (1990).[14]
N. Cooper, R. Khosravan, C. Erdmann, J. Fiene, and J.W. Lee, “Quantification of uric acid, xanthine and hypoxanthine inhuman serum by HPLC for pharmacodynamic studies,”J. Chromatogr. B: Anal. Technol. Biomed. Life Sci., vol. 837, pp. 1–10, (2006).
[15]
X. Dai, X. Fang, C. Zhang, R. Xu, and B. Xu, “Determination of serum uric acid using high-performance liquid chromatography (HPLC)/isotope dilution mass spectrometry (ID-MS) as a candidate reference method,” J. Chromatogr. B:Anal. Technol. Biomed. Life Sci., vol. 857, pp. 287–295, (2007).[16]
K. M. Kim, G. N. Henderson, X. Ouyang, R. F. Frye, Y. Y. Sautin, D. I. Feig, and R. J.Johnson, “A sensitive and specificliquid chromatography–tandem mass spectrometry method for the determination of intracellular and extracellular uric acid,” J.
Chromatogr. B: Anal. Technol. Biomed. Life Sci., vol. 877, pp. 2032–2038, (2009).
[17]
X. B. Chen, A. G. Calder, P. Prasitkusol, D. J. Kyle, and M. C.Jayasuriya, “Determination of 15N isotopic enrichment andconcentrations of allantoin and uric acid in urine by gas chromatography/mass spectrometry,”J. Mass Spectrom., vol. 33, pp. 130–137, (1998).
[18]
W. Pormsila, S. Krahenbuhl, and P.C. Hauser, “Capillary electrophoresis with contactless conductivity detection for uric acidpp. 855–862, (2009).
[27]
C. L. Guan, J. Ouyang, Q. L. Li, B. H. Liu and W. R. G. Baeyens, “Simultaneous determination of catecholamines by ionchromatography withdirect conductivity detection,”Talanta., vol. 50, pp. 1197–1203, (2000).
[28]
T. Kleszczewski, and E. J.Kleszczewska, “Flow injection spectrophotometric determination of L-ascorbic acid in biological matters,” Pharm. Biomed. Anal., vol. 29, pp. 755–759, (2002).[29]
J. Wang, M. Musameh, and Y. Lin, “Solubilization of Carbon Nanotubes by Nafion toward the Preparation of AmperometricBiosensors,”J. Am. Chem. Soc., vol. 125, pp. 2408–2409, (2003),
[30]
J. J. Davis, R. J. Coles, and H. A.O. Hill, “Protein electrochemistry at carbon nanotube electrodes,”J. Electroanal. Chem., vol. 440, pp. 279–282, (1997).[31]
J. Wang,and M. Musameh, “Carbon nanotube/teflon composite electrochemical sensors and biosensors,”Anal.Chem., vol. 75, pp. 2075–2079, (2003).[32]
M. Pontie, C. Gobin, T. Pauporte, F. Bedioui, and J. Devynck, “Electrochemical nitric oxide microsensors: sensitivity andselectivity characterization,”Anal. Chim. Acta., vol. 411, pp.175–185, (2000).
[33]
H. Zhao, Y. Zhang, Z. Yuan “Electrochemical Behavior of Norepinephrine at Poly (2,4,6-trimethylpyridine) Modified GlassyCarbon Electrode,”Electroanal., vol.14, pp. 445–448, (2002).
[34]
H. Zhao, Y. Z. Zhang, and Z.B. Yuan, “Poly (isonicotinic acid) modified glassy carbon electrode for electrochemical detection of norepinephrine”, Anal. Chim. Acta., vol. 454 pp. 75–81, (2002).[35]
K. Gangadhara Reddy, G. Madhavi , B. E. K. Swamy, S. Reddy, A. Vijayabhaskar Reddy, and V. Madhavi, “Electrochemicalinvestigations of lipase enzyme activity inhibition by Methyl parathion pesticide: voltammetric studies”, J. Mol. Liq.,Vol. 180, pp. 26–
30, (2013).
[36]
P. K. Ghosh, and A. J. Bard, “Clay modified electrodes,”J. Am. Chem. Soc., vol. 105, pp. 5691–5693, (1983).[37]
G. Madhavi, J. Damodar, S. K. Mohan, and S.J. Reddy, “Differential pulse polarographic determination of Azinphos-Methyl ingrains,”B. Electrochem., vol. 10, pp. 209–213, (1998).