“Challenges in Small Scale Industries in Kopargaon Industrial
Estate, Dist- Ahmednagar (Maharashtra)”
Dr. B. B. Nighot
Abstract
Small Scale Enterprises (SSE) constitutes an important and crucial segment of the industry sector. This sector accounts for 40 % of value added in the manufacturing sector and contributes nearly 35 % of the total direct exports. Small scale enterprises play economic, social and political role in employment creation, resources utilization and income generation. As the March 2012, it is estimated that there are 34.42 lakh small scale units all over India giving employment to around 152.61 lakh people. Production at current prices is estimated 6,90,316 corers in 2001-2002.
Keywords: Small Scale, Challenges, Co-operative
Introduction
During last two decades attempts has been made to promote SSE as part of the national development plans. India has been among the first few developing countries to design a significant role of SSE to play from the first five year plans. Small Scale Enterprise is generally more labour – intensive than larger organizations. SSE includes small but relatively modern manufacturing industry. Organized non manufacturing activity such as construction, transportation and trading and traditional or informal activity.
Objectives of the Present Study
1. To study the development of small scale industries in Kopargaon taluka and challenges before small scale industries.
2. To know the different problems of small scale industry.
3. To study the role of co-operative industrial estate in the development of small scale industry.
4. To study the challenges of small scale industry such as increasing cost of production, quality production, competition, labour problem, export oriented production etc.
Hypothesis
Small scale industries in Kopargaon Taluka facing challenges of increasing production cost and quality of production
Research and Methodology
The adoption of sound research methodology in any problem of economic investigation is a vital part of the study. In the proposed study the investigator has given concentration on challenges before small scale industry in Kopargaon taluka of Ahmednagar district. Small scale industries are in developing stages and facing challenges in Kopargaon taluka, such as increasing cost of production, marketing of products, labour problems, increasing cost of transportation etc. To fulfill the above objectives of proposed study both primary and secondary sources of data collection are used.
Database and Methodology
The present work based on Primary and Secondary data. Primary data will be collected through discussion and interviews with small Industrialist, managers, office staff and labour from small scale industries. Interview also arranged with district industrial centre, experts of industry, officers of Nationalized and Co-operative banks, Government officers, customers, suppliers of raw materials. On the line of requirement of the study for different types of questionnaire will be prepared. The questionnaire will be prepared by personnel discussions with some other respondents. The questionnaire will be translated into Marathi and typed copies will be distributed and data will be collected on sample basis for analysis.
Objectives of Industrial Estate in India
The objectives underlying the establishment of industrial estate in India are as follows-
1) To encourage the growth of small scale industries.
2) To shift small scale industries from urban areas to rural estate premises with a view to increasing their productivity.
3) To achieve decentralized development in small towns and at taluka place.
4) To encourage growth of ancillary industries in the township and at taluka place.
During the first and second five year plans, the emphasis of the Government policy and programmes was on the promotion and growth of small scale industries while during third year plan it was shifted from small industry development to decentralization and development of backward areas. Accordingly the programme of industrial estate was given a rural bias and all new estate were expected to be located, as far as possible, near the small and medium sized towns.
Role of Industrial Estate
India’s industrial policy resolution of 1956 assigned on important role to the cottage and village and small scale industries. The Government of India has adopted a policy of stick and carrots control and incentives to faster growth of small industries. Among the measures employed to assist small scale industries the programme of establishing industrial areas and industrial estates are supported to be an effective means of promoting small industrial enterprises, modernizing them raising their productivity and thus reducing their costs and improving the quality of their production industrial estate as a harbinger of industrial progress in under developed countries. The modern industrial estates were the first built in the United Kingdom and the United States about eighty years ago.
Objectives of Kopargaon Co-operative Industrial Estate 1. To increase small scale and cottage industries in rural area.
2. To develop small scale industries for increasing employment opportunity in the rural area.
3. To acquire the land from government to develop it and plan the plots of different size and distribute it to the members.
4. To provide the infrastructure facilities to the small scale industrialist.
5. To motivate the rural entrepreneur for starting small scale industries.
6. To collect different taxes from small scale industry holders.
increasing demands of the plots the industrial estate apply to the more lands to the government. The estate will get 12 hectares of land in future.
If any activity related to business is not started within six months of getting plot the small industrialist will have to surrender the plots to estate. The principle behind this is that entrepreneur should start the business and provide employment in rural area and indirectly help to the industrial development of the Kopargaon Taluka.
Organization of Kopargaon Co-operative Industrial Estate: The Kopargaon co-operative industrial estate is in co-co-operative sector. One member is elected as a chairman for a period of five years and 18 boards of directors from members are appointed to look after the activity and development of the estate. There are meetings of Board of directors after every two months.
Challenges of Small Units in Kopargaon: After going through observation and interview with small unit holders and officers of banks. Following are the causes of sick units of Kopargaon Taluka. Mainly there are two factors creating causes of sickens in small scale units.
i) Internal factors
ii) External factors
Internal Factors: There are certain internal factors which lead to wide spread industrial sickness in the taluka. These are –
1) Faculty project planning
2) Poor maintenance of plant and machinery
3) Poor collection of bad and doubtful debt.
4) Improper fixation of inventory
5) Poor utilization of resources
6) Lack of ploughing back of profits
7) Mismanagement in the organization
8) Lack of modernization
9) Lack of management and accounting information
10) Lack of research and development.
11) Lack of motivation to the workers by the management.
Sickness of Small scale Industries in Kopargaon Industrial Estate: Small scale entrepreneurs are important because they require minimum capital and provide employment in the rural area. In Kopargaon industrial estate 99 small units are established and new entrepreneurs desire to establish their unit in industrial estate. This industrial unit in Kopargaon taluka is increasing at the same time there is also increase in sick units in the area of Kopargaon cooperative Industrial estate.
External factors of Sickness: These are the factors which are caused and governed by the outside forces. They are as follows -
1) Power failure
2) Unfavorable attitude of banks and other institution
3) Lack of availability of skilled worker
4) Wage disparity in identical units
5) Heavy taxes.
6) Delay in rehabilitation of sick units
7) Increased Government interference
8) Advanced in Technology
9) Labour unrest
10) Poor quality lebout supply
11) Shortage of essential input
12) Restriction in imports
13) Cut-throat competition
These are the causes of small sick units in Kopargaon 50% units re sick due to different internal and external factors.
Remedies on Small Scale Sick Industries in Kopargaon: The small scale units are sick. For avoiding sickness of small scale industry certain suggestions are made herewith.
The Concept of Women Entrepreneur: The concept of women entrepreneur has become a global phenomenon today. It is defined as the women or group of women initiate organize and operate a business enterprise. The government of India has defined a women entrepreneur as an enterprise owned and administered by women entrepreneurs having a minimum financial interest of 51% of the share capital and giving at least 50% of employment generated to enterprise to women.
Women Entrepreneurship: A word “Woman” itself symbolized for –
W-Work, O-Organization M-Management, A-A secretiveness N-Nourishment,
All these qualities expressed in each letter above are hidden in woman. It is widely accepted that entrepreneurship is an essential ingredient of economic development. Women entrepreneurs have been making a significant impact in all segments of economy. Special attention is given by the Small Industries Development Organization (SIDO) for the development of entrepreneurship amongst women in the country. W women entrepreneurs are given preference in various other training programmes of SIDO and they were encourages to participate in the “Prime Minister Rozgar Yojana”. The number of women entrepreneurs had been steadily rising and these were producing a variety of goods. The number of women taking up the engineering course has increased from 1% in 1975 to about 10 % in 1990. As far as the sector of work is considered, it is the largest as about 30% of engineers employed in National institutions are women.
1 The Supply of Industrial Entrepreneur Alexander A.P.
Explorations in Entrepreneurial History
2 Business Entrepreneurship Botre A.R.
Atharva Publications Pune -51
3 Industrial Entrepreneurship in Madras State
Berma J.J.
Asia Publishing House, Bombay 1960
4 Entrepreneurship Motivation Performance Reward
Deep & deep Publications Pvt. Ltd. New Delhi
5 Industrial Entrepreneur in India Dass N. L.
Orient Longman, Calcutta 1997
Reports
Annual reports of Kopargaon Co-operative Industrial Estate Ltd.
Kalaichar Border Haat
Dr Abhigyan Bhattacharjee
Mridul Barman
Abstract
This paper is part of a systematic initiative to develop an analytical framework to identify the challenges and impediments faced by the vendors while engaging in cross-border trade with particular emphasis to Kalaichar border haat. The study attempts to explore the cross border trade through border haat between India and Bangladesh. It identifies the nature of commodities traded in the Kalaichar border haat and the problems faced by the local Vendors while exporting these commodities. The study finds that mostly agricultural products are being exported from Indian side and the vendors face a number of problems including the problems of roads, sheds, water supply etc. The information collected for the study is based on primary survey data as well as secondary data from relevant reports and studies.
Keywords: Border Trade, Border Haat, Kalaichar, etc.
Introduction
Border haat means makeshift bazaar or market at a certain point on zero lines between two neighboring trading nations allowing villagers of both the countries to market and shop each other’s products once a week. Border haats are in high demand by people on both sides of the nations of India and Bangladesh, for people living in remote enclaves and hilly areas otherwise find it difficult to buy and sell products needed in day-to-day life.
The traditional system of border trade had been going on through border haats along India-Bangladesh since quite a long time. This had brought about relative prosperity to the communities residing in both the sides, but unfortunately this was halted in the aftermath of division of the Indian subcontinent, in the post-partition period. Though it resumed again after a few years, again had to be stopped after 1971. But before the border trade could be formalized, Bangladesh raised apprehensions that free exchange of commodities would result in large scale smuggling and therefore border trade between India and Bangladesh should not be allowed. Consequently, in October 1972 the provision of border trade was discarded from the Agreement by mutual consent. After a gap of almost four decades when their relationships improved, India and Bangladesh decided to reopen border haats by signing a Trade Agreement on March 28, 1972. Subsequently, a MoU to establish a hitherto defunct Mughal era border haat was signed between Commerce Minister of India and Bangladesh on October 23, 2010 (Ministry of Commerce, 2010). The stated aim was to promote the wellbeing of the border people by setting up traditional markets for their local produce. Accordingly, two border Haats were established along India-Bangladesh border. The first Haat was inaugurated at Kalaichar in West Garo Hills District of Meghalaya corresponding to Baliamari in Kurigram District of Bangladesh on July 23, 2011. The second
Haat at Balat in East Khasi Hills District of Meghalaya corresponding to Lauwaghar in
Sunamganj District of Bangladesh was made operational on May 1, 2012 (Barman & Bhattacharjee, 2015, p.289).
Article IV of the Agreement provided trading opportunity to people living in rural areas within 16 km belt on either side of the border to dispose off their goods which were mutually agreed upon.
Review of Literature
A number of research works have been done in the field of Border Haats. Few of the literatures reviewed are as under:
backwardness at different trade routes in the entire border lands of India’s North-East. He also highlighted the smuggling across the international border between Bangladesh and Assam and Meghalaya, and between Myanmar and Manipur border. Husian (2000) in his paper ‘The Nature of Border and Border Trade of North-East India’ discussed the nature of real border trade practiced by the border people of the North-East, and also the influence of the nature of border on the trade. Rout (2008) in his article ‘Meghalaya’s Coal Export to Bangladesh and its Impact on Regional Economy’ highlighted the Meghalaya’s coal export though different LCSs to Bangladesh. He also highlighted the contribution of coal export to the Meghalaya Government and the generation of local employment because of coal export to Bangladesh. Deb Kar (2008) in her article ‘Indo-Bangladesh Border Trade: The Garo Hills Dimensions’ opined that Indo-Bangladesh trade that flows across the Garo Hills Border is characterized by export of raw materials from Garo Hills to Bangladesh. Income earned from the coal export by the local people was hardly invested in order to develop alternative source of income.
From the above literatures reviewed, it could be observed that a lot of works have been done in the field of formal and informal border trade, tariff and non-tariff barriers and the potential market for various raw materials that are available in North-East India. However, least attention has been made on the problems faced by the local vendors and vendees in this region of North-East India. Hence, the present study has been taken up to address these gaps taking the case of Kalaichar border haat.
Objectives of the Study
The present paper focuses on the following objectives:
1. To undertake a brief review on border-haat trade between India and Bangladesh.
2. To examine the facilities accessed and problems faced by the Vendors in the Indian side at Kalaichar Border Haat.
Methodology The Design
Keeping in view the objectives in mind, both primary and secondary data has been considered for the purpose of the study. The primary component of the data has been obtained as a participant observant by visiting the site of the Kalaichar Border Haat. Direct interaction with the Vendors of Indian side has been made by means of informal conversation as well as a schedule. Second hand information has been collected from sources such as articles, books, Land Custom Office of Mahendraganj, various reports, and websites. Measurement of Items
There are at present 25 Vendors (selected by the Indian Government) operating in the Kalaichar Border Haat. These 25 Vendors comprise the total population who are interviewed to understand the problems faced by them. Six problems each affecting the vendors in exporting commodities to Bangladesh were listed after thorough discussion. The respondents were asked to rank these items from 1 to 6 by making an overall comparison with regard to the potency of the problems. Those items which the respondents did not consider as problems were put in rank 7. A score of 6, 5, 4, 3, 2, 1 and 0 were given to the ranks 1st, 2nd, 3rd, 4th, 5th, 6th, and 7th respectively. The frequencies of the respondents ranking each constraint in each rank were then multiplied with corresponding score values to obtain the total score values. The problems with higher score value is considered most serious one, followed by others in the order of decreasing score values.
Kalaichar is located in the South West Garo Hills District of Meghalaya, India. The hill region is mostly inhabited by the Garos, while in the foothills there are Hajongs, Kochs and Bengalis. The district is surrounded by Dhubri district of Assam and Kurigram District of Bangladesh. Physically, the area of the South West Hills Districts extends upto 11 kilometres short of Tura on the East; Mahendraganj and Gopinath Kila on the West; Mankachar on the North and Bolmamgri and Kalaichar on the South. South West Garo Hills has approximately 35 kilometres of international boundary with Bangladesh on the south and western side. Nearly one third of the total number of villages of the district is declared as border villages by the Border Area Development Department of Meghalaya.
The Kalaichar Border Haat along the India-Bangladesh border are enclosures constructed on the zero line Border Pillar Number-1072 and are opened once a week (Wednesdays) from 10 am to 3 pm. The commodities sold in these Haat are exempted from customs duties (Barman & Bhattacharjee, 2015; Taneja, 2018). It allows a purchase of up to 100 US Dollar per vendees and transactions can be conducted in local currencies or through barter system. People residing within the radius of 10-15 km of the border trade are able to frequent these
Haats; although the stipulated distance is only 5 km. Vendors consisting of 25 (Twenty Five) from India are given trading permit valid for one year and are required to carry photo identity cards. To ensure public order, only 200 persons at present are allowed inside the Haat at a given time. During the days of trading, customs officials, local police and border security force (BSF) personnel are present in the Haat to ensure smooth conduct of trade. Commodities sold in the Indian stalls include prayer mats, cumin seeds, bed covers, quilts and blankets (imported from China/Korea through Moreh), cosmetics and toiletries, bay leaves, and betel nuts. Items sold in the Bangladesh stalls comprise plastic and melamine products and readymade garments. Vendors are allowed to carry their goods on head loads or on hand cart (Barman & Bhattacharjee, 2015).
Survey Result and Discussion
Border trade in Garo Hills is a century old practice. The Garos of the Southern hills along the Mymensing border of Bangladesh were in the habit of trading in all the markets of Sherpur and Susang areas of the Mymensing Districts. The trade with the Garos in cotton, aghur, elephants and manufactured articles was so lucrative that each estate holder established a string of weekly markets (Haats) at all important passes in their respective estates. Cotton was the staple article of internal trade in Eastern India. The Garos were the largest producers of cotton in Eastern India. In order to established monopoly of trade interest with the Garos, the estates holders in their respective areas used to appoint estate police and burkandazes to guard and maintain their Haats at all principal passes, collect taxes levied by the estate holders on all Garos and Non-Garo traders. They were also in charge of security of the border with Garoland. The low country businessman would meet their tax burden from their enormous profits in their dealings with the Garos. The prominent estate holders were those of Mechapara, Aurangabad, Kalumalupara and Karaibari in old Rangpur of Sherpur and Susang in Mymensing, now in Bangladesh, of Sidly and Bijni in Eastern Duars, now in Goalpara district of Assam. All of them existed during the period of British contact with the upland Garos (Deb Kar, 2008).
Kalaichar Border Haat: Its Process and Management
and Kalaichar border haat during weekdays on Wednesdays. The border haat at Kalaichar is managed by a five-member Haat Management Committee (HMC) headed by the Additional District Magistrate and constituting one member each from the customs, police, border security force and a village/union level local government representative. Border haats permit vendors (sellers) and vendees (buyers) residing within a radius of 5 km to trade in the haat. The number of vendors at Kalaichar border haat is restricted to 25 each from both India and Bangladesh sides. There is no restriction mentioned in the MoU regarding the number of vendees and each HMC decides on the number of people who get the license to buy in the haat. However, number of vendees at Kalaichar border haat is restricted to 200 at present. The MoU only notes that the number of vendees will be regulated to ensure that the haats are not overcrowded. A single buyer was initially allowed to purchase goods up to a limit of USD 50. The limit has now been raised to USD 200 on a given market day. The Vendors and Vendees are interviewed by the Kalaichar Border Haat Management Committee consisting of a Chairman (DC of South West Garo Hills Districts, Ampati) and Members like First Class Magistrate, Officials of Land Customs, State Police and Border Security Force based on their basic mental aptitude. These Vendors are allowed to sell only the listed items fixed by both the Governments. It has been learned that each Vendor sells Rs. 30,000-36,000 from per weekly Kalaichar Border Haat.
As per the agreement between two the counties, only local currency is being allowed for transactions in the Kalaichar border haat (Rupee of India and Taka of Bangladesh). Suppose a Bangladeshi purchase Indian locally produced good, he/she pays in his/her own currency (Taka). Now, the Indian vendors will exchange this Bangladeshi currency with the bank official (SBI, Tura, and Meghalaya) present there for Indian currency every Wednesday in the haat itself as the official is deputed for border haat day. As per the agreement there should be one bank official from Sonali Bank of Bangladesh side, however, it has been observed that no representative bak officials visit the Kalaichar border haat from Bangladesh side. So the vendors from Bangladesh also approach the SBI bank official to get the Indian currency exchanged with that of Bangladesh currency. After the haat gets over, the bank official takes both the currency and handover to the Main Branch, SBI, Tura to maintain official record. If due to some reasons the bank official (Indian side) fails to turn up on the border haat day, in the absence of the bank official, vendors and vendees choose a representative among themselves to deposit all the money received during transactions on the haat day. During the next haat day, the leader returns all accumulated amount to the respective vendors and vendees to get exchanged the amount with the bank official.
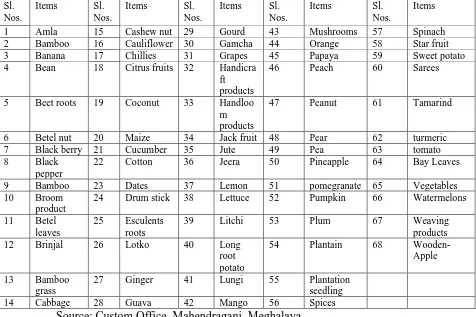
Tradable Commodities at Kalaichar Borsder Haat
Article -3 of the MoU provides both the countries to allow the following Commodities to be traded in two Border Haats (one at Kalaichar in Garo Hills and Second one at Balat in Khasi Hills) of Meghalaya:
a. Locally produced Vegetables, food items, fruits, and spices.
b. Minor local forests produce, for example, bamboo, bamboo grass, bamboo stick, but excluding timber.
c. Products of local cottage industry like Gamcha, Lungi, etc.
d. Small locally produced agriculture household implements, for example, Dao, Plough, Axe, Spade, etc.
Based on the description of Commodities, a list of items is traded at the Kalaichar Border Haat throughout the year (Barman & Bhattacharjee, 2015).
Table-1: Tradable Items at the Kalaichar Border Haat
Sl. Nos.
Items Sl.
Nos.
Items Sl.
Nos.
Items Sl. Nos.
Items Sl.
Nos.
Items
1 Amla 15 Cashew nut 29 Gourd 43 Mushrooms 57 Spinach
2 Bamboo 16 Cauliflower 30 Gamcha 44 Orange 58 Star fruit
3 Banana 17 Chillies 31 Grapes 45 Papaya 59 Sweet potato
4 Bean 18 Citrus fruits 32 Handicra
ft products
46 Peach 60 Sarees
5 Beet roots 19 Coconut 33 Handloo
m products
47 Peanut 61 Tamarind
6 Betel nut 20 Maize 34 Jack fruit 48 Pear 62 turmeric
7 Black berry 21 Cucumber 35 Jute 49 Pea 63 tomato
8 Black
pepper
22 Cotton 36 Jeera 50 Pineapple 64 Bay Leaves
9 Bamboo 23 Dates 37 Lemon 51 pomegranate 65 Vegetables
10 Broom product
24 Drum stick 38 Lettuce 52 Pumpkin 66 Watermelons
11 Betel leaves
25 Esculents roots
39 Litchi 53 Plum 67 Weaving
products
12 Brinjal 26 Lotko 40 Long
root potato
54 Plantain 68
Wooden-Apple
13 Bamboo
grass
27 Ginger 41 Lungi 55 Plantation
seedling
14 Cabbage 28 Guava 42 Mango 56 Spices
Source: Custom Office, Mahendraganj, Meghalaya.
A Glimpse of Infrastructure and Amenities at the Kalaichar Border Haat
A survey was conducted at the Kalaichar border haat during June 2017 and September 2018. Visit was made on a particular haat day (Wednesday). Some information availed through observation and interaction with the officials as well as with the market participants (vendors and vendees).
Table 2: Infrastructure and Amenities at the Kalaichar Border Haat Kalaichar Border Haat
1 Security Manual registrations at time of entry and exit by
customs and the BSF officials.
2 Access to haat Poor condition of access road leading to Haat.
No separate toilet for Women
4 Common Facility Centre No
5 Running Water supply Not available
6 Electricity supply No
7 Storage/Warehouse Facility No
8 Banking Facilities Limited banking and foreign exchange facilities
9 Phone and Internet
Connectivity
Poor mobile phone connectivity. No internet connectivity
Source: Survey Data
From Table 2, we may observe that infrastructure at Kalaichar border haat is in a very poor condition. There is no separate toilet facility for the women. Even the condition of the existing toilet available is poor with no water supply. There is no common facility centre, no running water supply and no storage or warehouse facility in the border haat. The banking facility which exists is also limited. There is also very poor mobile and internet connectivity in the area.
Table 3: Problems faced by the Vendors at Kalaichar Border Haat Sl.
No.
Problems Rank 1st 2nd 3rd 4th 5th 6th 7th Total
Score
Score 6 5 4 3 2 1 0
1 Road connectivity 12 7 3 1 1 1 0 125
2 Banking facility 10 5 4 3 2 1 0 115
3 Custom
accommodation
6 3 7 5 2 2 0 100
4 Seasonal availability
4 7 6 3 2 3 0 99
5 Storage facility 2 4 7 6 4 2 0 88
6 Transport facility 3 2 4 8 5 3 0 81
Frequencies of problems and ranks are shown in columns and rows respectively Source: Survey Data
From Table 3 we may observe that there are scores of problems associated with the border haat at Kalaichar as expressed by the vendors. Altogether six prominent problems were identified. Among these, poor, road connectivity, limited banking facility, lack of custom accommodation, seasonal tradable commodities, lack of storage and transport facility are the most common problems.
Conclusion
facilitate border trade with Bangladesh and also the movement of people of both the countries across the border. Officials of Custom Department from Mahendraganj come over Kalaichar Border Haat which is held on every Wednesday to keep the office record. These officials do not have their own office building. The vendors and vendees had contributed money by themselves and have constructed a small makeshift shed with tin roof but without any boundary walls. Agricultural crops in Garo Hills are seasonal and it also depends on monsoon variability, so commodity supply keeps on changing with seasonal availability of crops. Transport facility is another major problem for local vendors as only hand carts are allowed to carry goods on the market day. Since road condition is very poor, motor carrier vans cannot access the roads. There is hardship for the vendors in transportation of commodities in bulk as motor vehicles have difficulty passing through the narrow strip of road. Further few carrier vans which ply have to be parked at a long distance on account of no parking space for the vehicles near the haat area. It is now incumbent upon the concerned authorities to take necessary and adequate steps to solve the existing limitations for a smooth functioning of the border haat which is a lifeline to the poor rural households of the remote border villages of both the neighboring nations.
References
Barman, M., & Bhattacharjee, A., (2015), ‘A Study on Indo-Bangladesh Cross Border Trade
with Special Reference to Kalaichar Border Haats of South-West Garo Hills, Meghalaya’,
in Bhattacharjee, A., (eds.), ‘Look East Policy-Perspective from South-East Asian Architecture’, Excel India Publishers, New Delhi, pp.288-296.
Bezbaruah, M. P. (2000), ‘Liberalization of Border Trade: Prospects and Impediments’in Das, Gurudas and Purakayasta, R. K. (eds), ‘Border Trade: North East India and Neighboring Countries’, Akansha Publishing House, New Delhi, pp. 87-91.
Bhattacharya, N. N., (2000), ‘Border Trade and Associated Problems in North-East India’ in Das, Gurydas and Purakayasta, R. K. (eds), ‘Border Trade: North-East India and Neighbouring Countries’, Akansha Publishing House, New Delhi, pp.103-108.
Das, Gurudas (2000), ‘Trade between the North-Eastern Region and Neighbouring Countries: Status and Implications for Development’ in Das, Gurudas and Purkayastha, R. K. (eds.), ‘Border Trade: North East India and Neighboring Countries’, Akansha Publishing House, New Delhi, pp.23-34.
Das, Gurudas (2008), ‘Indo-Bangladesh Economic Relation: Issues in Trade, Transit and Security’ in Das, Gurudas and Thomas, C. J. (eds), ‘Indo-Bangladesh Border Trade,
Benefiting From Neighborhood’, Akansha Publishing House, new Delhi, pp.3-42.
Das, Gurudas and Thomas, C. J. (2005), ‘Economy of Myanmar: Trends, Structure and Implications for Border Trade with India’s North-East’in Das, Gurudas et al.(eds.)
‘Indo-Myanmar Border Trade: Status, Problems and Potentials’, AkanshaPublishing House. New Delhi.
Das, Pushpita (2014), ‘Status of India’s Border Trade: Strategic and Economic
Significance’, Institute for Defense Studies and Analysis, Working Paper No.37. Retrieved on June 24, 2018, from
https://www.google.co.in/webhp?sourceid=chromeinstant&ion=1&espv=2&ie=UTF 8#q=study+on+border+Haats+by+Pushpita+das+pdf).
Dutta, S. S. (2000), ‘Economic Impact of Exposed Indo-Bangla Border: A Case Study of Karimganj Region’ in Das, Gurudas and Purakayasta, R. K. (eds), ‘Border Trade: North East India and Neighbouring Countries’, Akansha Publishing House, New Delhi, pp.
192-199.
Gassah, L. S. (1984), ‘Effects of Partition on the Border Markets of Jaintia Hills’in Ganguli, J. B. (eds), Marketing in North-East India, Omsons Publications, Gauhati, pp. 63-69. Halder, Dilip (2008), ‘Cross Border trade Between India and Bangladesh: A Comparison Between West Bengal and North Eastern Region’ in Das, Gurydas and Thomas, C. J. (eds),
‘Indo-Bangladesh Border Trade Benefiting From Neibourhood’, Akansha Publishing House, new Delhi, pp.192-233.
Husain, Zahid. (2000), ‘The Nature of Border and Border Trade of North-East India’ in Das, Gurudas and Purkayastha, R. K. (eds.), ‘Border Trade: North East India and Neighboring Countries’ Akansha Publishing House, New Delhi, pp.130-142.
Kumar, B. B. (2000), ‘The Border Trade in North-East India: The Historical Perspective’ in Das, Gurudas and Purkayastha, R. K. (eds.), ‘Border Trade: North East India and
Neighboring Countries’ Akansha Publishing House, New Delhi, pp.3-11.
Mandal, Ram Krishna (2009) ‘Emerging Scenario of Trade Potentialities of North-East India: Challenges and Opportunities’, Journal of Global Economy, Vol. 5 No.1, pp 68-74.
Memorandum of Understanding between The Government of The Republic of India and The Government of The People’s Republic of Bangladesh on Establishing Border Haats across the Border between India and Bangladesh, New Delhi, (October 23, 2010), Retrieved April 9, 2015, from
http://commerce.nic.in/trade/MOU_Border_Haats_across_Border_India_and_Bangladesh2 010.pdf.
Rather, Zahoor Ahmad & Gupta, Deepika, (2014), ‘India-Bangladesh Bilateral Trade: Problems and Prospects’, International Affairs and Global Strategy, 22, 43-45.
Rout, Lambodar (2008), ‘Meghalaya’s Coal Export to Bangladesh and its Impact on Regional Economy’ in Das, Gurydas and Thomas, C. J. (eds), ‘Indo-Bangladesh Border
Trade Benefiting From Neibourhood’, Akansha Publishing House, new Delhi, pp. 350-360. Sarma, B. K.., & Goswami, S., N. (2000), ‘Border Trade in North-East India: An Overview’ in Das, Gurudas and Purkayastha, R. K. (eds.), ‘Border Trade: NEI and Neighbouring Countries’ Akansha Publishing House, New Delhi, pp.92-102.
Sikidar, S., Borthakur, S. & Borpujari, U. (2015). ‘Connectivity as an Emerging Issue in
Trade Relation of India’s North-East with its Neighbouring’, in Bhattacharjee, A., (eds.), ‘Look East Policy-Perspective from South-East Asian Architecture’, Excel India Publishers, New Delhi, pp.224-229.
Taneja, Nisha., Joshi, Sanjana., Prakash, Shravani., & Bimal, Samridhi. (2018). Trade Facilitation Measures to Enhance Participation of Women in Cross-border Trade in BBIN
Indian Council for Research on International Economic Relations (ICRIER), New Delhi
Trade Agreement between the Government of India and the Government of the People’s Republic of Bangladesh, (March 28, 1972), New Delhi, Retrieved August 10, 2018 from http://mea.gov.in/bilateraldocuments.htm?dtl/5606/Trade+Agreement+Protocol+1+Nov+1 972
Commerce and Industries Department, Government of Meghalaya Retrieved September 6, 2018, from http://www.megindustry.gov.in/borderhaat.html
This research paper is an outcome of the financial support provided for the major research project titled “Dynamics of Cross-Border Trade and Assessment of the Socio-Economic Impact on the Tribal Populace of Border Regions of Meghalaya” Sponsored by the ICSSR,
Consumption Pattern In India: An Econometric Analysis Using
NSS Data
Dr.D.Sathiyavan
*Abstract
A large body of literature on demand estimation has used the consumption expenditure data as a proxy for income of household or individual due to the unavailability of comprehensive, precise data on income since 1950 for India. This study has dentified necessary or luxury commodities and substitutes or complements in rural and urban sectors of India by computing various elasticites using the estimates of linear and log-linear demad functions using national sample survey data on consumption expenditure.
Linear function estimates indicate that the commodities like food grains, milk, meat egg and fish, sugar, other food, fuel and light, clothing, total food are necessary commodities and items like edible oil, salt, other non-food and total non-food are likely to be luxuries in urban India where as commodities such as food, milk, fuel and light, clothing and total food are seemed to be necessaries and the meat, egg & fish, sugar, other food, edible oil, salt, other non-food, total non-food are luxuries in rural India. Log-linear function estimates reveal that the items such as food grains, milk, meat, egg and fish, sugar, other food, fuel and light and total food are likely to be necessaries and clothing, edible oil, salt and other non-food items are luxuries in urban sector and the commodities like food grains milk, sugar, other food, edible oil, salt other non-food, total food, and total non-food are happened to be necessaries and meat, egg & fish is luxury in rural sector. The income elasticities are ranging from 0.30 to 1.99 in urban India and –0.06 to 1.29 in rural India. Log-linear estimates also indicate that fuel & light and clothing are found to be inferior commodities in rural India.
Keywords: Linear;Log-linear;Engel;Own- price;Cross-price;Substitute;Complement.
1. Introduction
The empirical analysis of consumer behaviour plays a predominant role in econometrics. Now many techniques were developed in response to practical problems in interpreting demand data. The researchers have taken up the various methodological questions that arise in projecting demand from Engel curves. They also considered different factors other than total consumption expenditure influencing the pattern of household consumption.
The basic objectives of econometric studies on demand studies are structural analysis, forecasting and policy evaluation. All the objectives involve some aspects of structural analysis particularly the estimation of impacts of prices and income on demand as measured by elasticities of demand. Some are oriented towards forecasting, others are towards policy evaluation, in particular, impacts of policies that may affect markets for consumer goods such as taxes or (de)regulation.Various studies have utilized different functional forms in computing the elasticities. Thus the elasticities of demand are necessary for choosing the appropriate items for indirect taxation and for assessing the tax-yields. They are also used for projecting the aggregating demand for a commodity at any future date.
*Associate Professor, The author is very much thankful to Prof. P. Duraisamy, Vice-Chancellor, University of Madras for his valuable guidance and encouragement.
In India much work was not done before 1950. But budget studies were being carried out in small areas even in the thirties for the construction of cost of living indices. Since then a large number of studies have been carried out by many researchers and many papers have appeared in journals and conferences.
In this study, we estimate the commodities’ price and income elasticities using aggregate NSS data of demand functions. A time series data at all India level for twenty years are used for the empirical analysis. The rest of the paper is organized as follows. Section-2 reviews some important past empirical studies. Section-3 discusses the database, Model and Method utilized in the study. Section- 4 presented the results and discussed. Section-5 summarises the findings of the study.
2. Review of Past Studies
Engel (1857) framed the empirical laws governing the relation between income and expenditure for the first time. Then, Allen and Bowley (1935) showed that the expenditure elasticities of food, rent and clothing were around 0.8. Schultz (1938) estimated the demand for sugar in the United States for two sub-periods. His estimates showed that the percapita consumption increased year by year at an average rate of 0.84% pounds and 1.56% per annum respectively. Dissanaya and Giles(1988) utilized six models of Engel functions for Sri Lankan data and found that food, fuel and light are necessaries where as housing, clothing, education and medical expenses as luxuries. Stone (1954) found that beef as a substitute and cream as a complement for milk, condensed milk as inferior good and fresh milk, margarine, tea and cheese are as substitutes using the data for the period 1937-1939 for United Kingdom. Prais and Houthakker (1955) using semi-logarithmic demand function concluded that coffee was more of luxury good than tea and condensed milk was an inferior good.
In India, most of the studies were carried out at all India level and a few for various regions and major cities. Roy and Laha (1959) fitted the straight lines sensibly and revealed that the resultant elasticities are biased as the average of the household expenditure. Mazumdar(1967) investigated this bias later. Among the estimation of four forms by Bhattarcharya and Maitra(1969), the log-log inverse (LLI) and semi logarithmic functions were nearly as good as hyperbola. They also accepted for cereals and substitutes and pulses in the urban India.
Deaton and Muellbauer (1980a) identified food and fuel and lighting as necessary commodities and clothing and other non food items as luxuries. Ray (1980) utilized five versions of the almost ideal demand system (AIDS). The significant price effects on budget share of many items individually and the rejections of zero price effects on budget share of food and clothing (rural) and fuel & light (urban) points out the price variable as an effective policy instrument to Government. Iyengar and Vani (1988) forecasted the household demand for the years 1990, 2000 and 2010 and showed that the rate of growth in demand for necessary items would be much smaller when compared to relative luxuries.
essentials calories intake using compiled panel data on consumer expenditure from 38th, 43rd, 50th, 55th, 61st and 66th rounds of NSSO.
3. Data, Model and Methodology
The data for the time series analysis is used from the grouped household budget data since third round (Aug.1951–51) through twenty-fifth round (July1970-June 1971). Thereafter the NSSO has been carrying out Consumer Expenditure Surveys quinquennially since 1972-73 (27th, 32nd, 38th, 43rd, 50th, 55th and 61st rounds of NSS, at roughly 5-year intervals). In order to use the continuous time series data, the data from third round (Aug.1951 – 51) through twenty-fifth round (July1970-June 1971) are used in the analysis. Data beyond the twenty fifth roud were not collected by NSSO continuously and hence the present study has used the data upto the twenty fifth round. Data for the commodity groups namely foodgrains, milk and its products, meat, egg and fish, edible oil, sugar, salt, other food, total food , fuel & light, clothing, other nonfood and total nonfood are culminated from various rounds of NSSO reports.
On keeping all the problems, the whole commodity groups were broken down into twelve-commodity groups viz., food grains, milk and its products, meat, egg and fish, sugar, other nonfood and total nonfood. Regarding the price indices the wholesale price indices for other food, other than nonfood commodity groups were constructed separately for rural and urban India with a constant base period =100. For other commodities the readily available price indices are taken from Chandok (1978).
Based on the utility maximization framework, the demand functions are derived for n-commodities. The demand function satisfies the properties such as homogeneity, symmetry and negativity of the own substitution. Symmetricity of demand functions reduces the number of parameters to be estimated. Number of seminal works are associated with theoretical framework in consumer behavior and derivation, type & properties of demand functions and other conceptual issues & applications [Klein(1962), Green(1971), Powell (1974), Metwally(1974), Theil(1976), Desai(1976), Intriligator(1980), Henderson and Quandt(1980), Deaton and Muellbauer (1980a), Mahajan(1980), Phillips(1982) Deaton(1986)].
The empirical specification of both linear and log-linear form of demand function can be specified as
𝑋𝑖 = 𝑥𝑖 + 𝑥𝑖 𝑃𝑖𝑡 + 𝑥𝑖 𝑀 + 𝑢𝑖
𝐿𝑜𝑔 𝑋𝑖 = 𝑥𝑖 + 𝑥𝑖 𝑙𝑜𝑔𝑃𝑖𝑡 + 𝑥𝑖 𝑙𝑜𝑔 𝑀 + 𝑢𝑖 i = 1, 2, 3……n, t = 1, 2, 3…....T
where Xi and Pi are the ith commodity and its price respectively. , & are the parameters to be estimated. ui is the stochastic term uncorrelated with explanatory variables. The expenditure on each commodity is the dependent variable and price and total expenditure as a proxy for income are considered as independent variables. The estimated coefficients are used for computation of elasticites. The own and cross price and income elasticities of the linear and log-linear functions are given below.
The own and cross-price elasticities for linear model can be derived as 𝜀𝑖𝑖 = 𝑥𝑖 (
𝑃𝑖𝑡
𝑋𝑖𝑡 ) 𝑎𝑛𝑑 𝜀𝑖𝑗 = 𝑥𝑖( 𝑃𝑗𝑡
𝑋𝑖𝑡 ) 𝑓𝑜𝑟 𝑖 ≠ 𝑗
The income elasticity can be derived as
𝐸 𝑖 = 𝛿𝑖 ( 𝑀
The income and price elasticities for the log-linear model are
𝐼𝑛𝑐𝑜𝑚𝑒 𝑒𝑙𝑎𝑠𝑡𝑖𝑐𝑖𝑡𝑦: 𝐸𝑖 = 𝛿𝑖 𝑂𝑤𝑛 − 𝑝𝑟𝑖𝑐𝑒 𝑒𝑙𝑎𝑠𝑡𝑖𝑐𝑖𝑡𝑦 𝜀𝑖𝑖 = 𝑥𝑖𝑖 𝐶𝑟𝑜𝑠𝑠 − 𝑝𝑟𝑖𝑐𝑒 𝑒𝑙𝑎𝑠𝑡𝑖𝑐𝑖𝑡𝑦 𝜀𝑖𝑗 = 𝑥𝑖𝑗
where ii and ij are the regression co-efficients of prices of ith and jth commodities. Since the prices are assumed to be constant in the short-run, all the properties such as Homogeneity, Symmetry and Negativity are not applicable in the cross section analysis. The empirical specifications of linear and log-linear form of Engel function are specified below.
4. Results and Discussion
Average per capita expenditure on the various commodity groups for urban and rural India is presented in Table-1. It is very obvious that the average per capita expenditure on food grains is the highest among the food and non-food items in both urban and rural India. The average total food expenditure per capita in rural India is approximately little less about by Rs.4.50. The average per capita expenditure on total non-food item in rural India is less than one-half of the average food per capita expenditure in urban India indicates that the non-food items are costlier in urban areas.This indicates that there is a wide gap between the rural and urban sectors in terms of consumption of non-food commodities as they are costlier than food items.
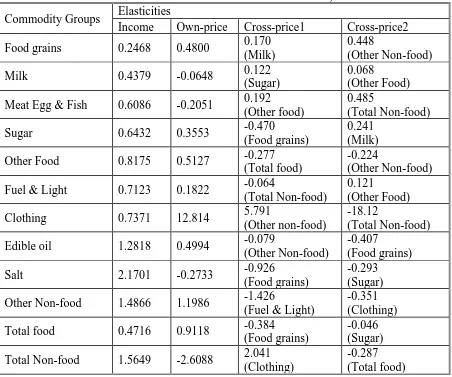
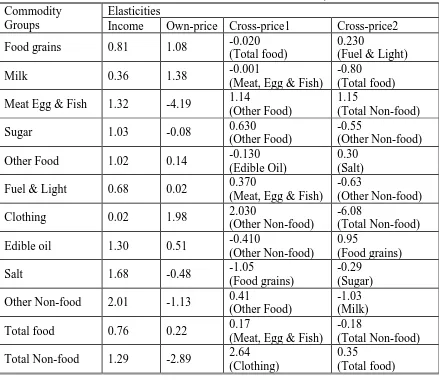
The elasticities of income, own and cross-prices based on the estimates of the linear demand function are presented in Table-2 for urban India and in Table-3 for rural India. The regression estimates are statistically significant in both urban and rural sector except for the commodity, clothing in rural India. Own price estimates are negative for the commodities milk, meat, egg and fish, salt, total non-food in urban India and for the meat, egg, and fish, sugar, salt, other non-food and total non-food in rural India.
Table – 1: Average per capita expenditure by commodity groups, 1951-51 to 1970-71
Commodity Groups Urban Rural
Mean Std. Dev. Mean Std. Dev. Food grains 8.290 2.836 10.08 3.61
Milk 3.062 0.806 1.707 0.524
Meat Egg & Fish 1.102a 0.298 0.456 0.055 Sugar 0.957a 0.321 0.532 0.097 Other Food 5.022a 1.624 2.225 0.343 Fuel & Light 1.949 0.469 1.403 0.339 Clothing 2.099 0.357 1.735 0.270 Edible oil 0.929a 0.175 0.515a 0.096 Salt 0.047a 0.001 0.058a 0.011 Other Non-food 8.916 1.830 3.703 0.832 Total food 19.87 6.403 16.31 5.278 Total Non-food 12.99 2.505 6.844 1.262 Note: a - indicates the mean values for only 15 observations
rural, the commodities food, milk, fuel and light, clothing and total food are seems to be necessaries and the remaining items are luxuries.
The income elasticities are ranging from 0.25 to 2.17 for urban India and 0.02 to 2.01 for rural India. In urban, food grains, milk, meat, egg and fish, sugar, other food, fuel and light and total food are likely to be necessaries and remaining items are luxuries. In rural India the commodities like milk, fuel and light, clothing, total food, other food are happened to be necessaries and edible oil, salt, other non-food, total non-food are luxuries. The elasticities of sugar and other food are approximately equal to one. The income elasticites are statistically significant for all commodities except for milk and meat, egg and fish for rural India.
Table – 2: Linear Income and Price Elasticities for Urban India, 1951-51 to 1970-71
Commodity Groups Elasticities
Income Own-price Cross-price1 Cross-price2 Food grains 0.2468 0.4800 0.170
(Milk)
0.448
(Other Non-food) Milk 0.4379 -0.0648 0.122
(Sugar)
0.068
(Other Food) Meat Egg & Fish 0.6086 -0.2051 0.192
(Other food)
0.485
(Total Non-food) Sugar 0.6432 0.3553 -0.470
(Food grains)
0.241 (Milk) Other Food 0.8175 0.5127 -0.277
(Total food)
-0.224
(Other Non-food) Fuel & Light 0.7123 0.1822 -0.064
(Total Non-food)
0.121
(Other Food) Clothing 0.7371 12.814 5.791
(Other non-food)
-18.12
(Total Non-food) Edible oil 1.2818 0.4994 -0.079
(Other Non-food)
-0.407
(Food grains) Salt 2.1701 -0.2733 -0.926
(Food grains)
-0.293 (Sugar) Other Non-food 1.4866 1.1986 -1.426
(Fuel & Light)
-0.351 (Clothing) Total food 0.4716 0.9118 -0.384
(Food grains)
-0.046 (Sugar) Total Non-food 1.5649 -2.6088 2.041
(Clothing)
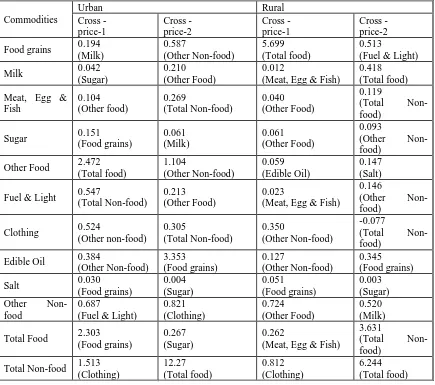
The substitutability or complementary of the commodity groups are classified according the compensated substitute effect is positive or negative. The estimates of the compensated substitution effect are presented in the Table - 6. In urban, milk is a substitute for food grains and sugar. The commodity group, other food, is a substitute for milk, meat, egg and fish, fuel and light. Total non-food is a substitute for meat, egg & fish, fuel & light, and a complement for clothing. The commodity Food grains is a substitute to sugar, edible oil, and total food. Clothing is a substitute for other non-food and total non-food in both rural and urban India. Both linear and log-linear form of demand functions show that the commodities food grains, milk, meat, egg and fish, sugar, other food, total food and fuel and light are likely to be necessaries and remaining items are luxuries. In rural log-linear form shows that the commodity groups namely food grains, meat, egg and fish are inferior goods where as linear form shows that the food grains is a necessary item and meat, egg and fish as luxury items.
Table – 3: Linear Income and Price Elasticities for Rural India, 1951-51 to 1970-71
Commodity Groups
Elasticities
Income Own-price Cross-price1 Cross-price2 Food grains 0.81 1.08 -0.020
(Total food)
0.230
(Fuel & Light) Milk 0.36 1.38 -0.001
(Meat, Egg & Fish)
-0.80 (Total food) Meat Egg & Fish 1.32 -4.19 1.14
(Other Food)
1.15
(Total Non-food) Sugar 1.03 -0.08 0.630
(Other Food)
-0.55
(Other Non-food) Other Food 1.02 0.14 -0.130
(Edible Oil)
0.30 (Salt) Fuel & Light 0.68 0.02 0.370
(Meat, Egg & Fish)
-0.63
(Other Non-food) Clothing 0.02 1.98 2.030
(Other Non-food)
-6.08
(Total Non-food) Edible oil 1.30 0.51 -0.410
(Other Non-food)
0.95
(Food grains) Salt 1.68 -0.48 -1.05
(Food grains)
-0.29 (Sugar) Other Non-food 2.01 -1.13 0.41
(Other Food)
-1.03 (Milk) Total food 0.76 0.22 0.17
(Meat, Egg & Fish)
-0.18
(Total Non-food) Total Non-food 1.29 -2.89 2.64
(Clothing)
0.35
Table – 4: Log-Linear Income and Price Elasticities for Urban India, 1951-51 to 1970-71
Commodity Groups Elasticities
Income Own - price Cross - price1
Cross-price2 Food grains 0.303 0.478 -0.031 0.525
Milk 0.485 1.003 0.237 -0.879
Meat Egg & Fish 0.633 -0.198 0.199 0.420
Sugar 0.50 0.294 0.008 0.458
Other Food 0.911 0.525 0.208 -0.638 Fuel & Light 0.721 -0.007 -0.063 0.172 Clothing 1.760 0.388 -1.49 0.296 Edible oil 1.213 0.451 0.006 -0.323
Salt 1.985 -0.06 0.518 -0.837
Other Non-food 1.515 -1.05 -0.223 0.371 Total food 0.592 0.576 -0.25 0.16 Total Non-food 1.479 0.249 -0.416 -0.45
Table – 5: Log-Linear Income and Price Elasticities for Rural India, 1951-51 to 1970-71
5. Conclusions
Based on utility maximization framework the theoretical model has been developed to derive demand equations for each commodity and demand functions are estimated. Linear and log – linear form of demand functions are estimated. Twelve exogenous variables are regressed on four endogenous variables, which are differed from equation to equation.
The regression coefficient estimates are statistically significant to almost all commodities. Both the linear and log-linear form of Engel function shows that the total cereals and cereal
Commodity Groups
Elasticities
Income Own-price Cross – price1
Cross – price2 Food grains 0.69 0.69 -0.40 0.13
Milk 0.77 0.78 -0.12 0.01
Meat Egg & Fish 1.20 1.19 -0.12 -0.06
Sugar 0.05 -0.05 0.62 -0.50
Other Food 0.14 0.14 -0.01 0.29 Fuel & Light -0.43 -0.33 0.43 -0.04 Clothing -0.23 -1.17 -0.69 2.26 Edible oil 0.43 0.43 -0.01 -0.34
Salt 0.23 -0.23 -0.28 -0.97
Other Non-food 0.22 2.23 -1.86 -0.68
Total food 0.20 0.20 0.05 0.03
substitutes are likely to be inferior goods. Commodities are classified as luxury and necessary goods based on the estimates, using both linear and log- linear Engel curves. Both functional forms results the similar grouping of commodities for both urban and rural sectors. For instance the commodities like cereal substitutes, pulses, edible oil, meat, egg and fish, vegetables, salt, spices, all food, pan, tobacco, and intoxicants fuel and light, taxes are likely to be necessaries and remaining items are luxuries in rural showed, by both the functional forms.
In this analysis, linear and log-linear forms of demand functions are estimated for urban and rural India separately. Most of the coefficient estimates are statistically significant. Both linear and log – linear demand function implies that food grains, milk, meat egg and fish, sugar, other food, fuel and light are necessaries and the remaining items are luxuries in Urban India. In rural sector, the commodities like Milk, fuel and light, clothing and total food are showed to be necessaries and the remaining items are luxuries by the two functional forms.
Table – 6: Estimates of Compensated Substitution Effects, Urban and Rural India, 1951-71
Commodities
Urban Rural
Cross - price-1 Cross - price-2 Cross - price-1 Cross - price-2 Food grains 0.194
(Milk) 0.587 (Other Non-food) 5.699 (Total food) 0.513
(Fuel & Light)
Milk 0.042
(Sugar)
0.210 (Other Food)
0.012
(Meat, Egg & Fish)
0.418 (Total food) Meat, Egg &
Fish 0.104 (Other food) 0.269 (Total Non-food) 0.040 (Other Food) 0.119
(Total Non-food)
Sugar 0.151
(Food grains) 0.061 (Milk) 0.061 (Other Food) 0.093
(Other Non-food)
Other Food 2.472 (Total food) 1.104 (Other Non-food) 0.059 (Edible Oil) 0.147 (Salt) Fuel & Light 0.547
(Total Non-food)
0.213 (Other Food)
0.023
(Meat, Egg & Fish)
0.146
(Other Non-food)
Clothing 0.524
(Other non-food) 0.305 (Total Non-food) 0.350 (Other Non-food) -0.077
(Total Non-food)
Edible Oil 0.384
(Other Non-food) 3.353 (Food grains) 0.127 (Other Non-food) 0.345 (Food grains)
Salt 0.030
(Food grains) 0.004 (Sugar) 0.051 (Food grains) 0.003 (Sugar) Other
Non-food
0.687
(Fuel & Light)
0.821 (Clothing) 0.724 (Other Food) 0.520 (Milk) Total Food 2.303
(Food grains)
0.267 (Sugar)
0.262
(Meat, Egg & Fish)
3.631
(Total Non-food)
References
[1] Allen, R.G.D. and A. L. Bowley, “Family Expenditure. A Study of its Variation”,
London: P.S. King and Son, 1935.
[2] Babu, Suresh Chandra N.B., “An Analysis of Demand for Food and Nutrition in
India”, Ph.D. Dissertation, Department of Economics, Iowa State University, Ames, Iowa, 1989.
[3] Bhattacharya, N.,“Studies on Consumer Behaviour in India”, ICSSR, vol.7, Econometrics, pp.176-232.
[4] Chandok, H L.,” “Wholesale Price Statistics, India, 1947-1978: Annual Series,
Volume 1 of Wholesale Price Statistics, India, 1947-1978, Economic and Scientific Research Foundation, 1978.
[5] Deaton, A. and J. Muellbauer. "An Almost Ideal Demand System." American Economic Review, vol. 70, pp. 312-326, 1980a.
[6] Deaton, A., “ Demand Analysis”, Hand Book of Econometrics, vol. III, edited by Griliches and M.D Intriligator, Elsevier Science Publishers BV, 1986.
[7] Deaton, A. and Muellbauer, “Economics and Consumer Behaviour”,
Cambridge University Press, New York, 1980.
[8] Deepankar, B and Basole, A., Fuelling Calorie Intake Decline: Household Level Evidence from Rural India,"World Development, Vol. 68, April 2015, pp. 82-95.2015.
[9] Desai, M., “Applied Econometrics”, Philip Allan Publishers Limited, 1976.
[10] Dissanayake, M. and Giles D.E.A.,“Household Expenditure in Sri Lanka: An Engle Curve Analysis”, Journal of Quantitative Economics,vol.4, No.1, January, 1988.
[11] Engel, E. (1857), "Die Productions- und Consumptionsverhaeltnisse des Koenigsre-ichs Sachsen," Zeitschriftdes Statistischen Bureaus des Koniglich Sachsischen Ministeriums des Inneren, No. 8 und 9, reprinted in the Appendix of Engel (1895).
[12] Green, H.A.J., “Consumer Theory”, Penguin Books Ltd, 1971.
[13] Henderson, J.M. and Quandt R.,“Microeconomic Theory A Mathematical Approach”, 3rd Edition McGraw – Hill Book Company, 1980.
[14] Intriligator, M.D., “Econometric Models, Techniques and Application”, Prentice –
Hall of India Ltd, 1980.
[15] Iyengar, N.S. and Jain L. R., “Changes in the Pattern of Consumption in India” Artha Vijana, Vol.16, Sep.1974.
[16] Iyengar, N.S. and Vani B.P.,“Estimation of Household Demand: Rural and Urban India, 1990, 2000 and 2010 A.D: An Exercise in Economic Forecasting”, Presented at the 25th The Indian Econometric Society Conference, Bangalore, 1988.
[17] Klien, L.R.,“An Introduction to Econometrics”, Prentice–Hall, Englewood Cliffs, 1962.
[18] Kumar, P., Kumar. A., Parappurathu, S. and S.S. Raju, “Estimation of Demand
Elasticity for Food Commodities in India”, Agricultural Economics Research Review, vol. 24, pp 1-14, January-June 2011.
[19] Mahajan, B.M., “Consumer Behaviour in India: An Econometric Study”, Concept Publishing Company, New Delhi, 1980.
[21] Prais, S. J., and H. S. Houthakker, “The Analysis of Family Budgets .Cambridge:
Cambridge University Press, 1955. (2nd edition, 1971).
[22] Philips, L., “Applied Consumption Analysis”, North Holland Publishing Company, Amsterdam, 1982.
[23] Powell, A.A., “Empirical Analytics of Demand Systems”, D.C. Health and Company Lexington, Mass. 1974.
[24] Ray, R., “Analysis of a Time Series of Household Expenditure Survey for India”,
Review of Economics and Statistics, pp.595-602, 1980.
[25] Roy, J., Chakravarty, I. M.and Laha, R. G, “A Study of Concentration Curves as a Description of Consumption Patterns, In: Studies in Consumer Behaviour, Indian Statistical Institute, Calcutta, 1959.
[26] Sathiyavan, D., “Consumption Pattern in India: A Time Series and Cross-section
analysis using NSS Data”, an unpublished M.Phil Thesis.1988.
[27] Stone, J.R.N., “Linear Expenditure Systems and Demand Analysis: An Application
to the Pattern of British Demand”, The Economic Journal, vol.LXIV, pp.511-527, 1954.
[28] Schultz, H., “The Theory and Measurement of Demand”, University of Chicago
Press; First Edition, 1938.
[29] Theil, H., “Theory and Measurement of Consumer Demand”, vol.11, North
An Investigation of Younger People's Perception of the Aged in
Rural and Urban Society
Dr. Asha Kumari
Introduction
In India, most of the aged persons are of the feeling that the younger do not care for them neither the ad-hear to their advices. They are a sought of stereotyped, they live in the Illusionory word; It is well know that when a person becomes aged his behavour tends to be like that of a child which is even said as Flight into childhood.
The younger generation of India, who lives in the joint family with the aged person as the head of the family under goes many circumstances with might be feverable as well as disfavouarable for him. The stereo typed eged generally like the younger generation to obey their commands listen to their advice; follow the tradition of the society, family and culture. At the time they do not feel that the time they have lived was different when compared to the present time, now the younger generation has his own motives to achieve, separate goals, which are not possibly available by the old traditional ways.
As the youth always have face new problems and difficulties in the modern age it is not necessary that they have the solution to all that happens or them many take the shelter of aged as they know that experience always counts ox them there are some. Who are not willing to take the aid and feel the aged people as hopeless, that all may differ from funal to Urban and male to female? As in our Indian society the girls have to face a lot of restrictions in the house from the aged thus they feel that their desires are being attacked upon and suppressed, Father is may be right to the niew point or wrong they do not care.
Youth also feel that the aged person, as they have excees of time go on gossiping and axaggerating about even a small matter, they need same one to talk to and to look after them for which the youth feels that its no use wasting time on them yes, If the aged is aconomically well established, there's no other person better than him. But this only matter's in same conditions. The youth generally care for the loving elders, who do not disturb them in their business, do not give a lot of advice do not pose obstacle in their path etc.
One the countarary our ageds have their own specific feeling as the youth. The aged always like that the younger generation shouid be obedient towards them to some extent up to where the right way or advice our attitude is concered its even good and right but then the aged try to turn the mind or the youth towards their own traditional system then the controversy appears as know that the youth generally try to avoid such advice which effects their modern trend.
The aged when annoyed with their children start multesing to them seiver then the youth feels that this person has gone mad. But its a matter of thought that what the eged is saying might have been right during his time or would have yielded good results but as the situation has changed ago has changed time has passed the some theory need not be fruitful again and the youth might have to suffer a loss.
Hypotheses
The present a study was proposed to assess the relationship between some sociocultural factors and perception of younge people towards the weaker section of the society aged Besides, the specific purpose were to assess the differences in the perception of younger people about the weaker section, aged people, namely younger people of rural and urban families. In the study the term weaker section people has been used in place of aged.
The theorctical hypotheses with respect to the above purposes were formulated for verification :- (ii) Younger people of different educatinal levele would differ signnificently interns of their perception or the weaker section people/aged in both the groups.
Method of investigations Sample
A rendom sample of 400 younger people of joint family were selected out of which 200 each rural and Urban were used as subjects in this study Their ages renged from 25-35 years with a meen ago of 32-51 years.
Tests:- (ii) For measuring perception of younger people towards age the scale designed by kogen (1961) was edopted and developed in Hindi with respect to norms and individual differences.
Results and Discussion
As mentioned earlier, the main purpose of this study was to Investigato "Perceptiion of younger people towards the aged" in relation to educational fevels Ox rural and urban respondents (Subjects of 15 to 25 years of age). Three hypotheses were for mulated and for their verification two tests excluding personal date blank sheet were administered on 800 younger people ox rural and urban population.
Before making an attempt to find our opnion of younger people twords the aged, it was desirable to test the normality or distributions of "Younger people's perception scores towards aged for the two groups namely rural and arben joint femily. for this purpose the chi-S Squrare (x2) test was applied and an attempt was made to see whether the distributioons of scores departed significantly from the normal distribution or not?
It is to mention here that only educational and economical levels of the respondents have been identified with the help or socio-economic scale by kuppuswamy.
TABLE - 1
Chi-source (x2) test of normal distribution of opinion scores of urban younger people
N = 200
Class Interval fo fe chi-squire(x2)
33-35 2 1.60
30-32 8 9.07
27-29 30 28.98
24-26 51 53.31 1.67 21-23 63 57.09
18-20 30 34.67 15-17 12 12.21
13-14 4 2.43
Mean = 18.36 S.D. = 13.46, df= S*, P-Value=N.S.