56
International Journal of Pharmaceutical Sciences and Drug Research 2019; 11(2): 56-60
RESEARCH ARTICLE
CODEN (USA): IJPSPP
ISSN: 0975-248X
Development and Validation of RP-HPLC for Estimation of Neratinib
in Bulk and Tablet Dosage Form
M Lakshmi Kanth
*, B Raj Kamal
Mewar University, NH-79, Gangrar, Chhitorgarh-312901, Rajasthan, India
Copyright © 2019 M Lakshmi Kanth et al. This is an open access article distributed under the terms of the Creative Commons Attribution-NonCommercial-ShareAlike 4.0 International License which allows others to remix, tweak, and build upon the work non-commercially, as long as the author is credited and the new creations are licensed under the identical terms.
ABSTRACT
An accurate RP-HPLC method developed for the estimation of Neratinib in bulk and tablet dosage form. The method is and validated for parameters linearity, accuracy, suitability, specificity, precession, LOD, LOQ and robustness. An Altima column (150 mm × 4.6 mm × 5µ) used for chromatographic separation within a runtime of 6 min. The mobile phase buffer (monopotassium phosphate) and acetonitrile (60:40 v/v) with 0.1% formic acid is used. The flow rate maintained at 1.0 ml/min with the effluents monitored at 215 nm. The Neratinib analyzed at retention time of 4.001. The concentration linear over 30-180µg/ml with regression equation y = 6065.6x + 795.43 and regression co-efficient 0.999.
Keywords: Neratinib, antineoplastic activity, ICH Guidelines, method validation.
DOI: 10.25004/IJPSDR.2019.110202 Int. J. Pharm. Sci. Drug Res. 2019; 11(2): 56-60
*Corresponding author: Mr. M. Lakshmi Kanth
Address: Mewar University, NH-79, Gangrar, Chhitorgarh-312901, Rajasthan, India Tel.: +91-7675851984
E-mail: [email protected]
Relevant conflicts of interest/financial disclosures: The authors declare that the research was conducted in the absence of any commercial or financial relationships that could be construed as a potential conflict of interest.
Received: 29 January, 2019; Revised: 13 March, 2019; Accepted: 19 March, 2019; Published: 30 March, 2019
INTRODUCTION
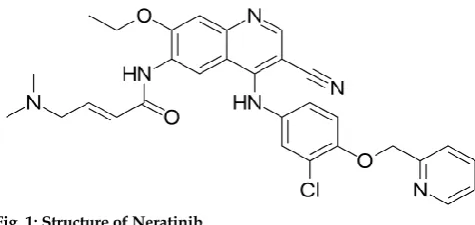
Neratinib is 6, 7-disubstituted-4-anilinoquinoline-3-carbonitrile that exhibits antineoplastic activity and acts
as inhibitor of the HER-2. [1] Neratinib reduces auto
phosphorylation in cells by binding to HER-2 receptor
irreversibly. [2-3] Phase I examination of single agent
Neratinib administration showed a Cmax of 5.8-119
ng/mL over a 40 to 400 mg dose range. [4-7] Chemically
Neratinib is (E)-N-[4-[3-chloro-4-(pyridin-2-ylmethoxy) anilino]-3-cyano-7-ethoxyquinolin-6-yl]-4-(dimethyl
amino)but-2-enamide with molecular formula
C30H29ClN6O3 and molecular weight 557.051 g/mol (Figure 1). Literature survey reveals that few UV Spectroscopy, fluorescence spectroscopy, HPLC and
LC-MS/MS methods [8-13] were developed for
determination of Neratinib in both human plasma and pharmaceutical dosage forms. The present research is
novel and validated as per ICH guidelines. [14]
MATERIALS AND METHODS
Neratinib was kindly gifted from Hetero Drugs Ltd.
Hyderabad. Commercially available NERLYNX®
(Neratinib 4 mg) tablet procured from local market.
Acetonitrile (Finar reagents), monopotassium
phosphate and phosphoric acid (S D fine Chem limited), formic acid (Fisher scientific) were used without further purification.
Quantitative HPLC used is of Waters Alliance 2695 system with Empower-2 Software. An Altima column (150 mm × 4.6 mm × 5µ) selected for elution of drug. The UV Spectrometer PG Instruments T60 used for analysis.
Preparation of Neratinib Standard Solution
About 0.012 g of Neratinib working standard accurately weighed into a 10 ml standard flask. Contents dissolved in 7ml of diluent and sonicated for 25-30 minutes. The contents made up to the mark with diluents. This is considered as the stock solution.
Preparation of Neratinib Working standard
10 ml of prepared stock solution taken into 100 ml volumetric flask, made up to mark with diluents to obtain Neratinib working standard of 120µg/ml.
Preparation of Neratinib Sample
Neratinib capsule powder weight equivalent to 12 mg of Neratinib taken in 10 ml volumetric flask. Diluents added till the mark and sonicated for 20-30 min and filtered. 1 ml of stock solution taken into 10 ml volumetric flask, made up to 10 ml with diluents to produce 1200µg/ml.
Preparation of Buffer
The buffer prepared by mixing 1.36 g of monopotassium phosphate with 900 ml of milli-Q water. Contents degassed and made up to 100 ml volume with water. Phosphoric acid used to adjust the pH of contents to 3.0. 100 mL of formic acid mixed with 100 mL of water to obtain 0.1% formic acid.
HPLC Conditions
The solvent A comprises of 0.01M disodium hydrogen orthophosphate (pH 3.0), Solvent B comprises of Acetonitrile with 0.1% formic acid. The contents mixed thoroughly, filtered through poly-tetra-fluoro ethanol (PTFE) filter of 0.45µm pore size. The contents degassed by sonication. The eluents monitored at 215 nm with a run time maintained at 6 min. The column must be equilibrated for 25-30 min prior to the sample analysis.
Analytical Method validation
Method validation includes testing of system suitability, specificity, linearity, accuracy, precision and robustness of the method developed.
Linearity
The ability of developed procedure obtain test results proportional to concentration of sample is measured. The method is considered valid if the correlation
coefficient (r2) > 0.998. The linearity of Neratinib was
evaluated for concentrations of 30-180µg/ml.
Specificity
The analysis results of samples spiked with impurities, degradation products were compared to the results of
pure samples containing no impurities or degradation products to analyse the specificity of the developed HPLC method.
System suitability
The evaluation of area under curve, resolution, retention time, tailing factor and plate number was performing to check the system suitability. The %RSD for system suitability parameter of Neratinib are within acceptable limit.
Precision
The intraday and interday precision of Neratinib standard and sample determined and results expressed in %RSD to check the precision of developed method. The interday and intraday precession studies of Neratinib carried out at different concentrations (30, 90 and150µg/ml) and results found within the acceptable limit
Limit of detection (LOD) and Limit of quantification (LOQ)
The LOQ and LOD of the developed method were evaluated by considering parameters like signal-to-noise ratio (S/N) and peak-to-peak ratio around the RT of Neratinib. The S/N ratio of 3 is accepted for LOD and a value of 10 is accepted for LOQ. The LOD (0.43 ppm) and LOQ (1.31 ppm) values of Neratinib were within the acceptable limit.
Robustness
The capacity of developed method to stay unaffected by minimal variations in method parameters is analysed. The samples analysed by varying different optimized parameters like detection wavelength, flow rate, injection volume and mobile phase composition. The effect of all these parameters determined.
RESULTS Linearity
Five standard solutions of Neratinib of concentrations 30-180µg/ml were injected and results tabulated (Table 1). A graph of concentration vs peak are plotted with
slope of 6065.6, Y-intercept 795.4 and r2 (correlation
co-efficient) of 0.999. Regression equation of Neratinib was y = 6065.6X+795.4 (Figure 2).
Specificity
Specificity was tested by evaluating chromatogram of blank run and standard Neratinib (Figure 3, 4). These showed that no peaks, interfering peaks or baseline noise was observed.
System Suitability
The system suitability of developed method was analyzed by injecting the Neratinib working standard six times. The suitability of method evaluated from percentage relative standard deviation of RT, USP plate
count, peak area and USP tailing factor (Table 2). [14]
Assay studies
Six homogeneous samples of Neratinib sample and standard analysed. The % assay of the Neratinib in the formulation estimated. The Neratinib sample and
standard RT were similar i.e. 4.001. [10] From Table 3, it
Int. J. Pharm. Sci. Drug Res. March-April, 2019, Vol 11, Issue 2 (56-60) 30-180µg/ml for Neratinib. The % assay of marketed
Neratinib drug found to be 99.76% (Table 3).
Table 1: Calibration data of Neratinib
Linearity Level (%) Concentration (µg/ml) Area
25 30 259635
50 60 358945
75 90 448155
100 120 685499
125 150 948512
150 180 1099245
Table 2: System suitability data of Neratinib
S. No
Name of the drug & conc (120µg/ml)
RT
(min) Peak Area USP Plate Count Tailing USP
1 Neratinib (std) 4.001 730064 7325 1.69
2 Neratinib (std) 4.002 723381 7386 1.68
3 Neratinib (std) 4.003 721505 7291 1.69
4 Neratinib (std) 4.004 720970 7243 1.68
5 Neratinib (std) 4.008 726077 7254 1.69
6 Neratinib (std) 4.013 719446 7602 1.67
Mean 723574
Std. Dev. 3912.1
%RSD 0.5
Table 3: Assay data Neratinib
Sample No Retention time %Assay
1 4.001 99.89
2 4.003 99.40
3. 4.008 99.44
4. 4.013 100.04
5. 4.004 100.16
6. 4.002 99.61
Avg 4.005 99.76
SD 0.3166
%RSD 0.32
Table 4: Intra-day precision data of Neratinib
Level Low Middle High
Concentration (µg/ml) 30 90 150
Peak area Session 1 256985 445698 948565
Session 2 263845 448756 958925
Session 3 254416 458951 945698
Avg. peak area 258415.33 451135 951062.66
SD 4874.51 6939.39 6958.242
%RSD 1.88 1.53 0.73
Table 5: Inter Day precision data of Neratinib
Level Low Middle High
Concentration(µg/ml) 30 90 150
Peak area day 1 255894 446985 945845
day 2 248556 458911 958589
day 3 252697 455892 945289
Avg. peak area 252382.3 453929.3 949907.66
SD 3679.10 6200.51 7523.3
%RSD 1.45 1.36 0.79
Table 6: Accuracy data of Neratinib
S. No Spiked level % Recovery % RSD
1 80% 99.38
0.52
2 100% 100.02
3 120% 98.99
Precision
Intra-day precession was performed for concentration levels 30µg/ml, 90µg/ml and 150µg/ml within the
same day at three different times session 1, session 2 and session 3.
Inter-day precision was carried by conducting at different concentration 30µg/ml, 90µg/ml and 150µg/ml level on three different days, using same homogeneous samples.
The %RSD values for both inter-day and intra-day precision were found within acceptable limit. Results tabulated in Table 4 and Table 5.
Table 7: Robustness data of Neratinib
Parameter %RSD
Flow Minus 0.6
Flow Plus 0.5
Mobile phase Minus 0.4
Mobile phase Plus 0.6
Temperature minus 0.4
Temperature plus 0.5
Fig. 2: Calibration Curve of Neratinib
Fig. 3: Blank chromatogram
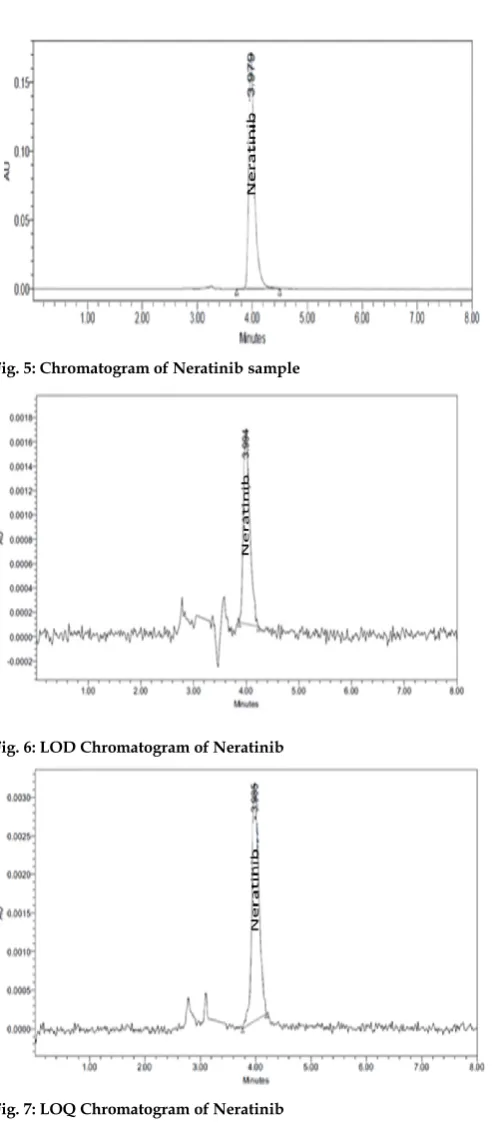
Fig. 5: Chromatogram of Neratinib sample
Fig. 6: LOD Chromatogram of Neratinib
Fig. 7: LOQ Chromatogram of Neratinib
Limit of Detection (LOD) and Limit of Quantification (LOQ)
LOQ and LOD values for Neratinib were 0.43ppm and 1.31ppm respectively (Figure 6 and Figure 7).
Accuracy
The accuracy of developed method is determined for three concentration levels of 80%, 100% and 120% by recovery experiment. The results established by performing recovery studies on three replicates of three concentrations by adding known amount of Neratibin. Results found within the acceptable limit (Table 6).
Robustness
Six samples in each case analysed by altering flow rate, mobile phase composition and column temperature. The %RSD in each case evaluated and results were within acceptable limits (Table7).
DISCUSSION
A simple, accurate and linear RP-HPLC method developed for estimation of Neratinib. The mobile phase comprises of buffer (potassium dihydrogen orthophosphate) and acetonitrile in the ratio of 60:40 (v/v) with 0.1% formic acid with retention time of 4.001 min. The developed method was validated for various parameters as per ICH guidelines. The linearity of developed method was established for concentration of 30-180µg/ml with regression coefficient value of 0.9998 indicating high precision of the method. The system suitability data are within the acceptable limit. The percentage assay of Neratinib was 99.76% indicating non-interference of the common excipients used in the formulation. The limit of detection (LOD) and limit of quantification (LOQ) for Neratinib were 0.43ppm and 1.31ppm respectively.
REFERENCES
1. Minami Y, Shimamura T, Shah K, LaFramboise T, Glatt KA,
Liniker E, Borgman CL, Haringsma HJ, Feng W, Weir BA, Lowell AM, Lee JC, Wolf J, Shapiro GI, Wong KK, Meyerson M, Thomas RK. The major lung cancer-derived mutants of ERBB2 are oncogenic and are associated with sensitivity to
the irreversible EGFR/ERBB2 inhibitor
HKI-272. Oncogene. 2007;26(34):5023–7.
2. Krishnan S, Miller RM, Tian B, Mullins RD, Jacobson MP,
Taunton J. Design of reversible, cysteine-targeted Michael acceptors guided by kinetic and computational analysis. J Am Chem Soc. 2014;136(36):12624–30.
3. Singh J, Petter RC, Baillie TA, Whitty A. The resurgence of
covalent drugs. Nature reviews. Drug discov. 2011;10(4):307– 17.
4. Kwak E. The role of irreversible HER family inhibition in the
treatment of patients with non-small cell lung cancer. The oncologist. 2011;16(11):1498–507,
5. Bose P, Ozer H. Neratinib: an oral, irreversible dual
EGFR/HER2 inhibitor for breast and non-small cell lung cancer. Expert Opin Investig Drugs. 2009;18: 1735–1751.
6. Tanveer AW, Ahmed HB, Abounassif MA, Zargar S. Study of
Interactions of an Anticancer Drug Neratinib with Bovine Serum Albumin: Spectroscopic and Molecular Docking Approach. Front Chem. 2018; 6: 47.
7. Chandrasekaran A, Shen L, Lockhead S, Oganesian A, Wang
J, Scatina J. Reversible covalent binding of neratinib to human
serum albumin in vitro. Drug Metab Lett. 2010; 4(4):220-7.
8. Maher H. Development and validation of a
stability-indicating HPLC-dad method with ANN optimization for the determination of diflunisal and naproxen in pharmaceutical tablets. Journal of Liquid Chromatography & Related Technologies 2014; 37(5):634-652.
9. Tanveer AW, Seema Z, Ajaz A. Ultra Performance Liquid
Chromatography Tandem Mass Spectrometric Method Development and Validation for Determination of Neratinib in Human Plasma. S Afr J Chem. 2015:6893-98.
10. Abbas R, Hug BA, Leister C, Burns J, Sonnichsen D.
Pharmacokinetics of oral neratinib during co-administration of ketoconazole in healthy subjects. Br J Clin Pharmacol. 2011; 71: 522–527.
11. Brian FK, Robert AP, Alvin W, Kiana K, Samuel J, Jan HB.
Int. J. Pharm. Sci. Drug Res. March-April, 2019, Vol 11, Issue 2 (56-60) inhibitor neratinib in human plasma. J Pharm Biomed Anal.
2017; 134: 130–136.
12. Afnan HZ, Nehal NK, Sundus AI, Wafaa NA, Maher HM. Micelle‐enhanced direct spectrofluorimetric method for the determination of linifanib: Application to stability studies. Luminescence. 2017; 32(7):1162-1168.
13. Dong Q. Determination of Neratinib Tablets by HPLC. Food
and Drug.2016;4: 280-282.
14. International Conference on Harmonization, ICH Guidelines,
Validation of Analytical Procedures Technical Requirements for Registration of Pharmaceuticals for Human Use: Text and Methodology Q 2 (R1), International Conference on
Harmonization, Geneva, Switzerland, November 2005.