Abstract— This paper presents a study of the effect of various CO2 injection modes on miscible flood performance for a reservoir in Malaysia. Using a black oil numerical simulator, four injection techniques namely continuous, simultaneous water and gas (S WAG), water alternate gas (WAG) and hybrid WAG; were simulated on the reservoir. From the results of the simulations, the respective optimum injection modes for this case study reservoir were established. Comparing all the various optimum CO2 injection modes, S WAG injection with a CO2 injection rate of 15,000 Mscf/d and a S WAG ratio of 1:1 is the most efficient recovery method for the reservoir. This is because it yields the highest recovery factor of 54.8% OOIP, a water cut that is below the limit of 0.9 and a relatively low CO2 breakthrough.
Index Term— Carbon Dioxide, Enhanced Oil Recovery, Miscible Injection, S imulation
I. INTRODUCTION
A large number of producing fields in Malaysia are entering the maturing stage for primary and/or secondary depletion with declining oil rates and increasing water cut and GOR trend. The average oil recovery factor for the producing field s is 37%. This means that there is still a substantial amount of the remaining-oil-in place that could potentially be recovered
through tertiary recovery or EOR. Carbon dioxide (CO2)
miscible flooding has been identified to be the most amenable EOR process for these fields [1]. However, to fully optimize the oil recovery from the process, the most effective injection mode must be determined.
The increasing oil price and the burgeoning demand for petroleum products as a source of energy as well as the limited oil reserves have accelerated the effort to further extend the production life of reservoirs. Traditional primary recovery methods as well as secondary recovery techniques can only recover around one third of the Original Oil In Place (OOIP) [2]. Enhanced Oil Recovery (EOR) has been employed to further extract oil from the reservoir thus increasing the ultimate recovery in a reservoir with relatively
F. M. Nasir is with the Universiti T eknologi PET RONAS, Bandar Seri Iskandar, T ronoh, Perak, Malaysia, (phone: 3687059; fax:
605-3655670; e-mail: faiza_mnasir@ petronas.com.my). Y.Y. Chong., is with Petroleum Engineering Department,
PET RONAS Carigali Sdn Bhd, Malaysia. (e-mail: [email protected]).
economical costs. EOR is widely practised by many oil producing nations especially those having aging oil fields with reserves declining faster than the discovery of new oil reserves.
A screening study conducted by PETRONAS has identified that 52 out of 72 Malaysian reservoirs are technically feasible for the application of new EOR processes [3]. An additional 1 billion barrels of crude oil is estimated to be potentially recoverable from Malaysian oil fields through the application of these EOR processes [1].
CO2 flooding can either be miscible or immiscible depending
on the Minimum Miscible Pressure (MMP). Immiscible flooding occurs when the pressure is below the MMP where
CO2 does not form a single phase solution with the
hydrocarbons in the reservoir. Miscible flooding on the other hand forms a single phase solution with the hydrocarbon reservoir when injected and in contact with the hydrocarbon at a pressure above the MMP.
II. CO2INJECTIONTECHNIQUES
A. Continuous CO2 Injection
This technique involves injecting a certain amount of CO2
continuously until the required slug size is reached. In a simulation study performed by Rached Hindi, C.T. Cheng and
Ben Wang [4] to assist in the design of CO2 flood process for
Roberts Unit, Wasson Field, Yoakum County, Texas , the ultimate recovery of oil was observed to be proportional to the
total CO2 injected. Exxon [5] conducted a study on the Means
CO2 flooding project to determine the effects of varying
solvent bank sizes on oil recovery and similar results were obtained. The conclusion drawn by the study was that the larger the bank size the greater the ultimate recovery, but the increment gets smaller and smaller. One major problem faced by this technique is the formation of viscous fingers that propagates through the displaced fluid leaving much of the
hydrocarbon not contacted. This is due to the fact that CO2
has a lower viscosity compared to oil and it results in an adverse mobility ratio. Significant cross -flow of mobilized oil occurs as a result of fluid pressure gradients and the effects of buoyant and capillary forces between porous layers in a reservoir where vertical permeability exists.
B. WAG
The WAG or Water-Alternate-Gas technique is a combination of two traditional improved hydrocarbon recovery
The Effect of Different Carbon Dioxide Injection
Modes on Oil Recovery
techniques; waterflooding and gas injection. Waterflooding and the gas flooding cycles are alternated with the design parameters being the cycle timing and the ratio of water to gas.
The main objective is to reduce CO2 channeling by filling the
highly permeable channels with water to improve sweep
efficiency during CO2 injection. Optimum conditions of oil
displacement by WAG processes are achieved when the velocities of the gas and water are the same in the reservoir. The optimum WAG design varies from reservoir to reservoir and for a specific reservoir, it needs to be determined and possibly fine tuned for patterns within the reservoir. In an experiment on WAG performed by Chevron [5], the WAG ratio was increased from 1:1 to 3:1 and with each successive increase in the water to gas ratio, the oil recovery factor increased. Some advantages of the WAG process include
higher CO2 utilization, reduced CO2 production and greater
ultimate recovery. Some of the complications faced by WAG
are slower oil response, gravity segregation due to density
difference between CO2 and water, interruption by water on the
continuity of the extraction process by the CO2 slug and loss
of injectivity.
C. SWAG
SWAG injection involves injecting both water and CO2
simultaneously into the reservoir. The mixing of CO2 and water
in a SWAG injection can be at the downhole or on the surface. Surface mixing usually occurs at the well, drill site or at the central processing facility (CPF). The objective of this technique is to reduce capital and operating cost and at the same time, improve the sweep efficiency of waterflooding and
miscible CO2 flooding. This will reduce the impact of viscous
fingering and will result in an improvement in gas handling and oil recovery [6, 7]. SWAG can improve the profile control relative to WAG injection and continuous injection. SWAG is a means to reduce the capillary entrapment of oil in small scale reservoir heterogeneity, providing a better mobility control of gas compared to WAG. However, one of its short-comings is
insufficient CO2 availability at the flood front to saturate the oil
and reduce its viscosity. Hence a substantial volume of carbonated water is required to saturate the residual oil and to reduce its viscosity and cause it to flow. The use of carbonated waterflood has been proposed in low permeability and naturally fractured reservoirs [7]. Injection of water with dissolved gas may reach and recover oil from places where it
otherwise is trapped.
D. Hybrid WAG
In light of the early favorable single slug injection and the overall higher recovery by the WAG technique, the hybrid WAG was introduced. In this proces s, a large fraction of the
pore volume of the CO2 is continuously injected to about 20%
to 40% HCPV and the remaining fraction is then injected using WAG technique at a specific WAG ratio [5]. In a simulation
study performed by Rachel Hindi et al, a lower initial CO2 slug
size was preferred [4]. Their findings showed little effects on
the recovery factor when the initial CO2 slug size increased
from 10% to 16% HCPV. The lower initial slug size of 10% was chosen as the optimum injection strategy. The advantages of hybrid processes are the early production response associated with continuous injection methods, better injectivity, minimization of water blocking, greater ultimate recovery and
higher CO2 utilization as compared to that for the WAG
process [5].
III. RESERVOIRDESCRIPTION
Reservoir A, the case study area, is located offshore Sarawak in Malaysia. It has no primary gas cap and the original pressure of the reservoir is assumed as the bubble point pressure. The primary drive mechanism of the reservoir is depletion drive accompanied by weak aquifer. At the later stage of the reservoir life, drive by the aquifer becomes more prominent as water injection scheme is implemented. The average reservoir parameters are shown in Table I.
TABLE I
Reservoir A averaged parameters
Re se rvoir Parame te rs Ave rage Value
Depth 7,830 ft ss
T hickness 128 ft
Porosity 17.50%
Permeability 70 mD
Initial Reservoir T emperature 202 °F
T emperature 176 °F
Initial Reservoir Pressure 3,420 psi
Oil Gravity 42 °API
Oil Viscosit y 0.3 cP
Initial Oil Formation Volume Factor 1.55
The reservoir has an estimated Stock Tank Oil in Place (STOIIP) of 92.8 MMstb and the Ultimate Recovery (UR) is expected to be 62.2 MMstb. To date, cumulative production is about 24% of STOIIP with a daily production of 4600 stb of oil and water cut stands at 34%. Production in this reservoir started in 1972 under natural drive and in 1994, it underwent a water injection scheme. There are altogether 16 producer wells and 4 injector wells.
IV. SIMULATION MODEL
The base 3D model for reservoir A was constructed using 500x500 ft grid size with 12 vertical layers. The optimized dimension is 33x29x12 yielding a total number of 11,484 gridblocks. It has been history-matched from 1972 to 2000. The model was run for 16 years using a numerical black-oil
simulator. The solvent gas injected is pure CO2 with a
Todd-Longstaff mixing parameter of 0.667.
Using this as the base model, the optimum injection mode for continuous, WAG, hybrid WAG and SWAG were determined
V. SIM ULATIONSTUDIES
A. Study 1: Continuous CO2 injection (varying injection
rate)
The focus of this study is to analyze the effects of CO2
injection rate on the recovery factor and to determine the
optimum CO2 injection rate for the reservoir. CO2 was injected
continuously into the reservoir. Five cases with different injection rates, 10,000 Mscf/d, 15,000 Mscf/d, 20,000 Mscf/d, 25,000 Mscf/d, 30,000 Mscf/d and 35,000 Mscf/d were simulated.
B. Study 2: CO2 WAG injection (varying WAG ratio)
Using the model as defined for the continuous injection, the effects of varying WAG ratio on the recovery factor were studied and the optimum WAG ratio was determined . The
optimum CO2 injection rate determined in Study 1 was used as
the injection rate for this study. Injection of water and CO2
were implemented alternately through the same injectors at their respective intervals. Five cases with different WAG ratios were simulated and evaluated. They were 1:1, 1:2, 1:3, 1.5:1 and
2:1. The CO2 injection rate remained constant but the water
injection rate was varied for all the five cases according to their water to oil WAG ratio. The water injection rate required to make up to the WAG ratio was determined using the equation below.
w CO CO
B
ratio WAG B
Q Rate Injection
Water 2 2 …….[Equation 1]
The cycle time for the WAG injections for all the five cases was set for a year.
C. Study 3: CO2 WAG injection (varying cycle time)
Using the optimum WAG ratio model from Study 2, the effects of varying cycle time on the recovery factor were studied and the optimum cycle time for reservoir A were
determined. With the WAG ratio and CO2 injection rate fixed,
five cases with varying cycle time of 6 months, 1 year, 1.5 years, 2 years and 3 years were simulated.
D. Study 4: CO2 hybrid WAG injection (varying CO2
initial slug size)
Using the optimum WAG injection mode for the WAG portion of the hybrid WAG and the optimum injection rate for
the initial CO2 injection rate, the effects of varying CO2 initial
slug size on the recovery factor for hybrid WAG were studied and the optimum hybrid WAG strategy for the reservoir was
determined. Five cases with varying CO2 initial slug size; 10%
HCPV, 20% HCPV, 30% HCPV, 40% HCPV and 50% HCPV were simulated. The initial slug size was defined by prolonging the
cycle time of the initial CO2 injection until the required initial
slug size was met.
E. Study 5: CO2 SWAG injection (varying injection rate)
The focus of this study was to analyze the effects of CO2
injection rate for SWAG injection on the recovery factor and to
determine the optimum SWAG CO2 injection rate. Using the
base model, the injectors at respective locations were
duplicated as both CO2 and water were injected simultaneously
into the reservoir. Five CO2 injection rates were modeled. They
were 5,000 Mscf/d, 7,500 Mscf/d, 10,000 Mscf/d, 12,500 Mscf/d and 15,000 Mscf/d. The SWAG ratio was fixed at 1:1 and the accompanying water injection rates were determined using Equation 1.
F. Study 6: CO2 SWAG injection (varying SWAG ratio)
Using the optimum SWAG CO2 injection rate, the effects of
varying SWAG ratio on the recovery factor were studied. Five SWAG ratios were simulated and evaluated. They were 1:1, 1:2,
1:3, 1.5:1 and 2:1. The CO2 injection rate remained constant but
the water injection rate varied for all the five cases according to their water to oil SWAG ratio. Calculations for the required water injection rate to make up the SWAG ratio were determined using Equation 1.
VI. RESULTS&DISCUSSION
A. Study 1: Continuous CO2 injection (varying injection
rate)
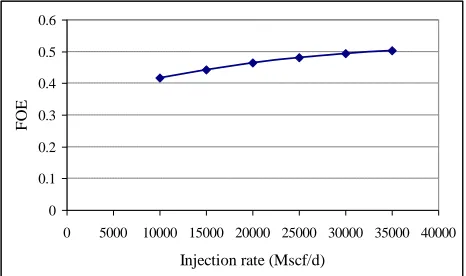
Fig. 1 shows the oil recovery factor (or FOE) for various CO2
injection rate. Recovery factor was observed to increase with
increasing injection rate. Increasing the injection rate increased
the injected volume of CO2. Due to the fact the model was
assumed to be miscible at first contact in this simulation, residence time did not affect the degree of miscibility. Therefore, the recovery factor was dependent on the volumetric sweep provided by the injection rate and was not significantly affected by the residence time. The incremental increase in recovery factor decreased with increasing injection rate as observed in Fig. 1. This was because the higher the
injection rate of CO2, the earlier water and CO2 breakthrough
would be and a higher value of water cut and CO2 production
was yielded.
0 0.1 0.2 0.3 0.4 0.5 0.6
0 5000 10000 15000 20000 25000 30000 35000 40000
Injection rate (Mscf/d)
F
O
E
Two of the highest recovery factors were yielded by injection rates 35,000 Mscf/d and the 30,000 Mscf/d with the recovery factor of 51.6 and 51.4% respectively. Taking the water cut limit to be 0.9 and since the incremental recovery factor between the two injection rates was not very significant, the injection rate of 30,000 Mscf/d was taken to be the optimum injection rate. It
yielded a lower CO2 as well as water production.
B. Study 2: CO2 WAG injection (varying WAG ratio)
The recovery factor as observed in Fig. 2 increase with
increasing water to CO2 WAG ratio. The WAG process
affected the cyclic accelerations in the oil recovery resulting from the improved mobility ratio. Taking a WAG ratio of 1:1 as the base case, the incremental increase of recovery factor
decreased with increasing CO2 portions as seen in Fig. 4. Well
water cut increased with increasing WAG ratio. The reason is because at higher WAG ratio, the amount of water injected into
the well increased while the CO2 injected remained constant.
Taking the water cut limit as 0.9, the 1:1 WAG ratio was the most optimum WAG ratio as it gave a high recovery factor very close to that of 1.5:1 and 2:1 and yet with water cut below 0.9.
C. Study 3: CO2 WAG injection (varying cycle time)
From the results of the simulation, the recovery factor was not significantly affected by the cycle time. This could be seen by the insignificant difference in the recovery factor yielded by all the different cycle times in Fig. 3.
One of the reasons for the small deviations is that even though the time cycle varied, the injected volume of each fluid remained quite the same. However, there was a small increase in recovery factor with decreasing cycle time. One of the deductions that can be made is that in having a long cycle time, the occurrence of gravity segregation of water was greater as compared to the gravity segregation of water in a shorter time cycle as the very close alternating nature of WAG reduced the severity and potential occurrence of gravity segregation.
Fig. 2. Recovery Factor (FOE) for CO2 WAG injection at various WAG ratios
0 0.1 0.2 0.3 0.4 0.5 0.6
29 31 33 35 37 39 41 43 45
Years
F
O
E
6 months 1 year 1.5 years 2 years 3 years
Fig. 3. Recovery Factor (FOE) for CO2 WAG injection for various cycle time
A more distinct variation in the recovery factor with time
cycle is expected from an immiscible CO2 WAG injection as not
only does the gravity segregation occur in the water phase,
but also in the CO2 phase. Potential viscous fingering and
gravity segregation of CO2 gaseous phase might further reduce
the recovery factor for a longer time cycle. Results showed that the 6 months time cycle is the optimum time cycle as it yields the highest recovery factor of 54.7% even though the recovery factor was not significantly larger than the others. Hence the optimum WAG injection strategy for reservoir A is set to be at 1:1 WAG ratio and an injection rate of 30,000 Mscf/d with a time cycle of 6 months .
0.4 0.45 0.5 0.55 0.6
0 0.5 1 1.5 2 2.5
WAG ratio
F
O
E
0 0.5 1 1.5 2 2.5 3 3.5
Time Cycle (years)
CO2 volumetric ratio Time Cycle
Fig. 4. Effect of CO2 WAG ratio and time cycle on oil recovery
D. Study 4:CO2 hybrid WAG injection (varying CO2 initial
slug size)
From Fig. 5, the recovery factor is seen to increase with
smaller initial CO2 slug size. One of the reasons for the
application of hybrid WAG is the higher initial response
yielded by the initial CO2 slug flooding. It was observed that
the initial production rate was highest for the 50% initial slug size. On the other hand, the recovery factor yielded by the 50% initial slug size was the lowest compared to the 10% initial slug size which yielded the highest recovery factor of 53.9%. The lower initial slug size of 10% which was lower than the 16% was later chosen as the optimum injection strategy. Thus for
reservoir A, the optimum CO2 hybrid WAG injection strategy is
injection rate of 30,000 Mscf/d with a time cycle of 6 months yielding a recovery factor of 53.9%.
Fig. 5. Recovery factor (FOE) for CO2 hybrid WAG injection for various initial CO2 slug size
E. Study 5: CO2 SWAG injection (varying injection rate)
The SWAG simulation performed here was of 1:1 SWAG ratio. From Fig. 6, recovery factor is observed to increase with increasing injection rates. This is because the higher the
injection rate, the higher the total amount of CO2 was injected
leading to higher ultimate recovery [4]. Taking a CO2 injection
rate of 15,000 Mscf/d as the base case, the incremental increase in recovery factor decreased with increasing flow rate as can be seen in Fig. 8. The highest recovery factor of 54.8% was
yielded by an injection rate of 15,000 Mscf/d. CO2 injection at a
rate 15,000 Mscf/d is the most optimum injection rate as it yielded the highest recovery factor of 54.8% and at the same time below the water cut limit of 0.9.
Fig. 6. Oil production rate (FOPR) for CO2 hybrid WAG injection for various injection rates
F. Study 6: CO2 SWAG injection (varying SWAG ratio)
In Fig. 7, recovery factor is seen to increase with increasing SWAG ratio. The incremental increase of recovery factor was
observed to decrease with increasing water volume fractions. At higher SWAG ratio, the amount of water injected into the well increased due to the increase in injection rate to meet up to the SWAG ratio. Eventhough a SWAG ratio of 2:1 and 1.5:1 yielded a very high recovery factor, the water cut experienced was very high, both exceeding the limit of 0.9. Hence, the
SWAG injection at a CO2 injection rate of 15,000 Mscf/d with a
1:1 SWAG ratio is chosen as the most optimum SWAG injection strategy as it yields a high recovery factor very near to that of 1.5:1 and 2:1 and yet with water cut below 0.9.
Fig. 7. Recovery factor (FOE) for CO2 SWAG injection at various SWAG ratios
0 0.1 0.2 0.3 0.4 0.5 0.6 0.7
0 0.5 1 1.5 2 2.5
SWAG ratio
F
O
E
0 5,000 10,000 15,000 20,000
CO2 Injection Rate (Mscf/d)
CO2 Volumetric Ratio Injection Rate
Fig. 8. Effect of CO2 SWAG ratio and injection rate on recovery
The optimum injection mode for each of the CO2 injection
TABLE II
Optimum injection strategy design determined from simulation C O2 Inje ction
Mode
Inje ction Strate gy De sign
Re cove r y Factor Continuous
Injection
CO2 Injection Rate at
30,000 Mscf/d 0.493
WAG Injection
CO2 Injection Rate at 30,000 Mscf/d
WAG Ratio of 1:1
Cycle T ime of 6 months
0.547
Hybrid WAG Injection
CO2 Injection Rate at 30,000 Mscf/d
WAG Ratio of 1:1
Cycle T ime of 6 months
Initial CO2 Slug Size of 10% HCPV
0.539
SWAG Injection
CO2 Injection Rate at 15,000 Mscf/d
SWAG Ratio of 1:1
0.548
In Table II, the SWAG injection yielded the highest recovery factor followed by WAG, Hybrid WAG and finally continuous injection. The difference in efficiency of the SWAG, WAG and
hybrid WAG was not profound. However, the CO2 continuous
injection yielded a relative low recovery factor as compared to the other techniques. The hybrid WAG on the other hand exhibited the highest initial production response compared to
the other CO2 injection techniques. However, the initial high
production response period was short and was soon taken over by SWAG injection in around August 2002. The production rate on the other hand was still higher than that of WAG until early 2003. Though the initial production response was high for Hybrid WAG, the final recovery factor was still lower compared to the WAG and SWAG.
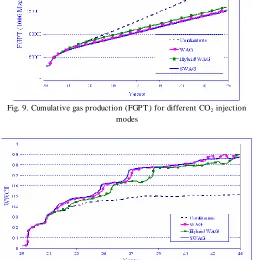
The cumulative gas production as seen in Fig. 9 denotes insignificant difference in values compared to WAG, Hybrid WAG and SWAG injection. Continuous injection yielded the highest gas production total of 212,248 MMscf. This is
because CO2 was injected throughout the time of study with
no other fluid injected at 30,000 Mscf/d. The water cut of continuous injection on the other hand is the lowest of all the
injection strategies as CO2 continuous injection did not inject
any water into the reservoir. The water recovered from the reservoir was purely from the acquifer of the reservoir for continuous injection. For the SWAG, WAG and Hybrid WAG technique, high water cut was experienced as the techniques
involved water injection. The water cut trend for all the CO2
injection technique can be referred to in Fig. 10.
Fig. 9. Cumulative gas production (FGPT ) for different CO2 injection modes
Fig. 10. Water cut (WWCT ) for different CO2 injection modes After evaluating the recovery factor, gas production rate and
total as well as the water cut, SWAG injection with a CO2
injection rate of 15,000 Mscf and SWAG ratio of 1:1 is proposed for reservoir A as it yields the highest final recovery and at the same time, a water cut that is below the limit of 0.9
and a relatively low CO2 breakthrough.
VII. CONCLUSION
Recovery factor increased with increasing injection rate.
Recovery factor increment however decreased with increasing injection rate.
The optimum continuous injection rate for our case study
reservoir is 30,000 Mscf/d yielding a recovery factor of 49.3%.
For WAG, the recovery factor increased with increasing
WAG ratio. The recovery factor however is not very sensitive to the WAG time cycle. The optimum WAG
injection strategy for reservoir A is CO2 injection at a rate
of 30,000 Mscf/d at 1:1 WAG ratio with a time cycle of 6 months. The resulting recovery factor is 54.7%.
Hybrid WAG yields high initial production response and
also increases the ultimate recovery. The recovery factor
was seen to increase with decreasing initial CO2 slug size.
For the reservoir, an initial slug size of 10% HCPV is the optimum injection strategy yielding a recovery factor of 53.9%.
For SWAG, the recovery factor increased with increasing
CO2 injection rate and increasing SWAG ratio. The
rate of 15,000 Mscf/d with a SWAG ratio of 1:1, yielding a recovery factor of 54.38%.
Comparing all the various optimum CO2 injection modes,
SWAG injection with a CO2 injection rate of 15,000 Mscf/d
and SWAG ratio of 1:1 is the most efficient recovery method for reservoir A. This is because it yields the highest recovery factor of 54.8% and at the same time, water cut that is below the limit of 0.9 and a relatively low
CO2 breakthrough.
It is important to note that different reservoirs require different injection techniques because of the unique reservoir characteristics and not that any one technique can be applied to any reservoir. Hence it is important to identify the optimum flooding mode prior to implementing the flood in the actual field
ACKNOWLEDGMENT
We would like to acknowledge the support from Dr Nasir Darman, PMU and Assoc Prof Dr Anwar Raja to this work. Thanks are also due to Assoc Prof Dr Chow Weng Sum for proofreading this manuscript.
REFERENCES
[1] Z.M Zain, N.I Kechut, G. Nadeson, N. Ahmad, Dr. DM Anwar Raja, Evaluation of CO2 Gas Injection for Major Oil Production Fields in Malaysia – Experimental Approach Case Study: Dulang Field. SPE 72106, 2001.
[2] Larry W. Lake, Raymond L. Schmidt and Paul B Venuto, “ A Niche for Enhanced Oil Recovery in the 1990s”, 1992
[3] Hamdan, M.K., Darman, N., Hussain, D. Ibrahim, Z.: Enhanced Oil Recovery in Malaysia: Making it a Reality, paper SPE 93329 presented at Asia Pacific Oil and Gas Conference and Exhibition in Jakarta, Indonesia, 5-7 April. 2005.
[4] Rached Hindi, C.T . Cheng and Ben Wang, CO2 Miscible Flood
Sim ulation Study, Roberts Unit, Wasson Field, Yoakum County Texas, SPE 24185, 1992.
[5] R.E. Hadlow, Update of Industry Experience With CO2 Injection,
SPE 2492, 1992.
[6]T .D.Ma., J.A. Rugen, R.F. Stoisits abd G.K. Youngren, Sim ultaneous Water and Gas Injection Pilot at the Kuparuk River Field, Reservoir Im pact SPE 30726, 1995.