Open Access
Research article
Pattern recognition in menstrual bleeding diaries by statistical
cluster analysis
Christoph Gerlinger*
1, Jens Wessel
2,3, Gerd Kallischnigg
4and Jan Endrikat
5,6Address: 1Global Clinical Statistics, Bayer Schering Pharma AG, Müllerstraße 178, 13342 Berlin, Germany, 2Global Medical Affairs Women's
Healthcare, Bayer Schering Pharma AG, Berlin, Germany, 3Klinik für Geburtsmedizin, Charité, Campus Virchow-Klinikum, Humboldt Universität,
Berlin, Germany, 4Institute of Health Sciences, Berlin University of Technology, Berlin, Germany, 5Bayer Inc., Toronto, Ontario, Canada and 6Klinik für Frauenheilkunde, Geburtshilfe und Reproduktionsmedizin, Universität des Saarlands, Homburg (Saar), Germany
Email: Christoph Gerlinger* - [email protected]; Jens Wessel - [email protected]; Gerd Kallischnigg - [email protected]; Jan Endrikat - [email protected]
* Corresponding author
Abstract
Background: The aim of this paper is to empirically identify a treatment-independent statistical method to describe clinically relevant bleeding patterns by using bleeding diaries of clinical studies on various sex hormone containing drugs.
Methods: We used the four cluster analysis methods single, average and complete linkage as well as the method of Ward for the pattern recognition in menstrual bleeding diaries.
The optimal number of clusters was determined using the semi-partial R2, the cubic cluster criterion, the pseudo-F- and the pseudo-t2-statistic. Finally, the interpretability of the results from a gynecological point of view was assessed.
Results: The method of Ward yielded distinct clusters of the bleeding diaries. The other methods successively chained the observations into one cluster. The optimal number of distinctive bleeding patterns was six. We found two desirable and four undesirable bleeding patterns. Cyclic and non cyclic bleeding patterns were well separated.
Conclusion: Using this cluster analysis with the method of Ward medications and devices having an impact on bleeding can be easily compared and categorized.
Background
Hormonal contraceptives and other treatments with impact on the endometrium alter a woman's natural men-strual bleeding pattern [1]. Any change in the bleeding pattern has a major impact on the individual's quality of life. An unsatisfactory bleeding pattern is one of the major causes for stopping treatment with sex hormones, e.g. for contraception, the treatment of menopausal symptoms, or endometriosis.
An analysis of bleeding patterns is required by drug regu-latory agencies such as the EMEA and the FDA in addition to an analysis of efficacy and safety. Although the regula-tory requirements for safety and efficacy of hormonal preparations such as contraceptives or hormone replace-ment therapies are well defined, e.g. [2], the EMEA's guideline on contraceptives [3] requires only that the bleeding pattern is studied in an active controlled study Published: 16 July 2009
BMC Women's Health 2009, 9:21 doi:10.1186/1472-6874-9-21
Received: 3 April 2009 Accepted: 16 July 2009
This article is available from: http://www.biomedcentral.com/1472-6874/9/21
© 2009 Gerlinger et al; licensee BioMed Central Ltd.
but does not specify how. The EMEA's guideline on hor-mone replacement therapy [4] is not any more specific.
The aim of this paper is to empirically identify a treat-ment-independent statistical method to describe clini-cally relevant bleeding patterns by using bleeding diaries of clinical studies on various sex hormone containing drugs.
Methods
We analyzed bleeding dairies that were kept in clinical tri-als involving various products used for hormonal fertility control, hormone replacement therapy and endometrio-sis. Mono-preparations as well as combined preparations were included. Estrogens, e.g., estradiol, estradiolvalerate or ethinylestradiol and a large variety of modern pro-gestins, e.g, levonorgestrel, desogestrel, dienogest or dros-pirenone, were the hormonal components of the drugs.
All trials were performed according to the principles of the Declaration of Helsinki [5], the laws applicable in the respective countries, and "Good Clinical Practices" (GCP) [6]. All clinical studies have been approved by the compe-tent ethics committees. The clinical trials were sponsored by Bayer Schering Pharma AG or one of its subsidiaries.
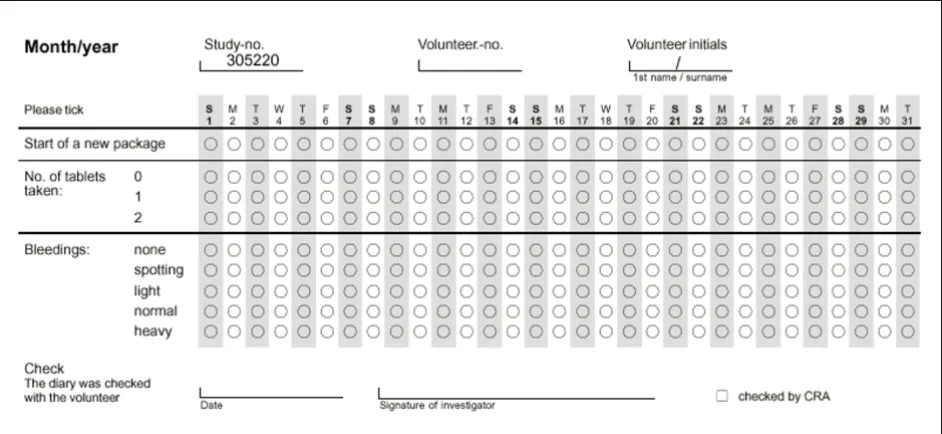
The definitions of bleeding intensities that were recorded daily in the bleeding diaries (see Figure 1) were slightly different in the various studies. For the purpose of this
analysis, the bleeding intensity categories have been standardized according to WHO terminology [7] as "none", "spotting", and "bleeding". "Spotting" is defined as any vaginal bleeding that does not require the use of sanitary protection such as tampons or pads. "Bleeding" is defined as vaginal bleeding that requires the use of sani-tary protection. "None" is defined as neither "Spotting" nor "Bleeding" on that day. These definitions are inde-pendent of whether sanitary protection was actually used or not. For the purpose of the cluster analyses, the bleed-ing intensity scores 0 for "none", 1 for "spottbleed-ing", and 2 for "bleeding" were used.
All cluster analysis algorithms implemented in SAS®
Soft-ware [8] require complete data. Therefore, we imputed single missing entries in the bleeding diaries by the maxi-mum of the bleeding intensities of the preceding and the following day. We included all diaries that had a length of at least 90 days in our analyses. This length was chosen to comply with the definition of the reference period length of the WHO [7]. In summary, the dataset consisted of one record per woman with ninety score variables giving the bleeding intensity score for each day.
The bleeding diary data was analyzed using different agglomerative hierarchical cluster analyses because these methods do not require previous knowledge as for exam-ple a discriminant analysis. The bleeding patterns in the diaries should be found by unsupervised pattern
recogni-Example of bleeding diary
Figure 1
tion [9]. As there is no single optimal cluster analysis pro-cedure, we analyzed the data using the single linkage method [10,11], the complete linkage method [12], the average linkage method [13], and the method of Ward [14].
As the number of different bleeding patterns was
unknown a priori, we used the semi-partial R2 [8], the
cubic cluster criterion [15], the F- and the pseudo-t2-statistic [8] to derive the optimal number of clusters.
Finally, we assessed whether the results of the cluster anal-yses could be interpreted from a gynecological perspec-tive.
Results
The clinical databases contained bleeding diaries of 5602 women. Of these 3246 (57.9%) women were treated with hormone replacement therapy after menopause, 2035 (36.3%) were aged 18 to 35 and took an oral contracep-tive, and 321 (5.7%) were treated for endometriosis. A total of 4612 (82.3%) diaries were included in our analy-ses because they covered at least 90 consecutive days. An exploratory data analysis of the bleeding diaries revealed that 1288 (27.9%) of the 4612 women in our dataset never bled during the 90 days analyzed. On the other hand, 3172 (68.8%) women had a unique bleeding pat-tern that occurred only once in the dataset.
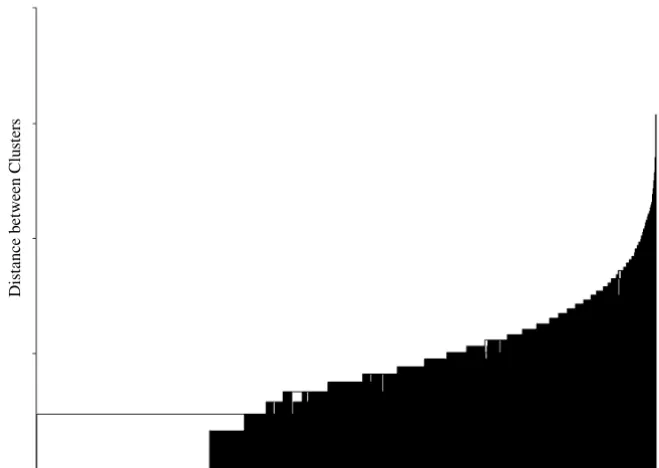
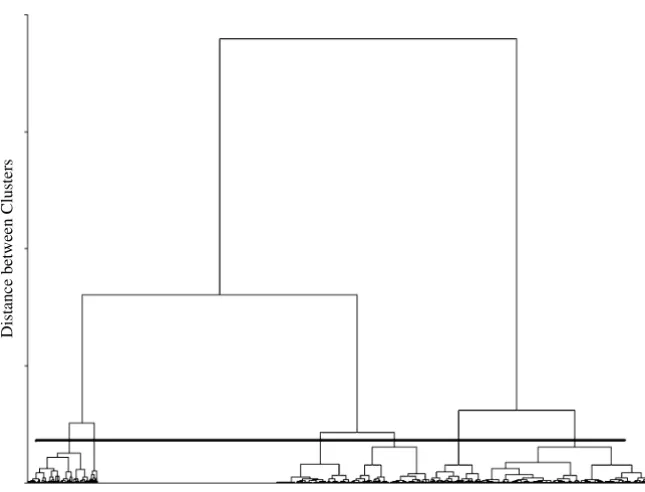
The cluster analyses using the single linkage, complete linkage, and average linkage methods did not produce clinically interpretable results. With all three methods the effect of chaining occurred where the observations are suc-cessively joined into a single large cluster (see Figure 2). On the other hand, the method of Ward yielded a clear separation of the bleeding diaries (see Figure 3) into dis-tinct clusters. According to the semi-partial R2, the cubic
cluster criterion, the pseudo-F, and the pseudo-t statistic, the solutions with three, four, six, and twelve clusters could be of clinical relevance.
Comparing these solutions, we found out, that the solu-tion with six clusters was the best to be interpreted clini-cally. Three and four cluster did not distinguish the different bleeding patterns to enough detail whereas twelve clusters provided no more clinically useful insight than six clusters. This solution is depicted in Figure 3 by the solid horizontal line.
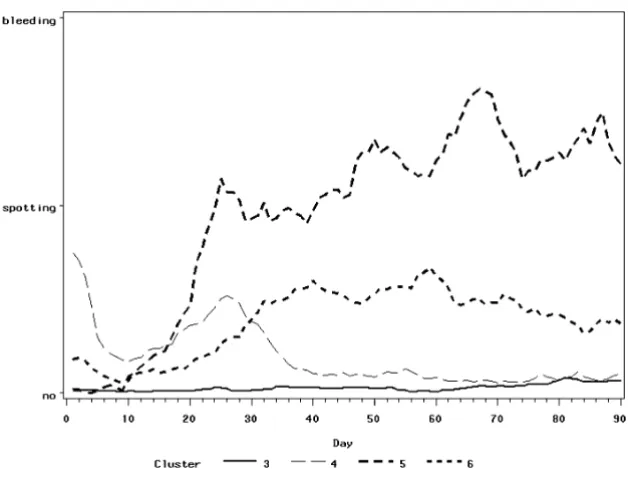
The cluster analysis revealed two clusters of cyclic bleed-ing patterns containbleed-ing 1235 and 386 diaries (see Figure 4) and four clusters of non-cyclic bleeding patterns con-taining 1880, 590, 71, and 450 diaries (see Figure 5).
The cyclic bleeding patterns are clearly separated into a desirable bleeding pattern (number 1 in Figure), which is characterized by the regular monthly bleeding and a very
Dendrogramm of the single linkage method
Figure 2
Dendrogramm of the single linkage method.
Dista
n
ce
b
et
w
een
Cl
u
st
er
Dendrogramm of the method of Ward
Figure 3
Dendrogramm of the method of Ward. Note: The six clusters determined by the horizontal line are -from left to right- the clusters number 6, 5, 3, 4, 2, and 1.
D
is
ta
n
ce
be
tw
ee
n
C
lu
st
ers
Cyclic bleeding patterns – mean bleeding intensity
Figure 4
low frequency of intracyclic bleeding during hormone intake, and an undesirable bleeding pattern (number 2 in Figure 4), which is characterized by a less regular monthly bleeding and a higher frequency of intracyclic bleeding, starting always in the middle of the cycle.
Among the four non-cyclic bleeding patterns there are two that are desirable bleeding patterns and two that are unde-sirable. Bleeding pattern number 3 in Figure 5 shows amenorrhea, a pattern typical of post menopausal women taking continuously combined steroid hormone prepara-tions. Bleeding pattern number 4 in Figure 5 can be inter-preted as the pattern of fertile women which start continuous steroid hormonal treatment, e.g. for the treat-ment of endometriosis. The natural cyclic bleeding ceases during the first month of treatment and thereafter reaches amenorrhea as in pattern number 3. The bleeding patterns 5 and 6 in Figure 5 both show a high frequency of unde-sirable spotting or bleeding. Pattern 6 is worse than pat-tern 5.
Discussion
Several suggestions have been made in the literature over the past years for the analysis of bleeding diaries [16-18], all of them were based on theoretical considerations. To
our knowledge, this is the first analysis to recognise pat-terns in bleeding diaries using empirical methods.
A hierarchical agglomerative cluster analysis with the method of Ward yielded six bleeding patterns which allow for a straightforward clinical interpretation, either desira-ble or undesiradesira-ble desira-bleeding pattern for a certain treatment target. In contrast the single, average and complete linkage methods chained the data into a single cluster, which was not interpretable from a gynaecologic point of view.
Conclusion
Using this cluster analysis with the method of Ward, treat-ments (medications and devices) having an impact on bleeding can be easily compared and categorized. This analysis is independent of the treatment's route of admin-istration (oral, transdermal, vaginal, intrauterine) and the duration of treatment. Hormonal and non-hormonal treatments can be easily compared. However, this method is only useful in large clinical trials to characterize a new product's bleeding pattern but it is not meaningful for the physician treating an individual patient.
Since currently various innovative long-cycle contracep-tive regimen are in development, this method might be
Continuous bleeding patterns – mean bleeding intensity
Figure 5
Publish with BioMed Central and every scientist can read your work free of charge "BioMed Central will be the most significant development for disseminating the results of biomedical researc h in our lifetime."
Sir Paul Nurse, Cancer Research UK
Your research papers will be:
available free of charge to the entire biomedical community
peer reviewed and published immediately upon acceptance
cited in PubMed and archived on PubMed Central
yours — you keep the copyright
Submit your manuscript here: BioMedcentral
useful to compare bleeding pattern from different studies using one uniform method.
Competing interests
CG and JW are fulltime employees of Bayer Schering Pharma AG, Berlin, Germany and JE is a fulltime employee of Bayer Inc., Toronto, Ontario, Canada. Bayer Schering Pharma AG funded this study and the article processing charges.
GK declares that he has no competing interests.
Authors' contributions
JE, CG, and JW designed the study. CG performed the sta-tistical analyses. CG and JE drafted the manuscript. GK and JW critically reviewed the draft manuscript. All authors read and approved the final manuscript.
References
1. Taubert HD, Kuhl H: Kontrazeption mit Hormonen, Ein Leitfaden für die Praxis 2nd edition. Stuttgart Georg Thieme Verlag; 1995:153-161. 2. Gerlinger C, Endrikat J, Meulen EA van der, Dieben TOM, Düsterberg
B: Recommendation for confidence interval and sample size calculation for the Pearl Index. Eur J Contracept Reprod Health Care 2003, 8(2):87-92.
3. The European Agency for the Evaluation of Medicinal Products, Com-mittee for Proprietary Medicinal Products (CPMP): Note for Guidance on Clinical Evaluation of Steroid Contraceptives in Women . London 17 February 2000 CPMP/EWP/519/98. Section 4.3.
4. The European Agency for the Evaluation of Medicinal Products, Com-mittee for Proprietary Medicinal Products (CPMP): Points to Consider on Hormone Replacement Therapy . London 17 November 1997 CPMP/ EWP/021/97. Section 2.2.2.
5. World Medical Association: Declaration of Helsinki: ethical principles for medical research involving human subjects.
JAMA 2000, 284(23):3043-5.
6. The European Agency for the Evaluation of Medicinal Products, Com-mittee for Proprietary Medicinal Products (CPMP): Note for Guidance on Good Clinical Practice . London 1 May 1996 CPMP/ICH/135/958. 7. World Health Organization Special Programme of Research,
Devel-opment and Research Training in Human Reproduction: The analy-sis of vaginal bleeding patterns induced by fertility regulating methods. Contraception 1986, 34:253-260.
8. SAS Institute Inc: SAS/STAT® User's Guide, Version 9.1 Cary, NC: SAS Institute Inc; 2004.
9. Winston PH: Artificial Intelligence 2nd edition. Reading, Mass. Addison-Wesley; 1984.
10. Florek K, Lukaszewiez L, Perkal L, Steinhaus H, Zortchi S: Sur la lia-son et la division des points d'un ensemble fini. Colloquium Mathematicum 1951, 2:282-285.
11. Sneath PHA: The application of computers to taxonomy. Jour-nal of General Microbiology 1957, 17:201-226.
12. Sørensen T: A method of establishing groups of equal ampli-tude in plant sociology based on similarity of species content and ist applications to analyses of the vegetation on Danish commons. Biologiske Skrifter 1948, 5:1-34.
13. Sokal RR, Michener CD: A statistical method for evaluating sys-tematic relationships. University of Kansas Science Bulletin 1958, 38:1409-38.
14. Ward JH: Hierachical grouping to optimize an objective func-tion. Journal of the American statistical Association 1963, 58:236-44. 15. Sarle WS: Cubic Clustering Criterion, SAS Technical Report A-108 Cary,
C: SAS Institute Inc; 1983.
16. World Health Organization Special Programme of Research, Devel-opment and Research Training in Human Reproduction: The analy-sis of vaginal bleeding patterns induced by fertility regulating methods. Contraception 1986, 34:253-260.
17. Archer DF, Pickar JH: The assessment of bleeding patterns in postmenopausal women during continuous combined
hor-mone replacement therapy: a review of methodology and recommendations for reporting of the data. Climacteric 2002, 5:45-59.
18. Mishell DR Jr, Guillebaud J, Westhoff C, Nelson AL, Kaunitz AM, Trussell J, Davis AJ: Recommendations for standardization of data collection and analysis of bleeding in combined hor-mone contraceptive trials. Contraception 2007, 75:11-5.
Pre-publication history
The pre-publication history for this paper can be accessed here: