R E S E A R C H
Open Access
Three dimensional evaluation of soft
tissue after orthognathic surgery
Junho Jung, Chi-Heun Lee, Jung-Woo Lee and Byung-Joon Choi
*Abstract
Background:To evaluate the nasolabial soft tissue change three-dimensionally after orthognathic surgery, using a structured light scanner.
Methods:Thirty-two malocclusion patients, who underwent orthognathic surgery, were evaluated. CBCT and 3D
facial scans were obtained before surgery and 3 months after surgery. The 3D changes in the 26 landmarks, and the relative ratio of the soft tissue movement to the bony movement, were evaluated.
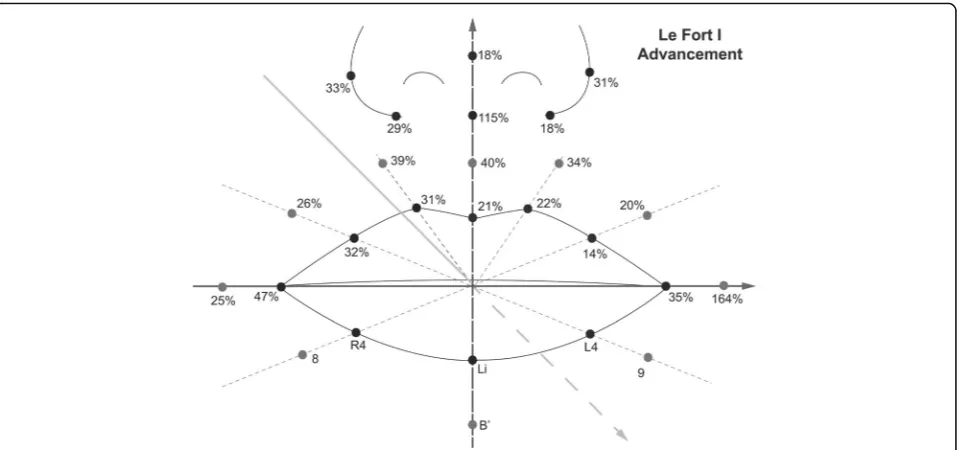
Results:In the Le Fort I advancement patients, the nasal tip moved 17% forward, compared to the maxillary bony
movement, but the nasal prominence decreased 15%. The alar width increased 4 mm after the advancement, and the width decreased 4.7 mm after Le Fort I setback. The relative ratio of the soft tissue movement to the bony movement after bilateral sagittal split osteotomy was about 66% at the Li point in the anteroposterior direction, and it was 21% in the Le Fort I advancement and 14% in Le Fort I setback at the Ls point.
Conclusion:Alar cinch suturing may not be sufficient to overcome the effect of the maxilla advancement compressing the nasal complex. Alar width widening was prevented in Le Fort I setback. However, it is uncertain that the alar cinch suturing was solely responsible. The soft tissue around the mandible tends to accompany the bony movement more than the maxillary area. In addition, structured light scanning system proved to be a useful tool to evaluate the nasolabial soft tissue.
Keywords:Orthognathic surgery, Structured light-based scanners, 3D measurement, Nasolabial soft tissue
Background
Orthognathic surgery restores not only the occlusal
function, but also aesthetics by improving facial
harmony. Needless to say, improving soft tissue esthetics is of the ultimate treatment goal. According to skeletal movements from orthognathic surgery, there are consist-ent nasolabial soft tissue changes. Consequconsist-ently, various attempts have tried to establish a correlation between the hard and soft tissue changes [1–4].
Conventional two-dimensional (2D) lateral cephalogram is used to predict and evaluate surgical outcomes before and after surgery. Although these methods are convenient and have economic advantages, due to the limitation of its midsagittal projection and the projection angle and dis-tance, the information of soft tissue changes and the ac-curacy is lacking and unsatisfactory [5]. Moreover, since
various soft tissue closure techniques, including the alar cinch suture and the “V-Y” lip mucosal closure, control the nasal base and upper lip [6–8], 2D imaging methods may not be adequate to evaluate the nasolabial tissue.
In recent years, 3D imaging has gained popularity to overcome the limitations of 2D analysis. Cone beam com-puted tomography (CBCT) provides sufficient information about skeletal structures, and is used to measure soft tissue changes [9]. Moreover, it is frequently applied in dentistry. However, owing to its low resolution and lack of data of skin texture and color, the accuracy of the evaluation for facial soft tissues is not guaranteed [10]. Therefore, noncontact optical scanning methods such as Laser surface scanning and light emitting diode (LED) white light scanning, were introduced as 3D imaging tools [11]. The LED white light scanning has advantages of in-nocuousness to the human eyes and immediacy to acquire data, making the scanning method suitable for long-term studies and for a larger population of patients [12]. * Correspondence:[email protected]
Department of Oral and Maxillofacial Surgery, School of Dentistry, Kyung Hee University, 26, Kyungheedae-ro, Dongdaemun-gu, 02447 Seoul, Republic of Korea
This study was undertaken to assess and describe the nasolabial soft tissue changes three-dimensionally, after bilateral sagittal split osteotomy (BSSRO) or Le Fort I osteotomy with BSSRO, using structured light system-one of the LED white light scanning system. In addition, this study also investigated the effect of the alar base cinch suture following Le Fort I osteotomy, by measur-ing nasal soft tissue.
Methods
Subjects
The patients enrolled for this study included 32 malocclusion cases (17 men, 15 women; mean age, 23.8 ± 3.60 years; range, 17–33 years) who had under-gone BSSRO or/and Le Fort I advancement or setback osteotomy, between 2010 and 2016, in the de-partment of oral and maxillofacial surgery at Kyung Hee university Medical Center (Table 1). The patients were divided into 3 groups: BSSRO only (9 patients; mean age, 23.2 ± 3.5; range, 19–31), Le Fort I ad-vancement (13 patients; mean age, 24.0 ± 3.4; range, 17–31), and Le Fort I setback (10 patients; mean age, 24.1 ± 4.1; range, 19–33). All subjects underwent pre- and post-operative orthodontic treatment. In each case, the surgical procedure consisted of BSSRO only, or Le Fort I osteotomy with BSSRO and rigid fixation. After Le Fort I osteotomy and rigid fixation with four L-type titanium plates, alar cinch suture was applied to prevent widening of the nose for all patients. A hole was made at the anter-ior nasal spine through lateral to lateral by a 1.6 Ø drill. The suture (2/0 non-absorbable (Ethibond)) was passed through the perinasal musculature and fibroadipose tissue at the right alar base from a lateral to medial, the needle then passed through the hole in the nasal spine. The tissue at the left alar base was grasped by the same suture, and the needle then passed through the hole again. A knot of the suture was made at the alar base. The mandible was set back with BSSRO, and the proximal segment fixed with one 4-hole plate and screws. A surgical wafer was placed for 5–6 weeks postoperatively, and inter-arch
elastics were used in order to stabilize the inter-maxillary relationship with the surgical wafer. This study was approved by the Ethics Committee at the Kyung Hee University Dental Hospital (KHD IRB 1603–4).
Patients who underwent superior or inferior position-ing of the maxilla and previous nasal surgery and have any craniofacial anomalies and a history of trauma were excluded in this study.
Data acquisition
3D facial image scans using a LED white light scanning system (Morpheus 3D, Morpheus Co., Ltd., Seoul, Korea) were acquired preoperatively and at 3 months postoperative (scan time: 0.8 s, 33 frame rate: 15 frames/ s, data accuracy: ±0.2 mm). Each patient was instructed to relax their lips and set the head in a natural position, while the images were taken. Afterwards, three images from three different views were reconstructed into one 3D image by a merging process.
CBCT scans were acquired preoperatively and at 3 months postoperative, using the Alphard 3030 Dental CT system (Asahi Roentgen Ind. Co., Ltd., Kyoto, Japan) with the following imaging protocol: 80 kVp, 5 mA, 17 s, and 15.4 cm × 15.4 cm field of view. All patients were seated upright with maximum intercuspation, and the Frankfort horizontal (FH) plane of the patient was maintained parallel to the floor during scanning. Voxels were isotropic, each of 0.3 mm width. The CBCT data were exported into the DICOM format, and OnDemand 3D (CyberMed Inc., Seoul, Korea) was used to measure the movement of the maxilla and mandible by superim-position of the data. The actual movement of B-point was measured after BSSRO; both A-point and B-point were measured after Le Fort I osteotomy.
Landmarks and coordinate system
To evaluate the nasolabial soft tissue changes after sur-gery, 26 landmarks were set on the 3D image along the lip border, and around the lip and the nostrils (Figs.1a,2, Table2). [12] The landmark values were recorded with a
Table 1Details of the subjects
Group Mean age Gender (M/F) Diagnosis Ethnicity
Le Fort I Advancement & BSSRO 24.0 ± 3.4 9/4 Class I malocclusion: 1 Korean
Class II malocclusion: 2
Class III malocclusion: 10
Le Fort I Setback & BSSRO 24.1 ± 4.1 4/6 Class I malocclusion: 3 Korean
Class II malocclusion: 2
Class III malocclusion: 5
BSSRO 23.2 ± 3.5 4/5 Class I malocclusion: 0 Korean
Class II malocclusion: 0
Class III malocclusion: 9
3D Cartesian coordinate system. The left (x-axis), front (z-axis) and above (y-axis) of a patient were defined as posi-tive values; the reference planes were set as below [13]:
The horizontal reference plane (x-axis): the ala-tragus plane was rotated 7.5 degree upward on the axis connecting both tragi, and translated until soft tissue nasion.
The sagittal reference plane (y-axis): the plane perpen-dicular to the horizontal plane and passing the soft tissue nasion.
The coronal reference plane (z-axis): the plane perpen-dicular to the other reference planes and passing the soft tissue nasion.
Superimposition of pre-and post-operative image data was performed by reference points including left and right exocanthion, endocanthion, N′, and wide face of forehead using 3D Image Overlay [13]. The differences were evaluated by superimposed 3D image with one coordinate system.
Fig. 1(a) Three-dimensionally reconstructed facial image and twenty-six landmarks around the nasolabial tissue. (b) A superimposed color map
image of facial soft tissue change after orthognathic surgery
Statistical analysis
Two weeks after the first measurement, re-evaluation was performed by the same investigator, and both values were compared using the Pearson correlation analysis. The co-efficient was above 0.98 at the 95% confidence level. Thus, the mean of the two values was used for the statistical analysis. The Shapiro-Wilk test was used to confirm the Normality of the data distribution. The paired Student t-test analyzed the data, andα-level was set to 0.05.
Results
The amount of movement at point A was about 2.4 mm (±1.4) after the Le Fort I advancement, and the relative ratio of the soft tissue movement to the bony movement are shown in Table3 and Fig.3. Unplanned superoinfer-ior movements of the maxilla was not observed during the measurement. The alar width increased approxi-mately 4 mm after surgery, which was statistically significant. In addition, a significant forward movement
Table 2Definitions of the landmarks
Region Landmarks Description
Along the lips Cph (L), Cph (R) The highest point of the Cupid’s bow (left, right)
Ls The lowest point of the middle area of the Cupid’s bow
Ch (L), Ch(R) The most lateral point of vermilion border (left, right)
Li The lowest point of vermilion border
L1, L4, R1, R4 Midpoints of curved vermilion border
Around the lips 1–9 B′ Perioral points which are counterparts of each point along the lip border, being apart by the same distance
Soft tissue B point
Around the nostril Al (L), Al (R) Most lateral point of the alar contour (left, right)
Pn Most anterior point of the nose
Sn Midpoint of the nasolabial angle at the columellar base
Ac (L), Ac (R) Labial insertion of each alar base
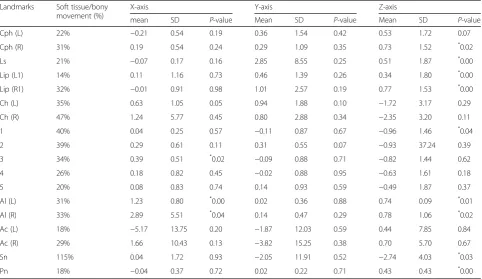
Table 3The relative ratio of soft tissue movement to bony movement in the anteroposterior direction and three-dimensional changes of perioral soft tissue after Le Fort I advancement & BSSRO
Landmarks Soft tissue/bony movement (%)
X-axis Y-axis Z-axis
mean SD P-value Mean SD P-value Mean SD P-value
Cph (L) 22% −0.21 0.54 0.19 0.36 1.54 0.42 0.53 1.72 0.07
Cph (R) 31% 0.19 0.54 0.24 0.29 1.09 0.35 0.73 1.52 *0.02
Ls 21% −0.07 0.17 0.16 2.85 8.55 0.25 0.51 1.87 *0.00
Lip (L1) 14% 0.11 1.16 0.73 0.46 1.39 0.26 0.34 1.80 *0.00
Lip (R1) 32% −0.01 0.91 0.98 1.01 2.57 0.19 0.77 1.53 *0.00
Ch (L) 35% 0.63 1.05 0.05 0.94 1.88 0.10 −1.72 3.17 0.29
Ch (R) 47% 1.24 5.77 0.45 0.80 2.88 0.34 −2.35 3.20 0.11
1 40% 0.04 0.25 0.57 −0.11 0.87 0.67 −0.96 1.46 *0.04
2 39% 0.29 0.61 0.11 0.31 0.55 0.07 −0.93 37.24 0.39
3 34% 0.39 0.51 *0.02 −0.09 0.88 0.71 −0.82 1.44 0.62
4 26% 0.18 0.82 0.45 −0.02 0.88 0.95 −0.63 1.61 0.18
5 20% 0.08 0.83 0.74 0.14 0.93 0.59 −0.49 1.87 0.37
Al (L) 31% 1.23 0.80 *0.00 0.02 0.36 0.88 0.74 0.09 *0.01
Al (R) 33% 2.89 5.51 *0.04 0.14 0.47 0.29 0.78 1.06 *0.02
Ac (L) 18% −5.17 13.75 0.20 −1.87 12.03 0.59 0.44 7.85 0.84
Ac (R) 29% 1.66 10.43 0.13 −3.82 15.25 0.38 0.70 5.70 0.67
Sn 115% 0.04 1.72 0.93 −2.05 11.91 0.52 −2.74 4.03 *0.03
Pn 18% −0.04 0.37 0.72 0.02 0.22 0.71 0.43 0.43 *0.00
SDstandard deviation
Asterisks indicate statistical significance between the values of pre- and post-operative measurement (P< 0.05)s
of almost all upper lip landmarks was observed due to the maxilla advancement (P< 0.05). In the upper lip, the percentage of the soft tissue movement compared to the bony movement was 14–31%. In the nasal area, the ratio was 18–48%, which was higher than the lip area. How-ever, the nasal tip movement was the least among the nasal areas.
After the Le Fort I setback osteotomy, on an average, point A moved posteriorly by about 2.1 mm (±1.0). Unplanned superoinferior movements of the maxilla was not observed during the measurement. Also, postopera-tively the alar width decreased about 4.7 mm (Table 4, Fig. 4). In the upper lip area, the soft tissue movement was 3–52% compared to the bony movement, and it was 15% at the nasal tip. However, the proportion was 63–84% at the alar and alar base areas.
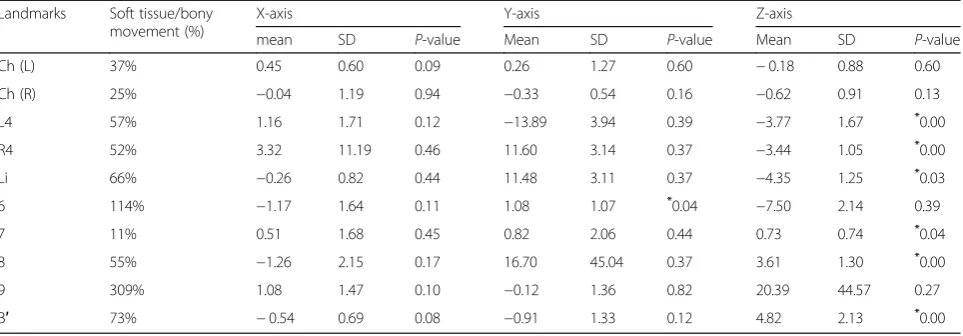
The amount of setback movement after BSSRO was measured as the mean value of 6.6 mm (±2.8) at point B by CBCT (Table5). The Li and soft tissue B point move-ment was 4.3 and 4.85 mm, respectively. The relative ra-tio of soft tissue movement to bony movement was about 66% and 73% in the anteroposterior direction at the landmarks.
Discussion
Le Fort I osteotomy has the potential to alter the mid-facial region. However, despite precise planning and surgery, it is difficult to predict soft tissue changes. Hence, this study aimed to demonstrate the 3D change in postoperative nasolabial soft tissue, in order to optimize surgical outcomes and patient satisfaction. Especially, undesirable effects such as widening of the alar
base or alteration of the nasal tip projection [3, 14–16] were measured.
2D techniques have been broadly used until recent years. However, due to their limitations, the measure-ments might be somewhat biased [14]. Therefore, various methods, including laser scanners, stereophotogrammetry, and structured light systems, have recently been intro-duced for 3D soft tissue assessment. The accuracy of the structured light system used in this study compares the direct anthropometric measurements, and 3D facial scan values were less than 1 mm [17,18]. Moreover, as the face of the subject was simultaneously scanned from multiple angles in less than 1 s, we expect more reliable collections of 3D datasets. The facial scanning device used in study is now available more than 10 countries in America, Europe and Asia. The cost for the procedure is less than the one for CBCT taking in our clinic.
In our study, the nasolabial soft tissue changes were compared with the actual movement of point A mea-sured in CBCT. The average movement of the nasal tip was about 17% compared to the maxillary bony move-ment. However, the nasal prominence (measured from the alar groove to the tip) decreased by about 15% of the total maxillary advancement. In other words, although the actual nasal tip moved forward, the nasal promin-ence itself decreased as the piriform aperture com-pressed the nasal complex, and it widened and became obtuse. According to the tripod theory, the widened alar may pull the nasal tip back, despite an increase in rela-tive nasal tip position to the face, so that intrinsic nasal tip projection decreased while the extrinsic nasal projec-tion increased [19–21].
Fig. 3The relative ratio of the soft tissue movement to the bony movement in the anteroposterior direction after Le Fort I advancement
Fig. 4The relative ratio of the soft tissue movement to the bony movement in the anteroposterior direction after Le Fort I setback osteotomy (%)
Table 4The relative ratio of soft tissue movement to bony movement in the anteroposterior direction and three-dimensional changes of perioral soft tissue after Le Fort I setback & BSSRO
Landmarks Soft tissue/bony movement (%)
X-axis Y-axis Z-axis
mean SD P-value Mean SD P-value Mean SD P-value
Cph (L) 25% −0.32 0.56 0.13 0.39 1.26 0.38 −0.52 0.92 0.13
Cph (R) 19% 0.33 0.44 0.06 7.23 20.66 0.32 −0.41 0.93 0.23
Ls 14% 0.09 0.41 0.52 0.27 1.29 0.55 −0.29 0.95 0.39
Lip (L1) 3% −0.06 0.38 0.65 0.26 0.85 0.38 −0.06 0.88 0.84
Lip (R1) 16% −0.54 1.74 0.38 0.21 0.64 0.36 −0.33 0.62 0.15
Ch (L) 22% 0.02 0.62 0.94 0.48 1.45 0.35 0.96 2.72 0.32
Ch (R) 40% −0.52 1.02 0.17 −7.08 21.63 0.36 1.69 3.13 0.14
1 52% 0.02 0.10 0.51 −0.45 0.39 *0.01 −1.10 0.65 *0.00
2 40% 0.37 0.37 *0.02 −6.79 18.91 0.31 −0.83 0.65 *0.01
3 43% −0.49 0.38 *0.01 −0.51 0.58 *0.03 −0.90 0.72 *0.01
4 38% 0.43 0.58 0.06 −0.19 0.41 0.19 −0.80 1.01 *0.04
5 31% −0.28 0.40 0.07 −0.12 0.15 *0.04 −0.64 0.73 *0.03
Al (L) 63% −1.26 1.29 *0.01 −1.92 5.47 0.32 −1.32 0.93 *0.00
Al (R) 77% −3.42 13.50 0.47 −0.06 0.11 0.15 −1.62 2.22 0.06
Ac (L) 74% −1.26 1.29 *0.01 −1.92 5.47 0.32 −1.32 0.93 *0.00
Ac (R) 84% −3.42 13.50 0.47 −0.06 0.11 0.15 −1.62 2.22 0.06
Sn 29% −0.09 0.12 0.06 −2.72 9.20 0.40 −0.62 1.31 0.20
Pn 15% −0.03 0.05 0.13 0.01 0.04 0.69 −0.32 0.41 *0.04
SDstandard deviation
Asterisks indicate statistical significance between the values of pre- and post-operative measurement (P< 0.05)
In this study, despite alar cinch suturing, the alar width resulted in an increase of 4 mm after Le Fort I advancement. However, in case of Le Fort I setback, the width decreased by about 4.7 mm. Therefore, we surmise that the effect of the maxilla advancement compressing the nasal complex exceeds the effect of the cinch suturing. Although alar width widening was prevented in Le Fort I setback, it is uncertain that the alar cinch suturing was solely responsible, because the backward movement of the supporting bony structure may also have effects to prevent the widening.
The relative ratio of the soft tissue movement to the bony movement after BSSRO was only about 66% at the Li point, and 73% at B′ point. In Le Fort I ad-vancement, the ratio was 21% at the Ls point, and 14% in the Le Fort I setback. These results indicate that considering the labial tissue, more soft tissue movements occur around the mandible than the max-illary area. A similar tendency was observed in other studies. Biak and Kim reported that the proportion of soft tissue changes to hard tissue changes at the Ls point was 34% in Le Fort I advancement, and 81% at Li point in BSSRO [22]. Soncul and Bamber also pre-sented 49% of the proportion at Upper vermillion in Le Fort I advancement, and 71% at the Lower vermil-lion in BSSRO [23].
Previous studies describe that nasolabial soft tissue change following Le Fort I osteotomy occurs inconsist-ently, indicating that hard-to-soft tissue prediction is a difficult task. Nasal tip movement has been reported in 30–60% of the total maxillary advancement, and the columellar base was known to be advanced more than the nasal tip, after the anterior movement of the maxilla [24–26]. However, reports of this finding are also incon-sistent [6]. The alar width increased along the maxillary
advancement, but with wide ranges. [27–29] Van Loon et al. presented no difference in the alar width after Le Fort I advancement, between patients who had under-went an alar cinch and those who had not [30]. Howley et al. also compared a group of patients who underwent an alar cinch suture with a control group, and concluded that the alar base width eventually increased 6 months after the surgery [31]. These results are in accordance with this study, which implicates that it is hard to control the alar width despite the alar cinch suture after the maxillary advancement osteotomy.
We observed a wide variety of soft tissue response to the bony movement in this study, and this result could originate due to soft adaptation process after surgery. Although this study helps us predict the outcomes of orthognathic surgery, a large sample number is required to increase reliability and confirm the factors that influence the nasolabial soft tissue changes after orthognathic surgery. However, a struc-tured light system such as a 3D imaging method to measure facial soft tissues, provides useful and accur-ate information conveniently. Hence, this system can serve as a worthwhile tool in dentistry. In addition, there are other factors to observe soft tissue response after orthognathic surgery, such as lip thickness, volume and tonicity, which were not evaluated in this study. It should be evaluated for a future study to better understand soft tissue response.
Conclusions
Alar cinch suturing does not appear sufficient to over-come the effect of the maxilla advancement compressing the nasal complex. The nasal complex became obtuse and the alar width increased. Alar width widening was prevented in Le Fort I setback. However, it is uncertain
Table 5The relative ratio of soft tissue movement to bony movement in the anteroposterior direction and three-dimensional changes of perioral soft tissue after BSSRO
Landmarks Soft tissue/bony movement (%)
X-axis Y-axis Z-axis
mean SD P-value Mean SD P-value Mean SD P-value
Ch (L) 37% 0.45 0.60 0.09 0.26 1.27 0.60 −0.18 0.88 0.60
Ch (R) 25% −0.04 1.19 0.94 −0.33 0.54 0.16 −0.62 0.91 0.13
L4 57% 1.16 1.71 0.12 −13.89 3.94 0.39 −3.77 1.67 *0.00
R4 52% 3.32 11.19 0.46 11.60 3.14 0.37 −3.44 1.05 *0.00
Li 66% −0.26 0.82 0.44 11.48 3.11 0.37 −4.35 1.25 *0.03
6 114% −1.17 1.64 0.11 1.08 1.07 *0.04 −7.50 2.14 0.39
7 11% 0.51 1.68 0.45 0.82 2.06 0.44 0.73 0.74 *0.04
8 55% −1.26 2.15 0.17 16.70 45.04 0.37 3.61 1.30 *0.00
9 309% 1.08 1.47 0.10 −0.12 1.36 0.82 20.39 44.57 0.27
B′ 73% −0.54 0.69 0.08 −0.91 1.33 0.12 4.82 2.13 *0.00
SDstandard deviation
that the alar cinch suturing was solely responsible. The soft tissue around the mandible tends to accompany the bony movement more than the maxillary area. In addition, structured light scanning system proved to be a useful tool to evaluate the nasolabial soft tissue.
Abbreviations
2D:Two-dimensional; 3D: Three dimensional; BSSRO: Bilateral sagittal split osteotomy; CBCT: Cone beam computed tomography; LED: Light emitting diode
Availability of data and materials
The data will not be shared.
Authors’contributions
B-JC conceived the study design and treated the patients. JJ wrote the manuscript, and JJ and C-HL carried out the measurement of the outcomes. JJ and JWL interpreted the data and edited the manuscript. All authors read and approved the final manuscript.
Ethics approval and consent to participate
This study was approved by the Ethics Committee at the Kyung Hee University Dental Hospital (KHD IRB 1603–4).
Consent for publication
Not applicable.
Competing interests
The authors declare, that they have no competing interests.
Publisher’s Note
Springer Nature remains neutral with regard to jurisdictional claims in published maps and institutional affiliations.
Received: 1 November 2017 Accepted: 28 September 2018
References
1. Chew MT, Sandham A, Wong HB. Evaluation of the linearity of soft- to hard-tissue movement after orthognathic surgery. Am J Orthod Dentofac Orthop. 2008;134:665–70.
2. Olate S, Zaror C, Blythe JN, Mommaerts MY. A systematic review of soft-to-hard tissue ratios in orthognathic surgery. Part III: double jaw surgery procedures. J Craniomaxillofac Surg. 2016;44:1599–606.
3. Bailey LJ, Collie FM, White RP Jr. Long-term soft tissue changes after orthognathic surgery. Int J Adult Orthodon Orthognath Surg. 1996;11:7–18. 4. McFarlane RB, Frydman WL, McCabe SB, Mamandras AM. Identification of
nasal morphologic features that indicate susceptibility to nasal tip deflection with the LeFort I osteotomy. Am J Orthod Dentofac Orthop. 1995;107:259–67.
5. Lane C, Harrell W, Jr. Completing the 3-dimensional picture. Am J Orthod Dentofac Orthop 2008;133:612–620.
6. Muradin MS, Rosenberg AJ, van der Bilt A, Stoelinga PJ, Koole R. The influence of a Le fort I impaction and advancement osteotomy on smile using a modified alar cinch suture and V-Y closure: a prospective study. Int J Oral Maxillofac Surg. 2012;41:547–52.
7. Mustafa K, Shehzana F, Bhat HH. Assessment of alar flare and efficacy of alar cinch suture in the Management of Alar Flare Following Le Fort 1 superior repositioning: a comparative study. J Maxillofac Oral Surg. 2016;15:528–34.
8. Muradin MS, Seubring K, Stoelinga PJ, vd Bilt A, Koole R, Rosenberg AJ. A prospective study on the effect of modified alar cinch sutures and V-Y closure versus simple closing sutures on nasolabial changes after Le fort I intrusion and advancement osteotomies. J Oral Maxillofac Surg. 2011;69:870–6.
9. Gorgulu S, Gokce SM, Olmez H, Sagdic D, Ors F. Nasal cavity volume changes after rapid maxillary expansion in adolescents evaluated with 3-dimensional simulation and modeling programs. Am J Orthod Dentofac Orthop. 2011;140:633–40.
10. Miracle AC, Mukherji SK. Conebeam CT of the head and neck, part 1: physical principles. AJNR Am J Neuroradiol. 2009;30:1088–95. 11. Kau CH, Richmond S, Incrapera A, English J, Xia JJ. Three-dimensional
surface acquisition systems for the study of facial morphology and their application to maxillofacial surgery. Int J Med Robot. 2007;3:97–110. 12. Ahn HW, Chang YJ, Kim KA, Joo SH, Park YG, Park KH. Measurement of
three-dimensional perioral soft tissue changes in dentoalveolar protrusion patients after orthodontic treatment using a structured light scanner. Angle Orthod. 2014;84:795–802.
13. Lee WJLK, Yu HS, Baik HS. Lip and perioral soft tissue changes after bracket bonding using 3-D laser scanner. Korean J Orthod. 2011;41:411–22. 14. Vasudavan S, Jayaratne YS, Padwa BL. Nasolabial soft tissue changes after Le
fort I advancement. J Oral Maxillofac Surg. 2012;70:e270–7. 15. Kim YI, Park SB, Son WS, Hwang DS. Midfacial soft-tissue changes after
advancement of maxilla with Le fort I osteotomy and mandibular setback surgery: comparison of conventional and high Le fort I osteotomies by superimposition of cone-beam computed tomography volumes. J Oral Maxillofac Surg. 2011;69:e225–33.
16. Altug-Atac AT, Bolatoglu H, Memikoglu UT. Facial soft tissue profile following bimaxillary orthognathic surgery. Angle Orthod. 2008;78:50–7.
17. Ma L, Xu T, Lin J. Validation of a three-dimensional facial scanning system based on structured light techniques. Comput Methods Prog Biomed. 2009;94:290–8.
18. Kim SH, Jung WY, Seo YJ, Kim KA, Park KH, Park YG. Accuracy and precision of integumental linear dimensions in a three-dimensional facial imaging system. Korean J Orthod. 2015;45:105–12.
19. Sheen JH. Secondary rhinoplasty. Plast Reconstr Surg. 1975;56:137–45. 20. Sheen JH. Spreader graft: a method of reconstructing the roof of the
middle nasal vault following rhinoplasty. Plast Reconstr Surg. 1984;73:230–9.
21. Metzler P, Geiger EJ, Chang CC, Sirisoontorn I, Steinbacher DM. Assessment of three-dimensional nasolabial response to Le fort I advancement. J Plast Reconstr Aesthet Surg. 2014;67:756–63.
22. Baik HS, Kim SY. Facial soft-tissue changes in skeletal class III orthognathic surgery patients analyzed with 3-dimensional laser scanning. Am J Orthod Dentofac Orthop. 2010;138:167–78.
23. Soncul M, Bamber MA. Evaluation of facial soft tissue changes with optical surface scan after surgical correction of class III deformities. J Oral Maxillofac Surg. 2004;62:1331–40.
24. Freihofer HP, Jr. Changes in nasal profile after maxillary advancement in cleft and non-cleft patients. J Maxillofac Surg 1977;5:20–27.
25. Mansour S, Burstone C, Legan H. An evaluation of soft-tissue changes resulting from Le fort I maxillary surgery. Am J Orthod. 1983;84:37–47. 26. Bundgaard M, Melsen B, Terp S. Changes during and following total
maxillary osteotomy (le fort I procedure): a cephalometric study. Eur J Orthod. 1986;8:21–9.
27. Schendel SA, Williamson LW. Muscle reorientation following superior repositioning of the maxilla. J Oral Maxillofac Surg. 1983;41:235–40. 28. Carlotti AE Jr, Aschaffenburg PH, Schendel SA. Facial changes associated
with surgical advancement of the lip and maxilla. J Oral Maxillofac Surg. 1986;44:593–6.
29. Honrado CP, Lee S, Bloomquist DS, Larrabee WF Jr. Quantitative assessment of nasal changes after maxillomandibular surgery using a 3-dimensional digital imaging system. Arch Facial Plast Surg. 2006;8:26–35.
30. van Loon B, Verhamme L, Xi T, de Koning MJ, Berge SJ, Maal TJ. Three-dimensional evaluation of the alar cinch suture after Le fort I osteotomy. Int J Oral Maxillofac Surg. 2016;45:1309–14.
31. Howley C, Ali N, Lee R, Cox S. Use of the alar base cinch suture in Le fort I osteotomy: is it effective? Br J Oral Maxillofac Surg. 2011;49:127–30.