Sociodemographic Factors
and Survival of Infants With
Congenital Heart Defects
Nelson D. Pace, PhD, SM, a, b Matthew E. Oster, MD, MPH, c, d Nina E. Forestieri, MPH, b
Dianne Enright, GISP, e Jessica Knight, PhD, d Robert E. Meyer, PhD, MPHb
OBJECTIVES: To examine the first-year survival of infants with congenital heart defects (CHDs)
and investigate the potential role of socioeconomic and demographic factors on survival.
METHODS: Subjects included 15533 infants with CHDs born between 2004 and 2013
ascertained by the NC Birth Defects Monitoring Program. We classified CHDs into the following 3 groups: critical univentricular (n = 575), critical biventricular (n = 1494), and noncritical biventricular (n = 13345). We determined vital status and age at death through linkage to state vital records and used geocoded maternal residence at birth to obtain census information for study subjects. We calculated Kaplan–Meier survival estimates by maternal and infant characteristics and derived hazard ratios from Cox proportional hazard models for selected exposures.
RESULTS: Among all infants with CHDs, there were 1289 deaths (8.3%) in the first year.
Among infants with univentricular defects, 61.6% (95% confidence interval [CI]: 57.7%–
65.7%) survived. Survival among infants with univentricular defects was considerably better for those whose fathers were ≥35 years old (71.6%; 95% CI: 63.8%–80.3%)
compared with those whose fathers were younger (59.7%; 95% CI: 54.6%–65.2%). Factors associated with survival among infants with any biventricular defect included maternal education, race and/or ethnicity, marital status, and delivery at a heart center. The hazard of infant mortality was greatest among non-Hispanic African American mothers.
CONCLUSIONS: Survival among infants with critical univentricular CHDs was less variable
across sociodemographic categories compared with survival among infants with biventricular CHDs. Sociodemographic differences in survival among infants with less severe CHDs reinforces the importance of ensuring culturally effective pediatric care for at-risk infants and their families.
abstract
aDepartment of Epidemiology, Gillings School of Global Public Health, University of North Carolina at Chapel Hill,
Chapel Hill, North Carolina; bBirth Defects Monitoring Branch, and eHealth and Spatial Analysis Branch, State
Center for Health Statistics, Division of Public Health, North Carolina Department of Health and Human Services, Raleigh, North Carolina; cDivision of Pediatric Cardiology, Children’s Healthcare of Atlanta, Atlanta, Georgia; and dDepartment of Pediatrics, School of Medicine, Emory University, Atlanta, Georgia
Dr Pace conceptualized and designed the study, analyzed and interpreted the data, and drafted the initial manuscript; Dr Meyer and Ms Enright contributed to study conception and design, acquisition of data, interpretation of data, and review and revision of the manuscript;
Ms Forestieri and Drs Knight and Oster contributed to study conception and design, interpretation of data, and detailed review and revision of the manuscript; and all authors approved the final manuscript as submitted and agree to be accountable for all aspects of the work.
DOI: https:// doi. org/ 10. 1542/ peds. 2018- 0302 Accepted for publication Jun 22, 2018
WHAT’S KNOWN ON THIS SUBJECT: First-year mortality for infants with congenital heart defects remains high, and differences in survival by sociodemographic characteristics have been observed. The influence of sociodemographic factors on defects of varying severity has yet to be explored.
WHAT THIS STUDY ADDS: Survival for high severity congenital heart defects appears to be largely unassociated with common socioeconomic and demographic variables. However, for low to moderate severity defects, differences in survival were associated with several socioeconomic and demographic factors.
Congenital heart defects (CHDs), which include a wide variety of structural abnormalities, occur in 1% of births in the United States.1, 2
CHDs are the most common birth defects and the most common cause of death related to a birth defect. Critical congenital heart defects (CCHDs), the most severe forms of CHD, require surgical- or catheter-based interventions in the first year of life3 and are associated
with significant morbidity and mortality. Newborns with a CCHD who are not diagnosed with the CCHD soon after delivery are at high risk for cardiovascular shock and subsequent death when the ductus arteriosus closes.
Although 1-year survival has improved over time, mortality remains high, and several studies have revealed that the greatest risk of mortality was during the first year of life.4–6 Oster et al7
used data from the Metropolitan Atlanta Congenital Defects Program to compare mortality among infants with CCHDs. Several factors associated with lower 1-year survival were identified, including earlier birth era, diagnosis <1 day of age versus >1 day, low birth weight, and younger maternal age. Authors of a subsequent study found significantly higher infant mortality for children who were prenatally diagnosed with CCHDs compared with those who were diagnosed with CCHDs postnatally.8
The association between earlier age at diagnosis and increased mortality may be related to disease severity, but this remains unclear. In addition to these factors, the risk of CHD-related mortality has been observed to be higher in poor communities, and Hispanic and non-Hispanic African American infants with CHDs have greater mortality than similar non-Hispanic white infants.4, 5, 9 However,
research is needed to better
understand the risk of mortality for infants across varying levels of CHD severity as it relates to sociodemographic factors.
To address this gap in the literature, we aimed to compare 1-year survival of infants with CHDs on the basis of severity and to investigate the role of socioeconomic and demographic factors in survival across 3 CHD severity levels. Identifying factors associated with mortality among infants with CHDs is vital for guiding public health practice by providing information for policy development and risk-appropriate service planning. Understanding this relationship will inform prenatal and neonatal screening practice with the hope of improved survival for these infants.
METHODS
Data for this study are from the North Carolina Birth Defects Monitoring Program (NCBDMP) and cover infants who were born during the 10-year period from 2004 through 2013. The NCBDMP is a statewide, population-based, active surveillance system. The case definition includes all North Carolina resident infants born with a CHD that was diagnosed within the first year of life. NCBDMP field staff review and abstract clinical and demographic information on all cases, including medical documentation to support the diagnoses. All data from liveborn infants are linked to the infant’s birth certificate to obtain additional demographic data and to facilitate the calculation of population-level risks. Information on infant mortality, defined as death during the first year of life, was also obtained by matching surveillance data with North Carolina–linked live birth and infant death files. Maternal residence address at the time of delivery was geocoded and linked to US Census Bureau
American Community Survey 5-year estimates (2010–2014) to obtain selected census variables for analysis. Study variables included birth period (2004–2008; 2009–2013), infant sex, birth weight, gestational age, presence of extracardiac defect, plurality, maternal and paternal age, maternal education, race and/or ethnicity, parity, marital status, maternal Medicaid (defined as delivery paid by Medicaid), and birth location (pediatric heart center, other facility). Census-level variables based on maternal residence at delivery included population density, median household income, percent of the population below the poverty level, percent female head of household, and percent African American. The variables evaluated in this study were selected on the basis of relevance to socioeconomic status, clinical relevance, data availability, and data quality. We used existing data only for this study; the study was considered exempt by the North Carolina Division of Public Health Institutional Review Board. Using these data sources, we constructed a retrospective cohort of infants born with CHDs and mortality experienced by this population in the first year of life. We excluded those with trisomy 13 or 18 or anencephaly, because of the poor prognosis of infants with these conditions independent of co-occurring CHDs.
Heart Defect Classification CHDs with Centers for Disease Control and Prevention and British Pediatric Association diagnostic codes 745.000 to 747.430 were included as part of the study. CCHDs included defects likely to require intervention in the first year of life and may present with hypoxemia.7
right ventricle (DORV), Ebstein anomaly (EA), hypoplastic left heart syndrome (HLHS), interrupted aortic arch (IAA), pulmonary atresia (PA), single ventricle (SV), tricuspid atresia (TA), total anomalous pulmonary venous return (TAPVR), dextro-transposition of the great arteries (TGA), tetralogy of Fallot (TOF), and persistent truncus arteriosus (PTA). An additional, exclusive 3-level severity classification was applied to all infants with a CHD. Those levels were as follows: CCHDs with univentricular function (high severity: HLHS, SV, TA) and CCHDs typically with biventricular function (moderate severity: COA, TGA, DORV, EA, IAA, TOF, TAPVR, PTA), and all other CHDs were classified as noncritical biventricular heart defects (low severity). Severity classifications were hierarchical and exclusive (ie, an infant with multiple CHDs would be assigned a severity classification of the defect with the highest severity and would only be included in that group). Because of the high variability in severity of PA defects with intact ventricular septum, 10 these defects
were not classified on the basis of severity and therefore excluded from analyses that were dependent on severity unless an infant with PA with intact ventricular septum also had a co-occurring critical univentricular defect (HLHS, SV, or TA), in which case, that infant was classified in the critical univentricular group. Although other CHD classification systems such as the Risk Adjustment in Congenital Heart Surgery-1 and Society of Thoracic Surgeons categories are validated in children who have undergone surgery, those classification schemes are not appropriate in our population-based study in which we examine outcomes in all children with CHD, not just those who have undergone surgery. Therefore, we chose a classification scheme that has
been previously used by the Centers for Disease Control and Prevention7 and by the authors
in a separate study.11 With the
added power afforded us given the sample size in our study, we further subdivided the critical subgroup into univentricular and biventricular hearts. Survival among infants with isolated CHD(s) was also compared with infants with co-occurring extracardiac defects (ie, occurrence of additional birth defects in addition to CHDs).
Infant Death Ascertainment
Our primary outcome of interest was survival during the first year of life as ascertained from North Carolina linked birth and death files. We also assessed survival at the following 3 additional time points during the first year: first 24 hours (<1 day), early neonatal (<7 days), and neonatal (<28 days). Deaths unrelated to the heart defect (ie, injury-related deaths) were censored as part of our analysis.
Statistical Analysis
Survival among infants with CHDs was calculated as the Kaplan– Meier (KM) survival probability at 1 year of life. We plotted KM survival curves for the entire study population by CHD severity as well as key socioeconomic and demographic variables. The SE and corresponding pointwise confidence intervals (CIs) for the KM survival probabilities were estimated by using Greenwood’s formula.12 The log-rank test was
used to test differences across strata. When strata had a natural order, a log-rank test for trend was used. Cox proportional hazards models were used to calculate hazard ratios and corresponding 95% CIs. Ties were handled via Efron’s13 method. Important
assumptions of the Cox model, namely noninformative censoring
and proportional hazards, were assessed.
As has been done previously in birth defects research, to appropriately control for confounding, 14 we
selected covariates a priori using subject matter expertise and causal-directed acyclic graphs.15
The covariates included in adjusted models were maternal age, education, race and/or ethnicity (white Hispanic, African American non-Hispanic, Hispanic), marital status (yes or no), and Medicaid status (yes or no). Apart from maternal age, each of these factors was also considered in turn, while controlling for the other factors, as a relevant socioeconomic or sociodemographic indicator with potential to influence survival.
RESULTS
From an initial sample of 15 748 infants with CHDs, those with trisomy 13 or 18 (n = 211) or anencephaly (n = 4) were excluded. Less than 1% of records were not able to be successfully geocoded and were excluded as well in analyses involving geographic variables. The final analytic data set consisted of 15 533 infants among whom 2188 (14.1%) had CCHDs. Among the cases that were able to be classified into the 3 severity groups, 575 (3.7%) had a univentricular CCHD, 1494 (9.7%) had a biventricular CCHD, and 13 345 (86.6%) had noncritical biventricular CHDs (119 were classified as having isolated PA and therefore left out of the severity classification).
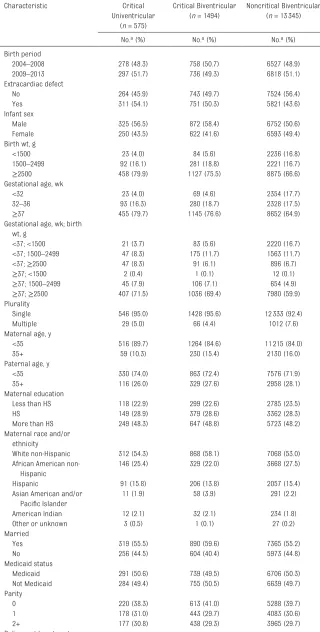
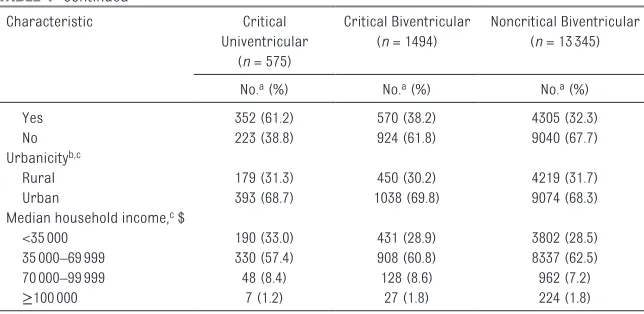
Infants with critical univentricular defects were much more likely to be delivered at a pediatric heart center than infants with critical or noncritical biventricular defects. Distributions of birth period, maternal and paternal age, maternal education, race and/or ethnicity, marital status, Medicaid status, and parity were similar across severity groups. Group-level census variables (urbanicity, median household income, population density, percent of the population below the poverty level, percent female head of household, and percent African American) also appeared evenly distributed across severity groups (Tables 1 and 2).
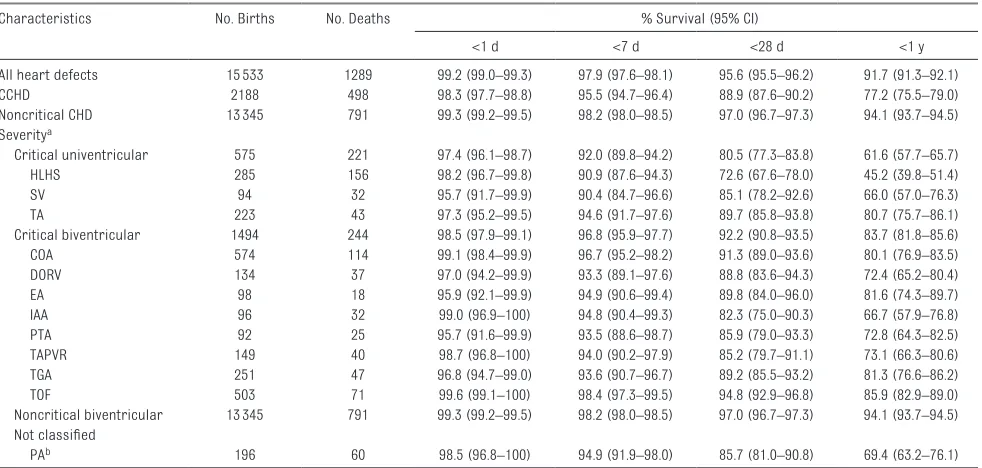
Among all infants with a CHD, there were 1307 deaths (8.4%); 18 deaths were injury-related and were censored from the at-risk population at time of death. Overall survival during the first year of life was 91.7% (95% CI: 91.3%–92.1%) (Table 3). Infants with CCHDs had much poorer first-year survival (77.2%; 95% CI: 75.5%–79.0%) compared with infants with noncritical CHDs (94.1%; 95% CI: 93.7%–94.5%;
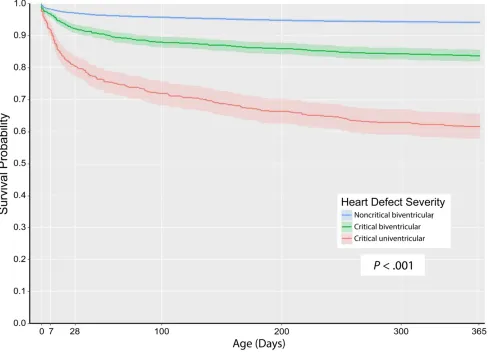
P < .001). Across the 3-level severity groups, there was a clear trend of decreasing first-year survival (P < .001) as follows: noncritical biventricular (94.1%; 95% CI: 93.7%–94.5%), critical biventricular (83.7%; 95% CI: 81.8%–85.6%), and critical univentricular defects (61.6%; 95% CI: 57.7%–65.7%) (Table 3, Fig 1). Approximately 50% of all mortality during the first year of life, irrespective of defect severity, occurred in the neonatal period (first 28 days). There was substantial variability in survival within severity groups during the first year of life. When examining specific CCHDs, HLHS was the most lethal with only 45.2% (95% CI: 39.8%–51.4%) of infants surviving the first year, whereas TOF was
TABLE 1 Characteristics of Infants With CHDs by Level of Severity (North Carolina, 2004–2013)
Characteristic Critical
Univentricular (n = 575)
Critical Biventricular (n = 1494)
Noncritical Biventricular (n = 13345)
No.a (%) No.a (%) No.a (%)
Birth period
2004–2008 278 (48.3) 758 (50.7) 6527 (48.9)
2009–2013 297 (51.7) 736 (49.3) 6818 (51.1)
Extracardiac defect
No 264 (45.9) 743 (49.7) 7524 (56.4)
Yes 311 (54.1) 751 (50.3) 5821 (43.6)
Infant sex
Male 325 (56.5) 872 (58.4) 6752 (50.6)
Female 250 (43.5) 622 (41.6) 6593 (49.4)
Birth wt, g
<1500 23 (4.0) 84 (5.6) 2236 (16.8)
1500–2499 92 (16.1) 281 (18.8) 2221 (16.7)
≥2500 458 (79.9) 1127 (75.5) 8875 (66.6)
Gestational age, wk
<32 23 (4.0) 69 (4.6) 2354 (17.7)
32–36 93 (16.3) 280 (18.7) 2328 (17.5)
≥37 455 (79.7) 1145 (76.6) 8652 (64.9)
Gestational age, wk; birth wt, g
<37; <1500 21 (3.7) 83 (5.6) 2220 (16.7)
<37; 1500–2499 47 (8.3) 175 (11.7) 1563 (11.7)
<37; ≥2500 47 (8.3) 91 (6.1) 896 (6.7)
≥37; <1500 2 (0.4) 1 (0.1) 12 (0.1)
≥37; 1500–2499 45 (7.9) 106 (7.1) 654 (4.9)
≥37; ≥2500 407 (71.5) 1036 (69.4) 7980 (59.9)
Plurality
Single 546 (95.0) 1428 (95.6) 12333 (92.4)
Multiple 29 (5.0) 66 (4.4) 1012 (7.6)
Maternal age, y
<35 516 (89.7) 1264 (84.6) 11215 (84.0)
35+ 59 (10.3) 230 (15.4) 2130 (16.0)
Paternal age, y
<35 330 (74.0) 863 (72.4) 7576 (71.9)
35+ 116 (26.0) 329 (27.6) 2958 (28.1)
Maternal education
Less than HS 118 (22.9) 299 (22.6) 2785 (23.5)
HS 149 (28.9) 379 (28.6) 3362 (28.3)
More than HS 249 (48.3) 647 (48.8) 5723 (48.2)
Maternal race and/or ethnicity
White non-Hispanic 312 (54.3) 868 (58.1) 7068 (53.0)
African American non-Hispanic
146 (25.4) 329 (22.0) 3668 (27.5)
Hispanic 91 (15.8) 206 (13.8) 2057 (15.4)
Asian American and/or Pacific Islander
11 (1.9) 58 (3.9) 291 (2.2)
American Indian 12 (2.1) 32 (2.1) 234 (1.8)
Other or unknown 3 (0.5) 1 (0.1) 27 (0.2)
Married
Yes 319 (55.5) 890 (59.6) 7365 (55.2)
No 256 (44.5) 604 (40.4) 5973 (44.8)
Medicaid status
Medicaid 291 (50.6) 739 (49.5) 6706 (50.3)
Not Medicaid 284 (49.4) 755 (50.5) 6639 (49.7)
Parity
0 220 (38.3) 613 (41.0) 5288 (39.7)
1 178 (31.0) 443 (29.7) 4083 (30.6)
2+ 177 (30.8) 438 (29.3) 3965 (29.7)
associated with the highest survival (85.9%; 95% CI: 82.9%– 89.0%); infants can have >1 CCHD because specific CCHDs are not exclusive.
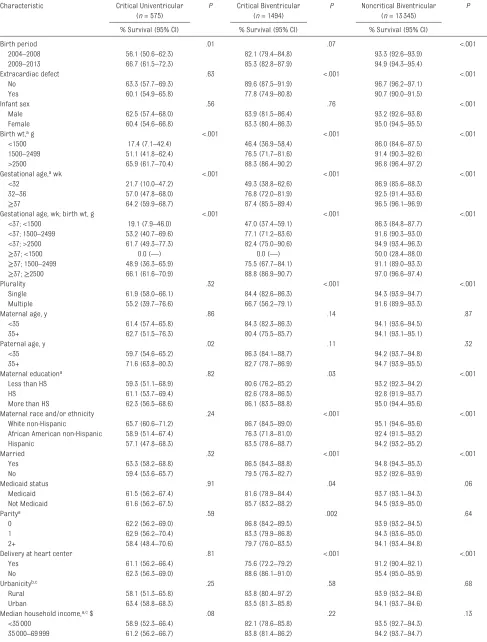
Infants born in the latter 5 years of the study (2009–2013) had markedly better survival than those born in the earlier 5 years (2004–2008) across severity classes (Table 4). Clinical characteristics such as gestational age and birth weight were also among the factors most strongly associated with survival across all levels of severity. Among infants with critical univentricular CHDs, few other risk factors were associated with survival, with the exception of paternal age, in which survival was better for infants of fathers ≥35 years compared with infants of younger fathers (71.6% and 59.7%, respectively). In contrast, among infants with less severe phenotypes, paternal age was not associated with survival, whereas several other risk factors were, including presence of an extracardiac defect, plurality, maternal education, race and/or ethnicity, marital status, Medicaid status, birth at a pediatric heart center, and percent of female heads of household in the census tract of residence.
After further examination of selected risk factors in multivariable models adjusted for potential confounding, we found that among infants with noncritical biventricular CHDs, those born to unmarried mothers had an adjusted hazard ratio 1.45 (95% CI: 1.03–2.04) times that of infants born to married mothers (Table 5). Likewise, among infants with moderate and less severe CHDs, lower maternal education was associated with an increased hazard of infant mortality. Also, among infants with moderate and less severe CHDs, we observed a consistently elevated hazard of infant mortality among infants born to non-Hispanic African American mothers. Maternal Medicaid status was not significantly associated with increased or decreased hazard of infant mortality for any of the severity classes after adjustment for potential confounding.
DISCUSSION
In this study of first-year survival of infants born with CHDs, we found that survival is most strongly associated with the severity of the defect, gestational age, and birth
weight. Improvements in survival were also apparent between the early and later years of the study. Consistent with previous studies, 4, 5, 9
we also found associations between survival and sociodemographic characteristics, especially maternal race and/or ethnicity, education, and marital status; however, these associations varied by severity of the lesion.
Our analysis of socioeconomic factors revealed few clear associations with survival among critical univentricular CHDs; 1 exception was paternal age. Several other factors were associated with survival among infants with biventricular defects. One explanation for this observation may be that a survival trajectory among the high severity CHDs is largely set by the defect itself, whereas survival among infants with less severe CHDs has more potential to be influenced by sociodemographic factors. Community-level factors were generally not strongly associated with mortality, which is incongruent with some previous studies in which authors found increased mortality among more disadvantaged communities.16 One
explanation for these disparate findings is that, in our study, we covered a more recent time period (2004–2013) than that of the aforementioned study (1999– 2007) and may be a reflection of increased access to pediatric critical cardiac care through the now widespread use of innovations such as tele-echocardiography, training of community-based sonographers, and strengthening of regional pediatric cardiac referral networks.17 Use of newborn pulse
oximetry for detection of CCHDs, although not universally mandated in North Carolina until 2015, had also become more prevalent during the latter years of our study. These medical advances likely contributed
Characteristic Critical
Univentricular (n = 575)
Critical Biventricular (n = 1494)
Noncritical Biventricular (n = 13345)
No.a (%) No.a (%) No.a (%)
Yes 352 (61.2) 570 (38.2) 4305 (32.3)
No 223 (38.8) 924 (61.8) 9040 (67.7)
Urbanicityb, c
Rural 179 (31.3) 450 (30.2) 4219 (31.7)
Urban 393 (68.7) 1038 (69.8) 9074 (68.3)
Median household income, c $
<35000 190 (33.0) 431 (28.9) 3802 (28.5)
35000–69999 330 (57.4) 908 (60.8) 8337 (62.5)
70000–99999 48 (8.4) 128 (8.6) 962 (7.2)
≥100000 7 (1.2) 27 (1.8) 224 (1.8)
HS, high school.
a The numbers shown for each characteristic may not add up to the total number of infants in each category because of missing information for some individuals.
b Rural is defined as residence in a census tract with <250 persons per square mile based on the population from the 2010 census. Urban indicates a residence in a tract with ≥250 persons per square mile.
c Group-level variable is based on census tract information corresponding to the mother’s residence as recorded on the birth certificate.
to the improved survival in our study population over time and may have helped mitigate the community-level disparities in mortality that we had expected to observe.18 Delivery at a pediatric
heart center did not confer a survival advantage among infants with critical univentricular CHDs and was associated with poorer outcomes among infants with biventricular defects. This may be due to selective referral of infants prenatally diagnosed with more severe CCHDs or more complex
diagnoses, such as syndromic conditions.
Although we found few consistent patterns of
community-level influences on survival, examination of individual-level sociodemographic factors revealed greater differences, particularly among infants with biventricular CHDs. Adjusted models revealed that lower maternal education and non-Hispanic African American race and ethnicity were associated with poorer survival in infants
with biventricular CHDs. These differences may reflect other characteristics such as health literacy among mothers with less education, which could influence early symptom recognition, health care use, and access to care. One study in which authors examined the role of access to care in explaining racial and ethnic disparities in postoperative CHD mortality found that adjustment for insurance type and treatment in specialty care center did not attenuate the association with TABLE 3 Survival of Infants With CHDs by Phenotype (North Carolina, 2004–2013)
Characteristics No. Births No. Deaths % Survival (95% CI)
<1 d <7 d <28 d <1 y
All heart defects 15533 1289 99.2 (99.0–99.3) 97.9 (97.6–98.1) 95.6 (95.5–96.2) 91.7 (91.3–92.1)
CCHD 2188 498 98.3 (97.7–98.8) 95.5 (94.7–96.4) 88.9 (87.6–90.2) 77.2 (75.5–79.0)
Noncritical CHD 13345 791 99.3 (99.2–99.5) 98.2 (98.0–98.5) 97.0 (96.7–97.3) 94.1 (93.7–94.5) Severitya
Critical univentricular 575 221 97.4 (96.1–98.7) 92.0 (89.8–94.2) 80.5 (77.3–83.8) 61.6 (57.7–65.7)
HLHS 285 156 98.2 (96.7–99.8) 90.9 (87.6–94.3) 72.6 (67.6–78.0) 45.2 (39.8–51.4)
SV 94 32 95.7 (91.7–99.9) 90.4 (84.7–96.6) 85.1 (78.2–92.6) 66.0 (57.0–76.3)
TA 223 43 97.3 (95.2–99.5) 94.6 (91.7–97.6) 89.7 (85.8–93.8) 80.7 (75.7–86.1)
Critical biventricular 1494 244 98.5 (97.9–99.1) 96.8 (95.9–97.7) 92.2 (90.8–93.5) 83.7 (81.8–85.6)
COA 574 114 99.1 (98.4–99.9) 96.7 (95.2–98.2) 91.3 (89.0–93.6) 80.1 (76.9–83.5)
DORV 134 37 97.0 (94.2–99.9) 93.3 (89.1–97.6) 88.8 (83.6–94.3) 72.4 (65.2–80.4)
EA 98 18 95.9 (92.1–99.9) 94.9 (90.6–99.4) 89.8 (84.0–96.0) 81.6 (74.3–89.7)
IAA 96 32 99.0 (96.9–100) 94.8 (90.4–99.3) 82.3 (75.0–90.3) 66.7 (57.9–76.8)
PTA 92 25 95.7 (91.6–99.9) 93.5 (88.6–98.7) 85.9 (79.0–93.3) 72.8 (64.3–82.5)
TAPVR 149 40 98.7 (96.8–100) 94.0 (90.2–97.9) 85.2 (79.7–91.1) 73.1 (66.3–80.6)
TGA 251 47 96.8 (94.7–99.0) 93.6 (90.7–96.7) 89.2 (85.5–93.2) 81.3 (76.6–86.2)
TOF 503 71 99.6 (99.1–100) 98.4 (97.3–99.5) 94.8 (92.9–96.8) 85.9 (82.9–89.0)
Noncritical biventricular 13345 791 99.3 (99.2–99.5) 98.2 (98.0–98.5) 97.0 (96.7–97.3) 94.1 (93.7–94.5) Not classified
PAb 196 60 98.5 (96.8–100) 94.9 (91.9–98.0) 85.7 (81.0–90.8) 69.4 (63.2–76.1)
Although severity categories are exclusive, specific defect types are not (eg, an infant with HLHS can also have COA). Noncritical CHD and noncritical biventricular defects are the same groupings.
aP value corresponds to a log-rank test for trend.
b Although 196 infants had a PA diagnosis, because of the high variability in severity of PA defects, PA defects were not classified on the basis of severity and therefore dropped from analyses dependent on severity. The exception to this was if an infant with PA also had a co-occurring critical univentricular defect (HLHS, SV, or TA) (n = 77), in which case that infant was classified in the highest severity group, critical univentricular.
TABLE 2 Sociodemographic Characteristics of Infants With CHDs by Level of Severity (North Carolina, 2004–2013)
Characteristica Critical Univentricular (n = 575) Critical Biventricular (n = 1494) Noncritical Biventricular (n = 13345)
Median (Q1, Q3) Median (Q1, Q3) Median (Q1, Q3)
Population densityb 618 (171, 1865) 634 (185, 1857) 638 (162, 1882)
Below poverty level, % 15.2 (9.2, 23.0) 14.2 (8.9, 22.5) 14.8 (9.0, 22.3)
Median household income, $ 41088 (32083, 53188) 42244 (33430, 53882) 42302 (33722, 53313)
Female head of household, % 20.2 (13.4, 30.1) 19.4 (12.6, 27.9) 19.7 (13.3, 28.8)
African American, % 19.2 (7.4, 36.3) 17.5 (7.5, 35.3) 19.2 (7.7, 37.1)
Q1, quartile 1; Q3, quartile 3.
race.19 However, the authors
of this previous study assessed mortality from those surviving to operative treatment; the potential influence of access to care could be greater in our study, in which we consider mortality from birth. Additionally, marital status may influence the hazard of infant mortality, particularly for infants with critical biventricular CHDs. Marital status may be an indicator of second-parent involvement and greater social support. The lack of association with the other CHD groups may indicate that this is simply a spurious association, or that, as previously mentioned, the importance of sociodemographic factors differs by defect severity.
No clear pattern was found between maternal Hispanic ethnicity and infant survival, although suggested in the results is lower survival for those with critical univentricular and noncritical biventricular CHDs compared with infants of non-Hispanic white mothers. Authors of another study observed increased mortality with Hispanic ethnicity in patients with PA without ventricular septal defect and HLHS, which concurs with the slight increased mortality we observed in those with univentricular CHDs.9 Other
studies have been mixed in their findings of an association between Hispanic ethnicity and mortality in children with CHDs.20–23 In some
evidence, it is suggested that other
factors related to ethnicity, including language and culture, may be of more importance and could be used to explain some discrepancies in findings.21–23
This study had some limitations. First, the data set lacked individual-level information on family income and some other socioeconomic determinants of health. This limited our ability to comprehensively consider socioeconomic status as a risk factor for mortality, although we were able to use Medicaid status as a proxy for income and capture socioeconomic status through maternal education, age, and marital status. Second, numerous statistical tests were conducted,
FIGURE 1
TABLE 4 First-Year Survival Probability of Infants With CHDs by Maternal and Infant Characteristics (North Carolina, 2004–2013) Characteristic Critical Univentricular
(n = 575)
P Critical Biventricular (n = 1494)
P Noncritical Biventricular (n = 13345)
P
% Survival (95% CI) % Survival (95% CI) % Survival (95% CI)
Birth period .01 .07 <.001
2004–2008 56.1 (50.6–62.3) 82.1 (79.4–84.8) 93.3 (92.6–93.9)
2009–2013 66.7 (61.5–72.3) 85.3 (82.8–87.9) 94.9 (94.3–95.4)
Extracardiac defect .63 <.001 <.001
No 63.3 (57.7–69.3) 89.6 (87.5–91.9) 96.7 (96.2–97.1)
Yes 60.1 (54.9–65.8) 77.8 (74.9–80.8) 90.7 (90.0–91.5)
Infant sex .56 .76 <.001
Male 62.5 (57.4–68.0) 83.9 (81.5–86.4) 93.2 (92.6–93.8)
Female 60.4 (54.6–66.8) 83.3 (80.4–86.3) 95.0 (94.5–95.5)
Birth wt, a g <.001 <.001 <.001
<1500 17.4 (7.1–42.4) 46.4 (36.9–58.4) 86.0 (84.6–87.5)
1500–2499 51.1 (41.8–62.4) 76.5 (71.7–81.6) 91.4 (90.3–92.6)
>2500 65.9 (61.7–70.4) 88.3 (86.4–90.2) 96.8 (96.4–97.2)
Gestational age, a wk <.001 <.001 <.001
<32 21.7 (10.0–47.2) 49.3 (38.8–62.6) 86.9 (85.6–88.3)
32–36 57.0 (47.8–68.0) 76.8 (72.0–81.9) 92.5 (91.4–93.6)
≥37 64.2 (59.9–68.7) 87.4 (85.5–89.4) 96.5 (96.1–96.9)
Gestational age, wk; birth wt, g <.001 <.001 <.001
<37; <1500 19.1 (7.9–46.0) 47.0 (37.4–59.1) 86.3 (84.8–87.7)
<37; 1500–2499 53.2 (40.7–69.6) 77.1 (71.2–83.6) 91.6 (90.3–93.0)
<37; >2500 61.7 (49.3–77.3) 82.4 (75.0–90.6) 94.9 (93.4–96.3)
≥37; <1500 0.0 (—) 0.0 (—) 50.0 (28.4–88.0)
≥37; 1500–2499 48.9 (36.3–65.9) 75.5 (67.7–84.1) 91.1 (89.0–93.3)
≥37; ≥2500 66.1 (61.6–70.9) 88.8 (86.9–90.7) 97.0 (96.6–97.4)
Plurality .32 <.001 <.001
Single 61.9 (58.0–66.1) 84.4 (82.6–86.3) 94.3 (93.9–94.7)
Multiple 55.2 (39.7–76.6) 66.7 (56.2–79.1) 91.6 (89.9–93.3)
Maternal age, y .86 .14 .87
<35 61.4 (57.4–65.8) 84.3 (82.3–86.3) 94.1 (93.6–94.5)
35+ 62.7 (51.5–76.3) 80.4 (75.5–85.7) 94.1 (93.1–95.1)
Paternal age, y .02 .11 .32
<35 59.7 (54.6–65.2) 86.3 (84.1–88.7) 94.2 (93.7–94.8)
35+ 71.6 (63.8–80.3) 82.7 (78.7–86.9) 94.7 (93.9–95.5)
Maternal educationa .82 .03 <.001
Less than HS 59.3 (51.1–68.9) 80.6 (76.2–85.2) 93.2 (92.3–94.2)
HS 61.1 (53.7–69.4) 82.6 (78.8–86.5) 92.8 (91.9–93.7)
More than HS 62.3 (56.5–68.6) 86.1 (83.5–88.8) 95.0 (94.4–95.6)
Maternal race and/or ethnicity .24 <.001 <.001
White non-Hispanic 65.7 (60.6–71.2) 86.7 (84.5–89.0) 95.1 (94.6–95.6)
African American non-Hispanic 58.9 (51.4–67.4) 76.3 (71.8–81.0) 92.4 (91.5–93.2)
Hispanic 57.1 (47.8–68.3) 83.5 (78.6–88.7) 94.2 (93.2–95.2)
Married .32 <.001 <.001
Yes 63.3 (58.2–68.8) 86.5 (84.3–88.8) 94.8 (94.3–95.3)
No 59.4 (53.6–65.7) 79.5 (76.3–82.7) 93.2 (92.6–93.9)
Medicaid status .91 .04 .06
Medicaid 61.5 (56.2–67.4) 81.6 (78.9–84.4) 93.7 (93.1–94.3)
Not Medicaid 61.6 (56.2–67.5) 85.7 (83.2–88.2) 94.5 (93.9–95.0)
Paritya .59 .002 .64
0 62.2 (56.2–69.0) 86.8 (84.2–89.5) 93.9 (93.2–94.5)
1 62.9 (56.2–70.4) 83.3 (79.9–86.8) 94.3 (93.6–95.0)
2+ 58.4 (48.4–70.6) 79.7 (76.0–83.5) 94.1 (93.4–94.8)
Delivery at heart center .81 <.001 <.001
Yes 61.1 (56.2–66.4) 75.6 (72.2–79.2) 91.2 (90.4–92.1)
No 62.3 (56.3–69.0) 88.6 (86.1–91.0) 95.4 (95.0–95.9)
Urbanicityb, c .25 .58 .68
Rural 58.1 (51.3–65.8) 83.8 (80.4–97.2) 93.9 (93.2–94.6)
Urban 63.4 (58.8–68.3) 83.5 (81.3–85.8) 94.1 (93.7–94.6)
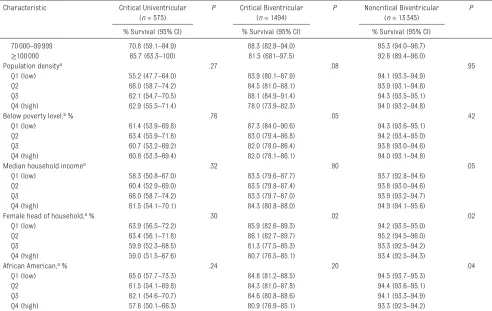
Median household income, a, c $ .08 .22 .13
<35000 58.9 (52.3–66.4) 82.1 (78.6–85.8) 93.5 (92.7–94.3)
and some results could be due to chance. To delineate the strength of associations and the precision of estimates, CIs are provided for each
estimate. Additionally, the use of state death files to determine infant mortality could potentially have resulted in underascertainment of
deaths, because of name changes, missing linkage variables, or families moving out of state. This underascertainment may have led Characteristic Critical Univentricular
(n = 575)
P Critical Biventricular (n = 1494)
P Noncritical Biventricular (n = 13345)
P
% Survival (95% CI) % Survival (95% CI) % Survival (95% CI)
70000–99999 70.8 (59.1–84.9) 88.3 (82.9–94.0) 95.3 (94.0–96.7)
≥100000 85.7 (63.3–100) 81.5 (681–97.5) 92.6 (89.4–96.0)
Population densitya .27 .08 .95
Q1 (low) 55.2 (47.7–64.0) 83.9 (80.1–87.9) 94.1 (93.3–94.9)
Q2 66.0 (58.7–74.2) 84.5 (81.0–88.1) 93.9 (93.1–94.8)
Q3 62.1 (54.7–70.5) 88.1 (84.9–91.4) 94.3 (93.5–95.1)
Q4 (high) 62.9 (55.5–71.4) 78.0 (73.9–82.3) 94.0 (93.2–94.8)
Below poverty level, a % .76 .05 .42
Q1 (low) 61.4 (53.9–69.8) 87.3 (84.0–90.6) 94.3 (93.6–95.1)
Q2 63.4 (55.9–71.8) 83.0 (79.4–86.8) 94.2 (93.4–95.0)
Q3 60.7 (53.2–69.2) 82.0 (78.0–86.4) 93.8 (93.0–94.6)
Q4 (high) 60.8 (53.3–69.4) 82.0 (78.1–86.1) 94.0 (93.1–94.8)
Median household incomea .32 .80 .05
Q1 (low) 58.3 (50.8–67.0) 83.5 (79.6–87.7) 93.7 (92.8–94.6)
Q2 60.4 (52.9–69.0) 83.5 (79.8–87.4) 93.8 (93.0–94.6)
Q3 66.0 (58.7–74.2) 83.3 (79.7–87.0) 93.9 (93.2–94.7)
Q4 (high) 61.5 (54.1–70.1) 84.3 (80.8–88.0) 94.9 (94.1–95.6)
Female head of household, a % .30 .02 .02
Q1 (low) 63.9 (56.5–72.2) 85.9 (82.6–89.3) 94.2 (93.5–95.0)
Q2 63.4 (56.1–71.8) 86.1 (82.7–89.7) 95.2 (94.5–96.0)
Q3 59.9 (52.3–68.5) 81.3 (77.5–85.3) 93.3 (92.5–94.2)
Q4 (high) 59.0 (51.5–67.6) 80.7 (76.5–85.1) 93.4 (92.5–94.3)
African American, a % .24 .20 .04
Q1 (low) 65.0 (57.7–73.3) 84.8 (81.2–88.5) 94.5 (93.7–95.3)
Q2 61.5 (54.1–69.8) 84.3 (81.0–87.8) 94.4 (93.6–95.1)
Q3 62.1 (54.6–70.7) 84.6 (80.8–88.6) 94.1 (93.3–94.9)
Q4 (high) 57.6 (50.1–66.3) 80.9 (76.9–85.1) 93.3 (92.5–94.2)
HS, high school; Q1, quartile 1; Q2, quartile 2; Q3, quartile 3; Q4, quartile 4; —, not applicable. aP value corresponds to a log-rank test for trend.
b Rural is defined as residence in a census tract with <250 persons per square mile based on the population from the 2010 census. Urban indicates residence in a tract with ≥250 persons per square mile.
c Group-level variable is based on census tract information corresponding to the mother’s residence as recorded on the birth certificate. TABLE 4 Continued
TABLE 5 Adjusted Hazard Ratios of First-Year Mortality of Infants With CHDs by Maternal Characteristics (North Carolina, 2004–2013)
Maternal Characteristic Critical Univentricular (n = 575) Critical Biventricular (n = 1494) Noncritical Biventricular (n = 13345)
HR (95% CI) HR (95% CI) HR (95% CI)
Education
Less than HS 0.90 (0.59–1.37) 1.36 (0.91–2.03) 1.21 (0.96–1.51)
HS 0.96 (0.67–1.37) 1.25 (0.88–1.78) 1.33 (1.10–1.60)
More than HS 1.0 (reference) 1.0 (reference) 1.0 (reference)
Race and/or ethnicity
White non-Hispanic 1.0 (reference) 1.0 (reference) 1.0 (reference)
African American non-Hispanic 1.16 (0.80–1.68) 1.68 (1.21–2.33) 1.52 (1.27–1.81)
Hispanic 1.27 (0.83–1.96) 0.97 (0.62–1.53) 1.18 (0.93–1.50)
Married
Yes 1.0 (reference) 1.0 (reference) 1.0 (reference)
No 1.13 (0.79–1.61) 1.45 (1.04–2.04) 1.01 (0.84–1.21)
Medicaid status
Medicaid 0.85 (0.61–1.19) 0.99 (0.73–1.36) 0.98 (0.83–1.16)
Not Medicaid 1.0 (reference) 1.0 (reference) 1.0 (reference)
to smaller or larger effect estimates in certain scenarios (eg, if Hispanic ethnicity was associated with moving from the state and
therefore underascertained, it could result in upward bias of overall survival or a downward bias of the hazard ratio of mortality among infants born to Hispanic mothers).24
However, because our study was restricted to survival within the first year of life, the potential for loss-to-follow-up would likely be relatively small. The strengths of this study include a large sample size of >15 000 births with CHDs. The surveillance program is robust and active with case verification including thorough medical record abstraction used to include and define the vast majority of cases in the state. We had the benefit of data at both the individual level and census-tract level; census tract information allowed us to
consider elements of the societal environment in which the child was born as well as proxies for individual-level data (eg, median household income).
CONCLUSIONS
CHD survival continues to improve with time and is highly dependent on the severity and type of defect. Sociodemographic differences in survival for less severe lesions observed in this study warrant further attention. Such disparities may be addressed, in part, by ensuring that culturally sensitive and effective pediatric care is provided to all patients with CHD and their families.25
Further research into the underlying mediators of these disparities is also warranted to formulate targeted interventions to reduce these gaps.
REFERENCES
1. Reller MD, Strickland MJ, Riehle-Colarusso T, Mahle WT, Correa A. Prevalence of congenital heart defects in metropolitan Atlanta, 1998-2005.
J Pediatr. 2008;153(6):807–813 2. van der Bom T, Zomer AC, Zwinderman
AH, Meijboom FJ, Bouma BJ, Mulder BJ. The changing epidemiology of congenital heart disease. Nat Rev Cardiol. 2011;8(1):50–60
3. Mahle WT, Newburger JW, Matherne GP, et al; American Heart Association Congenital Heart Defects Committee of the Council on Cardiovascular Disease in the Young; Council on Cardiovascular Nursing; Interdisciplinary Council on Quality of Care and Outcomes Research; American Academy of Pediatrics
Section on Cardiology and Cardiac Surgery; Committee on Fetus and Newborn. Role of pulse oximetry in examining newborns for congenital heart disease: a scientific statement from the American Heart Association and American Academy of
Pediatrics. Circulation. 2009;120(5): 447–458
4. Wang Y, Liu G, Druschel CM, Kirby RS. Maternal race/ethnicity and survival experience of children with congenital heart disease. J Pediatr. 2013;163(5):1437–1442.e1–e2 5. Wang Y, Liu G, Canfield MA, et al;
National Birth Defects Prevention Network. Racial/ethnic differences in survival of United States children with birth defects: a population-based
study. J Pediatr. 2015;166(4):819–826. e1–e2
6. Siffel C, Riehle-Colarusso T, Oster ME, Correa A. Survival of children with hypoplastic left heart syndrome.
Pediatrics. 2015;136(4). Available at: www. pediatrics. org/ cgi/ content/ full/ 136/ 4/ e864
7. Oster ME, Lee KA, Honein MA, Riehle-Colarusso T, Shin M, Correa A. Temporal trends in survival among infants with critical congenital heart defects. Pediatrics. 2013;131(5). Available at: www. pediatrics. org/ cgi/ content/ full/ 131/ 5/ e1502
8. Oster ME, Kim CH, Kusano AS, et al. A population-based study of the association of prenatal diagnosis Address correspondence to Nelson D. Pace, PhD, SM, Health Sciences Center, Exponent, Inc, 475 14th St, Suite 400, Oakland, CA 94612. E-mail: npace@exponent.com PEDIATRICS (ISSN Numbers: Print, 0031-4005; Online, 1098-4275).
Copyright © 2018 by the American Academy of Pediatrics
FINANCIAL DISCLOSURE: The authors have indicated they have no financial relationships relevant to this article to disclose. FUNDING: No external funding.
POTENTIAL CONFLICT OF INTEREST: The authors have indicated they have no potential conflicts of interest to disclose.
ABBREVIATIONS
CCHD: critical congenital heart defect
CHD: congenital heart defect CI: confidence interval COA: coarctation of the aorta DORV: double-outlet right ventricle EA: Ebstein anomaly
HLHS: hypoplastic left heart syndrome
IAA: interrupted aortic arch KM: Kaplan–Meier
NCBDMP: North Carolina Birth Defects Monitoring Program
PA: pulmonary atresia
PTA: persistent truncus arteriosus SV: single ventricle
TA: tricuspid atresia TAPVR: total anomalous
pulmonary venous return TGA: dextro-transposition of the
with survival rate for infants with congenital heart defects. Am J Cardiol. 2014;113(6):1036–1040
9. Nembhard WN, Salemi JL, Ethen MK, Fixler DE, Dimaggio A, Canfield MA. Racial/ethnic disparities in risk of early childhood mortality among children with congenital heart defects.
Pediatrics. 2011;127(5). Available at: www. pediatrics. org/ cgi/ content/ full/ 127/ 5/ e1128
10. Karamlou T, Poynter JA, Walters HL III, et al. Long-term functional health status and exercise test variables for patients with pulmonary atresia with intact ventricular septum: a Congenital Heart Surgeons Society study. J Thorac Cardiovasc Surg. 2013;145(4):1018– 1025; discussion 1025–1027
11. Oster ME, Watkins S, Hill KD, Knight JH, Meyer RE. Academic outcomes in children with congenital heart defects: a population-based cohort study. Circ Cardiovasc Qual Outcomes. 2017;10(2):e003074
12. Greenwood M Jr. A report on the natural duration of cancer. Ministry of Health Reports on Public Health and Medical Subjects. 1926;33:1–26 13. Efron B. The efficiency of Cox’s
likelihood function for censored data.
J Am Stat Assoc. 1977;72(359): 557–565
14. Pace ND, Desrosiers TA, Carmichael SL, Shaw GM, Olshan AF, Siega-Riz AM;
National Birth Defects Prevention Study. Antioxidant consumption is associated with decreased odds of congenital limb deficiencies. Paediatr Perinat Epidemiol. 2018;32(1):90–99 15. Greenland S, Pearl J, Robins JM.
Causal diagrams for epidemiologic research. Epidemiology.
1999;10(1):37–48
16. Kucik JE, Nembhard WN, Donohue P, et al. Community socioeconomic disadvantage and the survival of infants with congenital heart defects. Am J Public Health. 2014;104(11):e150–e157
17. Satou GM, Rheuban K, Alverson D, et al; American Heart Association Congenital Cardiac Disease Committee of the Council on Cardiovascular Disease in the Young and Council on Quality Care and Outcomes Research. Telemedicine in pediatric cardiology: a scientific statement from the American Heart Association. Circulation. 2017;135(11):e648–e678
18. Abouk R, Grosse SD, Ailes EC, Oster ME. Association of US state implementation of newborn screening policies for critical congenital heart disease with early infant cardiac deaths. JAMA. 2017;318(21):2111–2118
19. Oster ME, Strickland MJ, Mahle WT. Racial and ethnic disparities in post-operative mortality following congenital heart surgery. J Pediatr. 2011;159(2):222–226
20. Kucik JE, Cassell CH, Alverson CJ, et al. Role of health insurance on the survival of infants with congenital heart defects. Am J Public Health. 2014;104(9):e62–e70
21. Fixler DE, Nembhard WN, Xu P, Ethen MK, Canfield MA. Effect of acculturation and distance from cardiac center on congenital heart disease mortality. Pediatrics. 2012;129(6):1118–1124
22. Gonzalez PC, Gauvreau K, Demone JA, Piercey GE, Jenkins KJ. Regional racial and ethnic differences in mortality for congenital heart surgery in children may reflect unequal access to care. Pediatr Cardiol. 2003;24(2): 103–108
23. Benavidez OJ, Gauvreau K, Jenkins KJ. Racial and ethnic disparities in mortality following congenital heart surgery. Pediatr Cardiol. 2006;27(3):321–328
24. VanderWeele TJ, Hernán MA, Robins JM. Causal directed acyclic graphs and the direction of unmeasured confounding bias.
Epidemiology. 2008;19(5): 720–728
25. Britton CV; American Academy of Pediatrics Committee on Pediatric Workforce. Ensuring culturally effective pediatric care: implications for education and health policy.
DOI: 10.1542/peds.2018-0302 originally published online August 15, 2018;
2018;142;
Pediatrics
and Robert E. Meyer
Nelson D. Pace, Matthew E. Oster, Nina E. Forestieri, Dianne Enright, Jessica Knight
Defects
Sociodemographic Factors and Survival of Infants With Congenital Heart
Services
Updated Information &
http://pediatrics.aappublications.org/content/142/3/e20180302 including high resolution figures, can be found at:
References
http://pediatrics.aappublications.org/content/142/3/e20180302#BIBL This article cites 24 articles, 8 of which you can access for free at:
Subspecialty Collections
http://www.aappublications.org/cgi/collection/birth_defects_sub
Birth Defects
sub
http://www.aappublications.org/cgi/collection/fetus:newborn_infant_
Fetus/Newborn Infant
following collection(s):
This article, along with others on similar topics, appears in the
Permissions & Licensing
http://www.aappublications.org/site/misc/Permissions.xhtml in its entirety can be found online at:
Information about reproducing this article in parts (figures, tables) or
Reprints
DOI: 10.1542/peds.2018-0302 originally published online August 15, 2018;
2018;142;
Pediatrics
and Robert E. Meyer
Nelson D. Pace, Matthew E. Oster, Nina E. Forestieri, Dianne Enright, Jessica Knight
Defects
Sociodemographic Factors and Survival of Infants With Congenital Heart
http://pediatrics.aappublications.org/content/142/3/e20180302
located on the World Wide Web at:
The online version of this article, along with updated information and services, is
by the American Academy of Pediatrics. All rights reserved. Print ISSN: 1073-0397.