www.nat-hazards-earth-syst-sci.net/14/3317/2014/ doi:10.5194/nhess-14-3317-2014
© Author(s) 2014. CC Attribution 3.0 License.
The Niger Delta’s vulnerability to river floods due to sea level rise
Z. N. Musa1, I. Popescu1, and A. Mynett1,2
1UNESCO-IHE Institute for Water Education, Delft, the Netherlands
2Department of Civil Engineering, Technical University Delft, Delft, the Netherlands Correspondence to: I. Popescu (i.popescu@unesco-ihe.org)
Received: 22 July 2014 – Published in Nat. Hazards Earth Syst. Sci. Discuss.: 15 August 2014 Revised: 17 October 2014 – Accepted: 24 November 2014 – Published: 19 December 2014
Abstract. An evaluation of vulnerability to sea level rise is undertaken for the Niger Delta based on 17 physical, so-cial and human influence indicators of exposure, suscepti-bility and resilience. The assessment used geographic infor-mation systems (GIS) techniques to evaluate and analyse the indicators and the index of coastal vulnerability to floods, if sea level rise conditions are occurring. Each indicator value is based on data extracted from various sources, including remote sensing, measured historical data series and a liter-ature search. Further on, indicators are ranked on a scale from 1 to 5 representing “very low” to “very high” vulner-ability, based on their values. These ranks are used to de-termine a similar rank for the defined coastal vulnerability index (CVSLRI). Results indicate that 42.6 % of the Niger
Delta is highly vulnerable to sea level rise, such areas be-ing characterised by low slopes, low topography, high mean wave heights, and unconfined aquifers. Moreover, the anal-ysis of social and human influences on the environment in-dicate high vulnerability to sea level rise due to its ranking for type of aquifer, aquifer hydraulic conductivity, popula-tion growth, sediment supply and groundwater consumppopula-tion. Such results may help decision makers during planning to take proper adaptive measures for reducing the Niger Delta’s vulnerability, as well as increasing the resilience to potential future floods.
1 Introduction
Within the last few decades, the atmospheric and sea surface temperatures have been rising and climates worldwide are changing. With such changes, floods are occurring more of-ten and studies need to be carried out to see how to prevent floods. The classical approach is to look at river floods and
mitigation strategies, due to an increase in precipitation and consequently in the frequency of high peak floods occurring in river systems (Bhattacharya et al., 2013; Castro-Gamma et al., 2014; Fu et al., 2014; Leauthaud et al., 2013; Moya Quiroga et al., 2013).
Increases in sea surface temperatures cause thermal ex-pansion, which increases the water level of the sea sur-face (IPCC, 2013), and as a result, the shoreline moves far-ther inland. The warming of the atmosphere causes melt-ing of mountain glaciers and polar ice sheets, thus increas-ing the rise in sea levels. Based on historical data, eustatic sea level changes between 1950 and 2009 were on aver-age 1.7 mm yr−1. In recent years, satellite altimetry
measure-ments (between 1993 and 2003) have shown an increase in this rate to over 3 mm yr−1(IPCC, 2007a).
Rise in sea levels has various consequences for low-lying coastal areas, such as inundation due to coastal flooding by incoming rivers and/or the sea, erosion, displacement of coastal wetlands, and inland intrusion of sea water (IPCC, 2007b; Van et al., 2012). Over the years, scientists have used climate models to generate projections of possible sea level rise (SLR) values by the year 2100. In its reports, the Inter-governmental Panel on Climate Change (IPCC) had pro-jected a rise of 0.18–0.5 m by the year 2100 (IPCC, 2013). This projection had its limitations due to uncertainties in the response of the ice sheets and their effect on the global sea level. Other projections of a higher rise in sea level were made after the 2013 report, as data became available (Rahm-storf, 2007). These projections are of 0.26–0.97 m by the year 2100.
rise is the change in sea levels relative to the land elevation, and includes land vertical movement in addition to global sea level rise values. Relative sea level rise values are higher in subsiding coasts like river deltas than the ones in stable coastal areas. Although subsidence occurs naturally in deltas, in the case of the Niger Delta, it is increased even more by oil extraction from underground sources (Ericson et al., 2006). Oil extraction might not affect an area if there are proper surveys and regulations that take care of this issue, as well as if there is normal sediment supply coming from upstream into the delta. However, in situations where sed-iment supply from upstream is reduced or is inadequate for replenishing the area, land subsidence will occur, as has been recorded in some parts of Japan, Indonesia and Venezuela (IPCC, 2007c).
Vulnerability as a concept represents potential damage, and it is conditional upon the possibility of a hazard. Thus, a system is said to be vulnerable when it has a high susceptibil-ity to the effects of a hazard, and is unable to cope, recover or adapt (Balica et al., 2013). System vulnerability assessment to a certain hazard gives a measure of the degree of damage that might likely occur if the hazard happens without miti-gation/adaptation measures put in place. Vulnerability levels vary within a system; therefore, indicators are used to deter-mine and measure it. Such indicators can be the ecological, political, technological and socio-economic factors of a sys-tem. The value of an indicator is used to represent the char-acter of the system in a quantitative way (Cutter et al., 2008). Consequently, an assessment of vulnerability to SLR requires a method that takes into account various indicators that re-flect the effects of the SLR on the vulnerability itself. Due to the complex nature of a coastal system, such methods in-clude assumptions that simplify coastal processes in order to enable the assessments to be useful.
One method to determine the values of the indicators of vulnerability to river floods, due to SLR, is to represent data in geographic information systems (GIS), which enables comparison and deduction of the relationships between the sources of the data. Heberger et al. (2009) used GIS and hydrodynamic modelling to estimate the potential impacts of SLR on population, infrastructure, ecosystems and prop-erty, in case a major flooding event would occur on the river discharging into the sea. Data used for the assessment were DEMs, base flood elevation data, population block data, hy-drological data, tidal data, data on geology, built-up area data, etc. The results combined inundation and erosion layers with population block layers to determine the population at risk. Similarly, a GIS-based coastal vulnerability assessment was carried out by Martin et al. (2012), based on physical and human-induced vulnerability. The physical factors consid-ered were coastal systems, hydrology (sediment supply) and lithography, while the human influence factors were road net-work, population density, population growth and urban land cover. The result was combined with an urban growth model
to show the influence of anthropogenic factors on the final vulnerability of the area.
Another method for assessing vulnerability is the coastal vulnerability index (CVI), which relates various factors that influence the degree of vulnerability of coastal areas in a quantifiable manner. The CVI concept introduced by Gor-nitz et al. (1991) uses information about the coast to quan-tify the relative vulnerability of coastal segments to effects of SLR on a regional and national scale. In their study, Gor-nitz et al. (1991) assessed the vulnerability of the US coast to erosion and inundation effects of SLR by ranking sections of the coast according to their potential for change and rel-ative importance for coastal management. Since 1991, the CVI methodology has been applied globally using different variables, depending on the coastal area under study and the particular hazard being anticipated.
Pendelton et al. (2010) and Dwarakish et al. (2009) used six variables to assess the coastal vulnerability to sea level rise and coastal change for the northern Gulf of Mexico in Mexico and the Udupi coastal zone in India, respectively. These six variables are geomorphology, coastal slope, mean wave height, mean tidal range, rate of shoreline change, and relative SLR, which are considered physical variables that characterise a coastal area, and relate to the susceptibility of the shoreline to natural changes and its natural ability to adapt to changes in the environment. A similar methodol-ogy using different variables is demonstrated by Kumar and Kunte (2012) for the Chennai eastern coast in India to calcu-late the possible areas of inundation due to future SLR and land loss to coastal erosion. Yin et al. (2012) used elevation, SLR, slope, coastal geomorphology, shoreline erosion, land use, mean tidal range, and mean wave height to determine the areas of the Chinese coast that are most vulnerable to effects of SLR.
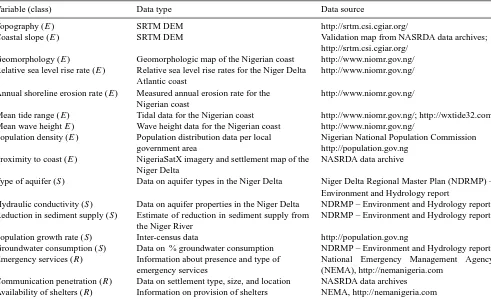
en-Table 1. List of selected variables for vulnerability assessment.
Variable (class) Data type Data source
Topography (E) SRTM DEM http://srtm.csi.cgiar.org/
Coastal slope (E) SRTM DEM Validation map from NASRDA data archives; http://srtm.csi.cgiar.org/
Geomorphology (E) Geomorphologic map of the Nigerian coast http://www.niomr.gov.ng/ Relative sea level rise rate (E) Relative sea level rise rates for the Niger Delta
Atlantic coast
http://www.niomr.gov.ng/
Annual shoreline erosion rate (E) Measured annual erosion rate for the Nigerian coast
http://www.niomr.gov.ng/
Mean tide range (E) Tidal data for the Nigerian coast http://www.niomr.gov.ng/; http://wxtide32.com Mean wave heightE) Wave height data for the Nigerian coast http://www.niomr.gov.ng/
Population density (E) Population distribution data per local government area
Nigerian National Population Commission http://population.gov.ng
Proximity to coast (E) NigeriaSatX imagery and settlement map of the Niger Delta
NASRDA data archive
Type of aquifer (S) Data on aquifer types in the Niger Delta Niger Delta Regional Master Plan (NDRMP) – Environment and Hydrology report
Hydraulic conductivity (S) Data on aquifer properties in the Niger Delta NDRMP – Environment and Hydrology report Reduction in sediment supply (S) Estimate of reduction in sediment supply from
the Niger River
NDRMP – Environment and Hydrology report
Population growth rate (S) Inter-census data http://population.gov.ng
Groundwater consumption (S) Data on % groundwater consumption NDRMP – Environment and Hydrology report Emergency services (R) Information about presence and type of
emergency services
National Emergency Management Agency (NEMA), http://nemanigeria.com
Communication penetration (R) Data on settlement type, size, and location NASRDA data archives Availability of shelters (R) Information on provision of shelters NEMA, http://nemanigeria.com
E: exposure;S: susceptibility;R: resilience;P: physical; SO: social; HI: human influence
vironment has the highest effect for inundation. The method however does not consider social variables. McLaughlin et al. (2002) include socio-economic variables in calculating a CVI for erosion in Northern Ireland. Their CVI includes vari-ables such as population, cultural heritage, roads, railways, land use and conservation status. The main outcome of their study is that socio-economic variables do not influence the scores of the CVI in a significant way. This result is due to the fact that socio-economic variables were assigned lower weights than to the physical variables. Indicator-based stud-ies such as the ones just cited use variables whose ability to change and respond to various effects of SLR (e.g. flooding) can be related to the systems’ susceptibility to the particular hazard under consideration. The results of such studies high-light the areas with characteristics that make them vulnerable to the effects of SLR, although the final proof of the vulner-ability of an area will consist of several sources of informa-tion, among which are numerical models and data obtained via field work. The study presented herein uses the advan-tage of mapping CVI results in a GIS environment in order to analyse the Niger Delta’s physical, social and human influ-ence on the environment in case that a flooding event occurs on the Niger River. The coastal vulnerability index obtained as such is a composite one, and it is called the coastal vulner-ability index due to SLR (CVSLRI). In order to determine and
analyse the CVSLRI for the Niger Delta, seventeen variables
that have relevance to coastal erosion, flooding/inundation and intrusion of sea salts (into underground water) are used (presented in Table 1) . The option to use 17 variables is based on the data availability for these indicators as docu-mented and suggested in studies by Gornitz et al. (1991) for general coastal areas, and Ozyurt and Ergin (2009) for deltas. Similarly, Balica et al. (2014) and Ozyurt and Ergin (2009) documented social and human influence variables that are important for determining the vulnerability of coastal areas. The variables are classified into exposure, susceptibility, and resilience classes based on their characteristics, following the methodology of Dinh et al. (2012).
This paper is structured in five parts. After the introduc-tion and review of vulnerability methods, the case study area is presented, followed by a short description of the applied methodology. Results are presented in Sect. 4, followed by conclusions in Sect. 5.
2 Case study description
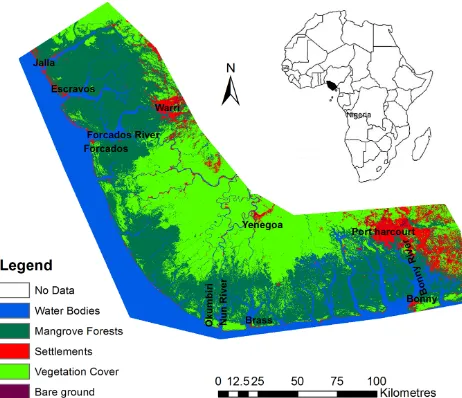
Figure 1. The Niger Delta land cover map.
estuaries as well as a stagnant mangrove swamp. The region has an area of approximately 20 000 km2, a 450 km coastline, and is home to about 13 million people.
Nigeria’s economy depends on oil and gas extraction from the Niger Delta as the main source of foreign exchange; therefore, many multinational oil and gas companies oper-ate in the region, and over 500 oil wells are locoper-ated on-shore. The extraction of oil and gas has increased land subsi-dence in the delta, with values estimated to range from 25 to 125 mm yr−1 (Syvitski, 2008). Land subsidence lowers the
topography of delta areas with respect to the sea and makes the relative sea level rise high. For coastal areas, the relative sea level rise value is much more important than the eustatic sea level rise. In addition to the global average eustatic SLR of 3 mm yr−1, the relative sea level rise in the Niger Delta includes subsidence levels of 25–125 mm yr−1, which makes it highly vulnerable to river floods due to the effects of sea level rise (SLR).
Other environmental problems in the Niger Delta that can be further exacerbated by SLR include construction of dams in the upstream and erosion of the coast. The Niger River has a number of dams constructed upstream of the Niger Delta, with a total combined capacity of 30 billion m3. The con-struction of dams reduced the estimated percentage sediment to the Niger Delta by 70 % (NDRMP, 2004). Since deltas are replenished by upstream sediment supply, this condition makes the Niger Delta vulnerable to coastal erosion and land loss (IPCC, 2007c).
Erosion is already ravaging the Niger Delta, due mainly to natural causes (like river flow and ocean surge) and construc-tion of bridges, canals and other coastal structures, which al-tered the natural course of the rivers (NDRMP, 2004).
Based on population figures of 1995, Awosika et al. (1992) estimated that 600 000 villagers in the Niger Delta would
need to be displaced in case of a 1 m sea level rise. How-ever, this estimate may be surpassed, as the population of the Niger Delta increased with a growth rate of over 3.1 % be-tween 1991 and 2006 (NPC, 2010).
3 Vulnerability assessment methodology
Gornitz (1991) defined CVI on n number of physically ranked variables (x1, ..., xn) as
CVI=
r
x1·x2, . . ., xn
n . (1)
In Eq. (1),n represents the number of ranked variables. According to the CVI method, local variable values are measured and/or analysed and compared with documented ranges of values for that variable. The comparison allows a ranking of physical variables that shows the level of vulnera-bility.
Variables can be categorised into classes of exposure, sus-ceptibility and resilience. Dinh et al. (2012) defined a coastal vulnerability index based on exposure, susceptibility and re-silience factors as
CVI=E·S
R , (2)
whereEare exposure factors,Ssusceptibility factors andR resilience factors.
The exposure variables are those inherent qualities of the system that position it for a likely hazard impact; they de-scribe what is exposed to the threat (Cutter et al., 2008). Susceptibility variables are the characteristics of the exposed system that influence the level of harm from hazards (Birk-mann, 2007). The resilience of a system implies the ability to adapt and even utilise the disaster as an opportunity for the future; thus, resilience variables enable a system to cope with and reduce the possible impact of the disaster on the exposed population.
While Eq. (1) enables the simplified combination of vari-able rankings to calculate the CVI for exposure, suscepti-bility and resilience, Eq. (2) enables the combination of the three indices to allow a ranking of vulnerability that acknowl-edges the importance of system resilience. Exposure and sus-ceptibility variables increase the vulnerability of systems, while resilience variables enable systems to withstand and reduce the vulnerability to hazards. Therefore, the methodol-ogy used in the present research combines the two methods into a composite index which multiplies the exposure index by the susceptibility index and divides the product by the re-silience index. Because CVI can refer to different regions and causes, further on, the index of vulnerability to river floods in coastal areas due to SLR is referred to as the coastal vulner-ability to SLR index (CVSLRI). The proposed methodology,
1. choose variables that are relevant to the coastal pro-cesses in the study region;
2. classify variables in exposure, susceptibility and re-silience;
3. define coastal segments and determine for each of them the values of the variables chosen in the first step; 4. use Eq. (1) to calculate the CVI for exposure,
suscep-tibility and resilience elements (e.g. CVEI, CVSI, and
CVRI respectively);
5. use Eq. (2) to compute the CVSLRI for each defined
coastal segment, i.e.
CVSLRI=
CVEI·CVSI
CVRI
; (3)
6. compare the CVSLRI with results obtained for CVI
based on physical variables only; and
7. indicate (through the CVSLRI) the coastal segments that
are most in need of intervention in response to socio-economic conditions.
The developed methodology is herein exemplified in the case of the Niger Delta; however, its applicability is valid for any coastal area.
Rankings and ranges of variables are not the same across different systems, depending on the measured values. Three to five classes of ranking are found in the literature. Kumar and Kunte (2012) use three classes (i.e. low, medium, high), Yin et al. (2012) use four (low, medium, high, very high), while Dinh et al. (2012), Pendelton et al. (2010), Ozyurt and Ergin (2009), Thieler and Hammer-Kloss (1999) and Gor-nitz (1991) rank the measured ranges into five classes from very low to very high. The later approach is used in the present study of the Niger Delta, considering that such a re-fined classification will reduce considerably the uncertainty in computation of vulnerability. Tables 2, 3 and 4 show the ranges of values of exposure, susceptibility and resilience variables respectively, as considered in the present research, as well as their ranking from 1 (very low) to 5 (very high).
The applied methodology divides the coast into segments. For each segment, a CVSLRI is calculated; however, these
values present a wide range between a minimum (min) and a maximum (max) value. Therefore, results are normalised between 0 and 1 using the relation
NV=value−min
max−min, (4)
where NV is the normalised value of the variable; “value” is the calculated index value for a coastal segment; “max” is the maximum value in that index; and “min” is the minimum value in that index.
The selected indicators used for determining the CVSLRI
are detailed further.
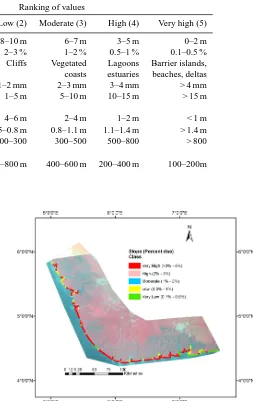
Figure 2. Niger Delta topography classification.
3.1 Selected indicators for exposure
The exposure indicators are selected based on their influ-ence on coastal flooding, inundation, sea water intrusion to groundwater sources and coastal erosion. All the chosen vari-ables are physical properties of the coast, except “proximity to coast”, which is a human-related variable.
3.1.1 Topography
The topography (elevation) of an area above the mean sea level influences how much of it will be impacted by rising sea levels, because low-lying areas offer less resistance to in-undation in times of flooding and storm surges (Van et al., 2012). The elevation of the Niger Delta is extracted from SRTM DEM data using ERDAS Imagine 9.1 topographic analysis tools. The coastline has an average elevation be-tween 0 and 10 m above sea level, which is ranked as defined in Table 2. The coastline topography mapping, based on the defined ranking in Table 2, is shown in Fig. 2. It can be no-ticed that the eastern end (from Bonny) has a “medium to high” topography (3–7 m a.s.l), which makes the delta sus-ceptible to flooding due to river flow and to storm surges coming from the sea.
3.1.2 Coastal slope
Table 2. Data range and ranking of the exposure CVSLRI variables.
Ranking of values
Variables Class Very low (1) Low (2) Moderate (3) High (4) Very high (5) 1 Topography P > 10 m 8–10 m 6–7 m 3–5 m 0–2 m 2 Coastal slope P > 3–4 % 2–3 % 1–2 % 0.5–1 % 0.1–0.5 % 3 Geo-morphology P Rocks Cliffs Vegetated Lagoons Barrier islands, coasts estuaries beaches, deltas 4 Relative SLR rate P 0–1 mm 1–2 mm 2–3 mm 3–4 mm > 4 mm 5 Annual shoreline P 0–1 m 1–5 m 5–10 m 10–15 m > 15 m
erosion rate
6 Mean tidal range P > 6 m 4–6 m 2–4 m 1–2 m < 1 m 7 Mean wave height P 0.3–0.5 m 0.5–0.8 m 0.8–1.1 m 1.1–1.4 m > 1.4 m 8 Population density SO < 100 100–300 300–500 500–800 > 800
(people per km2)
9 Proximity to coast HI > 800 m 600–800 m 400–600 m 200–400 m 100–200m
P: physical; SO: social; HI: human influence.
coastline slope ranges from 0 to 2.5 %. Figure 3 shows the classification of the slope and the fact that the eastern end (from Bonny) has a slope of 0.1–1 %, which gives it a “high” to “very high” vulnerability ranking, making it highly sus-ceptible to inundation.
3.1.3 Geomorphology
Geomorphology describes landforms and processes that lead to the formation of landform patterns. The type of landform found on the coast determines its degree of vulnerability to erosion and its level of resistance to wave forces. Vulnerabil-ity ranking based on geomorphology is done such that cliffs and rocky areas have low vulnerability; lagoons and estuaries have high vulnerability, while beaches, deltas, and barrier is-lands have very high vulnerability (Pendelton et al., 2010). The Niger Delta geomorphologic zone is characterised by deltaic, sandy beach, and estuarine landforms. These charac-teristics (see Table 2) give it a “high” to “very high” ranking and make it very susceptible to erosion and wave action. 3.1.4 Relative sea level rise
Relative sea level/annum at local level is a measure of the height of the sea above a certain datum averaged over a year and measured using tide gauges (Yin et al., 2012). The higher the sea level rise rate, the more vulnerable an area is compared with those with lower rates of rise in sea lev-els. Satellite altimetry measurements (1993–2010) over the Niger Delta coast show eustatic sea level rise rates of 3.03– 3.39 mm yr−1 (Rosmorduc, 2012). In addition, the Niger Delta is subsiding at a rate of 25–125 mm yr−1, which clas-sifies it as a “very high” relative SLR (see Table 2).
Figure 3. Niger Delta coastal slope classification.
3.1.5 Annual shoreline erosion rate
3.1.6 Mean tidal range
The tidal range gives the difference between high and low tides, and is linked to permanent and episodic hazards from sea level rise and storm surge (Yin et al., 2012). In view of coastal vulnerability, areas with large tidal ranges have a higher vulnerability than those with lower ranges. Mean tidal range is in general determined based on long-term tidal data. In case such data are not available, hydrodynamic models are used to predict tidal levels based on tidal stations located within the areas of interest (Kumar and Kunte, 2012). Values of the tidal range for the Nigerian coast are generated using the wXTide32 tidal model, which predicts tides based on the algorithm developed by the US National Oceanic Service. Niger Delta measurements from eight tidal stations, along the delta coast, are used in the model. The results show a gradual increase from 1.74 m in the west, around Forcados River, to 2.57 m in the east at Bonny River. The range (1.74–2.57 m) has a “moderate” to “high” ranking (see Table 2); therefore, the Niger Delta is susceptible to storm surge and sea level rise.
3.1.7 Mean wave height
Waves move coastal sediments from one place to another. The linear wave theory gives the wave energy as
E= 1
16ρgH
2, (5)
whereE=energy andH=wave height.
According to Eq. (5), wave energy is directly proportional to the square of wave height; therefore, the wave height can be used as a proxy for wave energy (Yin et al., 2012). Ar-eas with high waves are more vulnerable than arAr-eas with low wave heights, as they have more energy to move materials offshore. Values obtained from NIOMR (2010) give wave heights of 1.5 m for the western to middle Niger Delta (from Jalla to areas around Okumbiri), and 0.5–1.5 m for the east-ern end. These values have a “high” to “very high” ranking (see Table 2) and make the coast susceptible to flooding, ero-sion, storm surge and inundation.
3.1.8 Population density
Areas with a high population density have a higher vulnera-bility than those with a lower population density (McLaugh-lin et al., 2002). The presence of human settlement increases the values of risk, the likelihood of erosion and modification of the coastal area. The Niger Delta population distribution data, as given by the local Government area, show that many settlements in the eastern end (from Bonny) have more than 500 people per km2; hence, there is a “high” to “very high” vulnerability risk to SLR (see Table 2).
3.1.9 Proximity to coast
The proximity of a settlement, infrastructure or land to the coast determines the level of its exposure to the effects of sea level rise such as storm surges, floods, erosion and wave ac-tion. The present study considered distances from the shore using the 2012 NigeriaSatX satellite imagery. Locations of settlements within 0–1500 m of the coastline were deter-mined and ranked. Table 2 shows that the shorter the dis-tance from the coastline, the more vulnerable the settlement is to the effects of SLR.
3.2 Selected indicators of susceptibility and resilience Based on the available data and the influence of social and human factors on the extent of damage that could occur at the occurrence of SLR, eight indicators of susceptibility and resilience are selected in the present study. The resilience in-dicators are the social variables that increase the ability of victims to cope with floods, inundation, loss of land from erosion, and intrusion of sea salts.
Like the exposure variables, the documented range of val-ues/characteristics of the susceptibility and resilience vari-ables are ranked from “very low” to “very high” vulnerabil-ity, as detailed in Tables 3 and 4, respectively. The indicators are explained in detail below.
3.2.1 Type of aquifer
The type of aquifer in a given area determines how vul-nerable the groundwater is to salt water intrusion. Confined aquifers are overlain by materials with poor permeability and are therefore less vulnerable to contamination than semi-confined and unsemi-confined aquifers, which allow interaction with the surface. Data from the NDRMP (2004) were used to rank the Niger Delta coastal aquifers, and the results show that the coastal aquifers are unconfined. Table 3 shows that unconfined aquifers have a “very high” vulnerability; there-fore, the Niger Delta is vulnerable to salt water intrusion from SLR.
3.2.2 Aquifer hydraulic conductivity
Table 3. Data range and ranking of the susceptibility CVSLRI variables.
Ranking of values
Variables Class Very low (1) Low (2) Moderate (3) High (4) Very high (5)
10 Type of aquifer P Confined Leaky confined Unconfined
11 Aquifer hydraulic conductivity P 0–12 m day−1 12–28 m day−1 28–41 m day−1 41–81 m day−1 > 81 m day−1
12 Reduction in sediment supply HI 30 % 40 % 50 % 60 % 70 %
13 Population growth rate SO 0 % <1 % 1–2 % 2–3 % > 3 %
14 Groundwater consumption SO, HI < 20 % 20–30 % 30–40 % 40–50 % > 50 %
P: physical; SO: social; HI: human influence.
Table 4. Data range and ranking of the resilience CVSLRI variables.
Ranking of values
Variables Class Very low (1) Low (2) Moderate (3) High (4) Very high (5)
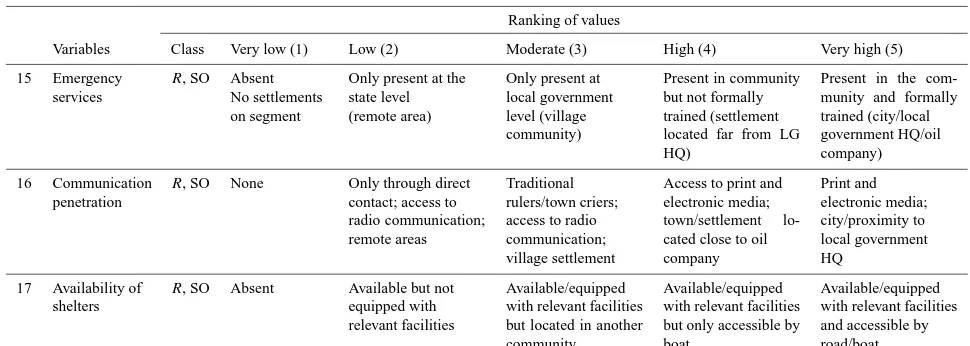
15 Emergency services
R, SO Absent No settlements on segment
Only present at the state level (remote area)
Only present at local government level (village community)
Present in community but not formally trained (settlement located far from LG HQ)
Present in the com-munity and formally trained (city/local government HQ/oil company) 16 Communication
penetration
R, SO None Only through direct contact; access to radio communication; remote areas
Traditional rulers/town criers; access to radio communication; village settlement
Access to print and electronic media; town/settlement lo-cated close to oil company
Print and electronic media; city/proximity to local government HQ
17 Availability of shelters
R, SO Absent Available but not equipped with relevant facilities
Available/equipped with relevant facilities but located in another community
Available/equipped with relevant facilities but only accessible by boat
Available/equipped with relevant facilities and accessible by road/boat P: physical; SO: social; HI: human influence
3.2.3 Reduction in sediment
Building of dams and other control infrastructure in the up-stream of coasts impedes the flow of sediments and reduces the natural nourishment of delta areas (IPCC, 2007b). Ar-eas where the percentage of sediment reaching the coasts is sustained over a long period of time have less vulnerability compared to areas where only a percentage of the normal sediments reaches them (Ozyurt and Ergin, 2010). The sedi-ment supply to the Niger Delta is 70 % less than in the past, due to construction of dams in the upstream (NDRMP, 2004). The value (i.e. 70 %) for reduction in sediment supply gives a “very high” vulnerability (Table 3), which makes the Niger Delta susceptible to erosion from SLR.
3.2.4 Population growth rate
Population growth affects the environment in various ways, with highly populated areas facing greater environmental challenges (UNFPA, 2009). A high population growth rate will increase the number of people likely to be affected by the effects of SLR; therefore, areas with lower growth rates will have less vulnerability compared with those with higher growth rates. Inter-census data of the Niger Delta (1991–
2006) show a growth rate of 2.9–3.1 %, which gives a “high” to “very high” vulnerability (Table 3).
3.2.5 Groundwater consumption
Inland intrusion of sea salts is likely to pollute under-ground aquifers and cause a shortage of drinking water in coastal areas. Areas that depend on groundwater as the main source of drinking water are more vulnerable than those with a low dependence on groundwater. Data on groundwater consumption in the Niger Delta, as com-piled by NDRMP (2004), show the percentage of house-holds/settlements that depend on groundwater sources (bore-holes and wells) for drinking and domestic use. Some areas have over 40 % dependence on groundwater, giving them a high ranking. People living in such areas are vulnerable to salt water intrusion due to SLR.
3.2.6 Emergency services
disas-ters. Communities with trained and equipped emergency ser-vices are more resilient to the impacts of SLR compared to those without. In Nigeria, emergency services at local level are coordinated by the Local Emergency Management Agency (LEMA) which establishes trained local community structures made up of local associations, religious bodies, clubs, schools, etc. (NEMA, 2010a). Due to the presence of LEMA in every local government area in Nigeria, the present study assumes that local community structures exist in all the Niger Delta communities. However, the Niger Delta coast has small and isolated fishing communities which are less likely to have schools. The resilience ranking for such iso-lated communities is “very low” (see Table 4).
3.2.7 Communication penetration
The channel of communication determines the number of people whom information reaches as well as the quality of the information provided. In Nigeria, NEMA through its disaster prevention strategy provides information about im-pending disasters to vulnerable communities via print and electronic media as well as informal channels like tra-ditional rulers, religious leaders, etc. (NEMA, 2010a). NEMA (LEMA) staff who disseminate this information are found in the local government headquarters. Many settle-ments in the Niger Delta are located far away from the local government headquarters and might not be easily reached. People living in such remote areas have less access to quality communication and are therefore less resilient to the effects of SLR, as compared with those living in cities (Table 4).
3.2.8 Availability of shelters
During a disaster, people are evacuated to shelters adminis-tered by trained personnel. Access to shelters determines the number of people that can be rescued in good time and, later on, helps restore the affected community (NEMA, 2010b). Areas with buildings located on safe sites that can be used as shelters are more resilient to the impacts of SLR than those without. In Nigeria, buildings located on unaffected sites are used as shelters during flooding (e.g. schools), but where none is available, emergency shelters are erected. The eleva-tion of the Niger Delta is generally low, as shown in Fig. 3; therefore, in the event of flooding, evacuation camps have to be erected. This gives the Niger Delta a “very low” resilience ranking (Table 4).
4 Results and discussion
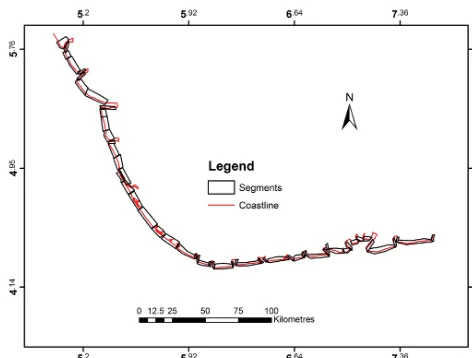
In order to calculate the CVSLRI for the 450 km of the Niger
Delta coast, 54 coastal segments are considered (Fig. 4). The segment division is based primarily on three main elements: elevation (Fig. 2); change in slope (Fig. 3); and the presence of large estuaries. Elevation and slope are important factors
Figure 4. The 54 Niger Delta coastal segments assessed for
vulner-ability to SLR.
for flooding, since elevation determines the lowest level of water that could flood an area, and slope affects the flood-ing extent over an area. Therefore, each of the 54 segments shown in Fig. 4 defines an area with the slope and/or topogra-phy characteristics that make it different from the neighbour-ing segments. Sizes of the segments differ from one another in length; however, on average, the segment width is 4 km inland.
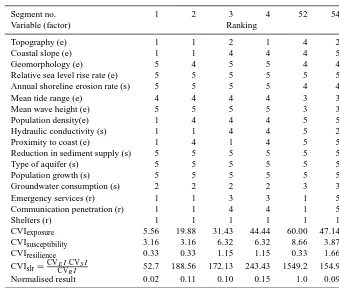
For each coastal segment, the exposure, susceptibility and resilience indicators are calculated and ranked. The range of results for the Niger Delta coastal segments are nor-malised using Eq. (4) and classified into five vulnerability classes (very low, low, moderate, high and very high) based on percentile ranges. Accordingly, the calculated results give the following ranges of vulnerability: 0.0–0.02 (“very low”), 0.02–0.03 (“low”), 0.03–0.07 (“medium”), 0.07–0.11 (“high”), and 0.11–1.0 (“very high”). As an example of the indicator ranking for the Niger Delta coast, segments 1–4, 52 and 54 are presented in Table 5. The most vulnerable segment (number 52) has a low slope (< 1 %), low topog-raphy (3–5 m), estuaries, very high hydraulic conductivity (> 81 m day−1), very high population density (> 800 people per km2), and settlements within 100–200 m of the coast. These attributes have thus made it highly vulnerable to SLR. On the other hand, the least vulnerable segment, number 1, has a high slope (> 4 %), a topography higher than 10 m, is uninhabited with no coastal infrastructure, and has a very low hydraulic conductivity (0–12 m day−1). These attributes give it a very low vulnerability to SLR. (Segment count is from left to right.)
Figure 5 shows a plot of the calculated CVSLRI for the
Table 5. Ranking per indicator and CVI results for six segments.
Segment no. 1 2 3 4 52 54
Variable (factor) Ranking
Topography (e) 1 1 2 1 4 2
Coastal slope (e) 1 1 4 4 4 5
Geomorphology (e) 5 4 5 5 4 4
Relative sea level rise rate (e) 5 5 5 5 5 5 Annual shoreline erosion rate (s) 5 5 5 5 4 4 Mean tide range (e) 4 4 4 4 3 3 Mean wave height (e) 5 5 5 5 3 3 Population density(e) 1 4 4 4 5 5 Hydraulic conductivity (s) 1 1 4 4 5 2 Proximity to coast (e) 1 4 1 4 5 5 Reduction in sediment supply (s) 5 5 5 5 5 5 Type of aquifer (s) 5 5 5 5 5 5 Population growth (s) 5 5 5 5 5 5 Groundwater consumption (s) 2 2 2 2 3 3 Emergency services (r) 1 1 3 3 1 5 Communication penetration (r) 1 1 4 4 1 5
Shelters (r) 1 1 1 1 1 1
CVIexposure 5.56 19.88 31.43 44.44 60.00 47.14
CVIsusceptibility 3.16 3.16 6.32 6.32 8.66 3.87
CVIresilience 0.33 0.33 1.15 1.15 0.33 1.66
CVIslr= CVCVEI·RCVISI 52.7 188.56 172.13 243.43 1549.2 154.9
Normalised result 0.02 0.11 0.10 0.15 1.0 0.09
Figure 5. SLR CVI values.
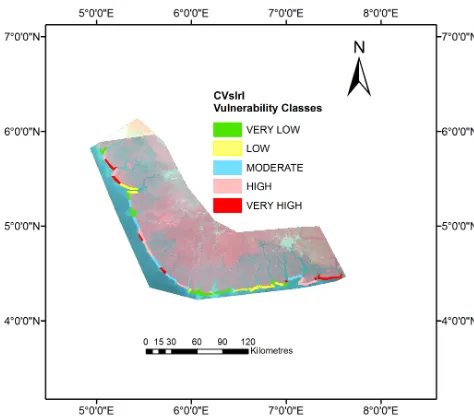
has “high” to “very high” vulnerability, which is shown in Fig. 6.
In Fig. 6, the eastern end of the Niger Delta from Bonny to the southern end of Opobo (made up of six coastal seg-ments: 49–54) is the longest stretch, with very high vulnera-bility to SLR. As shown in the case of segment 52, such areas with “high” to “very high” vulnerability are characterised by “very low” to “low” slopes, “very low” to “low” topogra-phy, “high” to “very high” mean wave heights, unconfined aquifers, the presence of a coastal infrastructure, a “high” population density, etc. These variables represent physical
coastal properties, human influence, and social properties. The presence of human influence variables, such as coastal infrastructure and high population density, increase the prob-ability of damage to lives and property when a disaster occurs. The combination of these properties has made the coastal segments highly vulnerable to SLR. The coastal seg-ments classified as highly vulnerable to SLR will require mit-igation measures to be applied against SLR.
The advantages of using a method such as the CVSLRI
in-clude the facts that it takes into account existing social struc-tures (in terms of favourable places to live/invest in infras-tructure) and shows the level of vulnerability of choice areas. For example, the rankings of segments 1 and 2 for physical variables 1–7 (Table 2) are similar; however, their vulner-abilities are very different (Table 5), since, in the CVSLRI
method, human influence variables differentiate between the vulnerabilities of the two segments. While segment 1 has a “very low” vulnerability, segment 2 has a “high” vulnera-bility due to its high population density and the presence of many settlements along the coast. If the CVI calculation was based on physical factors only, both segments will have a similar vulnerability, and segment 2 will be given a “very low” vulnerability ranking; consequently, it will not be in-cluded in any adaptation plan. Thus, CVSLRI results
Figure 6. Niger Delta coast vulnerability levels.
is that it includes, in the vulnerability assessment, the human modifications of the coastal environment. Human influences (e.g. construction of sea walls, groins, ports) add to the over-all cost of impacts of coastal hazards; therefore, there is the need to capture them in a vulnerability assessment. More-over, CVSLRI ranking of vulnerability acknowledges the
im-portance of system resilience in reducing the potential effects of SLR. The CVSLRI, however, requires a wide range of data
collection for the physical, social, and human influence fac-tors, which might not be readily available. Different variables might be available in countries within the same region, mak-ing comparison difficult.
5 Conclusion
Highly vulnerable coastlines expose the inland areas to ef-fects of SLR, serving as a gateway for inundation, storm surge and coastal erosion. The results of the CVSLRI for the
Niger Delta show that 42.6 % of the coast is highly vulner-able to effects of SLR like flooding, erosion, and salt water intrusion into underground aquifers. These areas of the coast need to be protected against the negative effects of SLR.
Human influence on coastal environments can affect sedi-ment supply and accelerate erosion, and should therefore be captured in vulnerability assessments. Analysis of social and human influence variables shows that in terms of type of aquifer, aquifer hydraulic conductivity, population growth, sediment supply, and groundwater consumption, the Niger Delta is vulnerable to the effects of SLR. Moreover, the lo-cation of many settlements in remote areas, far away from the local government headquarters, reduces the value of re-silience to the effects of SLR.
Studies such as the one presented herein serve as an in-put for taking mitigation measures and helping decision makers to assess the effects of their measures on the func-tion of the river system under considerafunc-tion (Jonoski and Popescu, 2012; Popescu et al., 2010, 2014). The results of this study can provide a complementary source of data for the decision makers in planning mitigation/adaptation strate-gies for the Niger Delta. For example, the map (Fig. 6) can be used alongside other data to identify those areas that are most likely to be affected by flooding from the Niger River before a flood occurs. With the Niger River flooding frequently in recent times, mitigation/adaptation strategies can be planned for vulnerable areas, and not for the entire geographical region all at once. Also, the evaluation of re-silience for the coastal segments which shows the ability of the system (people) to cope and adapt to the disaster can aid in mitigation/adaptation planning. Under resilience, we eval-uated three variables, emergency services, communication penetration, and availability of shelters, which are services directly provided by the decision maker. The evaluation re-sults can be useful in channelling more services to areas most in need.
Global studies undertaken by Ericson et al. (2006) and Nicolls and Mimura (1998) rank the entire Niger Delta as having moderate vulnerability. Such a ranking has been used in the literature as the “condition” for the Niger Delta, even though it was only based on the population likely to be displaced. The evaluation presented herein shows that parts of the Niger Delta are highly vulnerable to SLR. The results can be used to identify focus areas that need mod-elling of flooding to aid mitigation and adaptation planning. Hence, a combination of this study’s results with physical models of flooding in the Niger Delta will provide a much better picture of the effects of sea level rise for the decision makers.
The segment division used in the study has constrained the scale of CVI calculations and reduced the possibility of gen-eralising variable values along the Niger Delta coastline. For example, in the case of the “population density” variable, since the segments divide the coastline into smaller areas, we were able to use data provided per local government area to classify vulnerability instead of data per state (which is a much larger scale). The present study is however lim-ited to onshore areas, and does not include the vulnerability of offshore areas or mitigation/adaption to SLR options. The mapping of vulnerability as presented in the study is within the limited bounds of the data accuracy and the scale of the study. Even though the local data used are acquired from offi-cial sources (see Table 1), there might still be uncertainties in the data collection and methods of processing that can not be accounted for because, officially, the data are accepted as re-liable by the authorities in charge of managing the delta.
of the entire West African coast, where several rivers have to be taken into account in measuring the variable “reduction in sediment supply” or the variable “population growth rate”, which are difficult to be included, because several countries in the region have different data and measurement techniques for population growth.
Such a study however would complement the overview of decision makers of the vulnerability in the area, and will al-low them to take adaptation measures that would address in a coherent manner both the Niger Delta as well as the Nigerian coastline.
Acknowledgements. Edited by: P. Tarolli
Reviewed by: three anonymous referees
References
Aich, V., Liersch, S., Vetter, T., Huang, S., Tecklenburg, J., Hoff-mann, P., Koch, H., Fournet, S., Krysanova, V., Müller, E. N., and Hattermann, F. F.: Comparing impacts of climate change on streamflow in four large African river basins, Hydrol. Earth Syst. Sci., 18, 1305–1321, doi:10.5194/hess-18-1305-2014, 2014. Awosika, L., French, G., Nicolls, R., and Ibe, C.: The impact of
sea level rise on the coastline of Nigeria, IPCC Symposium on Global climate change and the Rising Challenges of the Sea, pp. 690, Margarita, Venezuela: National Oceanic and Atmospheric Administration, 1992.
Balica, S. F., Popescu, I., Beevers, L., and Wright, N. G.: Parametric and physically based modelling techniques for flood risk and vul-nerability assessment: a comparison; J. Environ. Model. Softw., 41, 81–92, 2013.
Balica, S., Dinh, Q., Popescu, I., Vo, T. Q., and Pham, D. Q.: Flood impact in the Mekong Delta, Vietnam, J. Maps, 10, 257–268, 2014.
Bhattacharya, B., Shams, M. S., and Popescu, I.: On the influence of bed forms on flood levels, Environ. Eng. Manage. J., 12, 857– 863, 2013.
Birkmann, J.: Risk and vulnerability indicators at different scales, Applicability, usefulness and policy implications, Environ. Haz-ards, 7, 20–31, 2007.
Castro-Gama, M. E., Popescu, I., Li, S., Mynett, A., and van Dam, A.: Flood inference simulation using surrogate modelling for the Yellow River multiple reservoir system, Environ. Model. Softw., 55, 250–265, 2014.
Cutter, S. L., Barnes, L., Berry, M., Burton, C., Evans, E., Tate, E., and Webb, J.: A place-based model for understanding commu-nity resilience to natural disasters, Glob. Environ. Change, 18, 598–606, 2008.
Dinh, Q., Balica, S., Popescu, I., and Jonoski, A.: Climate change impact on flood hazard, vulnerability and risk of the Long Xuyen Quadrangle in the Mekong Delta, Int. J. River Basin Manage., 10, 103–120, 2012.
Dwarakish, G. S., Vinay, S. A., Natesan, U., Asano, T., Kakinuma, T., Venkataramana, K., and Babita, M. K.: Coastal vulnerability assessment of the future sea level rise in Udupi coastal zone of Karnataka state, west coast of India, Ocean Coast. Manage., 52, 467–478, 2009.
Ericson, J., Vorosmarty, C., Dingman, S., Ward, L., and Meybeck, M.: Effective sea level rise and deltas: causes of change and hu-man dimension implications, J. Planet. Change, 50, 63–82, 2006. Fu, C., Popescu, I., Wang, C., Mynett, A. E., and Zhang, F.: Challenges in modelling river flow and ice regime on the Ningxia–Inner Mongolia reach of the Yellow River, China, Hy-drol. Earth Syst. Sci., 18, 1225–1237, doi:10.5194/hess-18-1225-2014, 2014.
Gornitz, V., White, T., and Cushman, R.: Vulnerability of the US to future sea-level rise, Proceedings of 7-th Symposium on Coastal and Ocean Management, Long Beach, CA, USA, 8–12 July 1991, 2354–2368, 1991.
Gornitz, V.: Global coastal hazards from future sea level rise, Palaeogeogr. Palaeoclim., 89, 379–398, 1991.
Heberger, M., Cooley, H., Herrera, P., Gleick, P. H., and Moore, E.: The Impacts of Sea level rise on the Califonia Coast, California Climate Change Center, Sacramento, USA, 155 pp., 2009. IPCC: Natural System responses to climate Change Drivers,
Working group 11: Impacts, Adaptation and Vulnerabil-ity. Inter Governmental panel on Climate Change, avail-able at: http://www.ipcc.ch/publications_and_data/ar4/wg1/en/ ch5s5-5-2-2.html (last access: February 2014), 2007a.
IPCC: Working Group II: Impacts, Adaptation and Vulnerabil-ity, available at: http://www.ipcc.ch/publications_and_data/ar4/ wg2/en/ch6s6-3-2.html#table-6-2 (last access: February 2014), 2007b.
IPCC: Coastal systems and low lying areas: Deltas and mega-deltas hot spots for vulnerability, Inter-Governmental panel on Climate Change, available at: http://www.ipcc.ch/pdf/assessment-report/ ar4/wg2/ar4-wg2-chapter6.pdf (last access: February 2014), 2007c.
IPCC: Working Group I Contribution to the Ipcc fifth As-sessment Report (Ar5), Climate Change 2013: The Physical Science Basis, IPCC: Stockholm, available at: http://www.climatechange2013.org/images/uploads/WGIAR5_ WGI-12Doc2b_FinalDraft_Chapter13.pdf (last access: February 2014), 2013.
Jonoski, A. and Popescu, I.: Distance Learning in Support of Water Resources Management: An Online Course on Decision Support Systems in River Basin Management, Water Res. Manage., 26, 1287–1305, 2012.
Kumar, T. and Kunte, P.: Coastal Vulnerability Assessment for Chennai, East coast of India using Geospatial Techniques, J. Nat-ural Hazards, 64, 853–872, 2012.
Leauthaud, C., Belaud, G., Duvail, S., Moussa, R., Grünberger, O., and Albergel, J.: Characterizing floods in the poorly gauged wet-lands of the Tana River Delta, Kenya, using a water balance model and satellite data, Hydrol. Earth Syst. Sci., 17, 3059–3075, doi:10.5194/hess-17-3059-2013, 2013.
Martin, V. N., Pires, R., and Cabral, P.: Modelling of coastal vulner-ability in the stretch between the beaches of Porto de Mós and Falésia, Algarve (Portugal), J. Coastal Conserv., 16, 503–510, 2012.
McLaughlin, S., McKenna, J., and Cooper, J.: Socio-economic Data in Coastal Vulnerability Indices: Constraints and Opportunities, J. Coastal Res., Special Issue 36, 487–489, 2002.
McLaughlin, S. and Cooper, J. A.: A multi-scale coastal vulnera-bility index: A tool for coastal managers?, Environ. Hazards, 9, 233–248, 2010.
NDRMP: Niger Delta Regional Master Plan: Environment and Hydrology, NDDC, available at: http://www.nddc.gov.ng/ masterplan.html (last access: September 2014), 2004.
NEMA: National Disaster Management Framework: Thematic Area 1, available at: http://nemanigeria.com/downloads/ documentations/NationalDisasterManagementFramework.pdf (last access: February 2014), 2010a.
Nicolls, R. and Mimura, N.: Regional issues raised by sea-level rise and their policy implications, J. Clim. Change, 11, 5–18, 1998. NIOMR: Marine Geology/Geophysics, available at: http://www.
niomr.gov.ng (last acess: February 2014), 2010.
National Population Commission, Nigeria (NPC): CENSUS, Population distribution by state, sex, LGA and senato-rial district: 2006 priority tables (Vol. 3), available at: http://www.population.gov.ng/index.php/publications/ (last ac-cess: February 2014), 2010.
Ozyurt, G. and Ergin, A.: Application of sea level rise Vulnerabil-ity Assessment Model to Selected Coastal Areas of Turkey, J. Coastal Res., 56, 248–251, 2009.
Ozyurt, G. and Ergin, A.: Improving Coastal Vulnerability Assess-ments to Sea-Level Rise: A New Indicator Based Methodology for Decision Makers, J. Coastal Res., 56, 248–251, 2010. Pendelton, E., Barras, J., Williams, S., and Twitchell, D.: Coastal
Vulnerability Assessment of the Northern Gulf of Mexico to Sea-Level Rise and Coastal Change, US Geological Survey, available at: http://pubs.usgs.gov/of/2010/1146 (last access: March 2014), 2010.
Popescu, I., Jonoski, A., van Andel, S. J., Onyari, E., and Quiroga, V. G. M.: Integrated modelling for flood risk mitigation in Roma-nia: Case study of the Timis-Bega river basin, Int. J. River Basin Manage., 8, 269–280, 2010.
Popescu, I., Cioaca, E., Pan, Q., Jonoski, A., and Hanganu, J.: Use of hydrodynamic models for the management of the Danube Delta wetlands: The case study of Sontea-Fortuna ecosystem, Environ. Sci. Policy, doi:10.1016/j.envsci.2014.01.012, in press, 2014.
Rahmstorf, S.: A Semi-Empirical Approach to Projecting Future Sea-Level Rise, Science, 315, 368–370, 2007.
Rosmorduc, V.: Information Services in support of West Africa Coastal vulnerability, Service 2: Sea Level Height and currents, Washington DC: World Bank, available at: http://siteresources.worldbank.org/EXTEOFD/Resources/ 8426770-1335964503411/SUR-C-West_Africa_Coastal_ vulnerability_Service2.pdf (last access: March 2014), 2012. Syvitski, J.: Deltas at risk, Sustainable Science, 2, 23–32, 2008. Thieler, E. R. and Hammer-Kloss, E.: National Assessment of
Coastal Vulnerability to Sea-Level Rise: Preliminary Results for the U.S. Gulf of Mexico Coast, U.S. Geological Survey Open-File Report 00-179, available at: http://pubs.usgs.gov/of/2000/ of00-179/ (last access: February 2014), 1999.
UNFPA: Population and Climate Change Framework of UNFPA’s Agenda, http://www.unfpa.org/publications/ state-world-population-2009 (last access: March 2014), 2009.
Van, P. D. T., Popescu, I., van Griensven, A., Solomatine, D. P., Trung, N. H., and Green, A.: A study of the climate change impacts on fluvial flood propagation in the Viet-namese Mekong Delta, Hydrol. Earth Syst. Sci., 16, 4637–4649, doi:10.5194/hess-16-4637-2012, 2012.