Nat. Hazards Earth Syst. Sci., 14, 2715–2726, 2014 www.nat-hazards-earth-syst-sci.net/14/2715/2014/ doi:10.5194/nhess-14-2715-2014
© Author(s) 2014. CC Attribution 3.0 License.
Global patterns of lightning properties derived by OTD and LIS
S. Beirle1, W. Koshak2, R. Blakeslee2, and T. Wagner1 1Max-Planck-Institut für Chemie, Mainz, Germany
2NASA Marshall Space Flight Center, Huntsville, Alabama, USA
Correspondence to: S. Beirle ([email protected])
Received: 12 February 2014 – Published in Nat. Hazards Earth Syst. Sci. Discuss.: 24 April 2014 Revised: 29 July 2014 – Accepted: 27 August 2014 – Published: 8 October 2014
Abstract. The satellite instruments Optical Transient De-tector (OTD) and Lightning Imaging Sensor (LIS) pro-vide unique empirical data about the frequency of lightning flashes around the globe (OTD), and the tropics (LIS), which have been used before to compile a well-received global cli-matology of flash rate densities.
Here we present a statistical analysis of various additional lightning properties derived from OTD / LIS, i.e., the num-ber of so-called “events” and “groups” per flash, as well as the mean flash duration, footprint and radiance. These nor-malized quantities, which can be associated with the flash “strength”, show consistent spatial patterns; most strikingly, oceanic flashes show higher values than continental flashes for all properties. Over land, regions with high (eastern US) and low (India) flash strength can be clearly identified. We discuss possible causes for and implications of the observed regional differences. Although a direct quantitative interpre-tation of the investigated flash properties is difficult, the ob-served spatial patterns provide valuable information for the interpretation and application of climatological flash rates. Due to the systematic regional variations of physical flash characteristics, viewing conditions, and/or measurement sen-sitivities, parametrizations of lightning NOx based on total flash rate densities alone are probably affected by regional biases.
1 Introduction
Lightning is an important natural phenomenon that is stud-ied in various scientific disciplines, e.g., high-energy physics, risk assessment, meteorology, hydrology, climate, and atmo-spheric chemistry. However, the quantitative understanding
of the factors determining the occurrence and intensity of lightning, and thus its spatio-temporal patterns, is still rather poor.
Early lightning measurements from satellite detectors have been performed by the Defense Meteorological Satellite Pro-gram since the 1970s (Orville and Henderson, 1986). The Optical Transient Detector (OTD) (Boccippio et al., 2000; Christian et al., 2003) and its successor, the Lightning Imag-ing Sensor (LIS) (Christian et al., 2000), provide an em-pirical multi-annual time series of flash observations from space on global scale. OTD was delivered on a Pegasus rocket (Microlab-1) at≈710 km altitude, and was operated from April 1995 until March 2000. Its field-of-view covered a 1300 km×1300 km region of the earth with a spatial reso-lution of 10 km and a temporal resoreso-lution of 2 ms. LIS, part of the Tropical Rainfall Measuring Mission (TRMM) was launched in November 1997 and is still presently in oper-ation1. In contrast to OTD, LIS observations are restricted to the tropics (±38◦) due to the lower altitude (350 km un-til August 2001, 400 km thereafter) and inclination of the TRMM orbit. The LIS field-of-view covers 600 km×600 km with a nadir spatial resolution of about 4 km.
The lightning climatology derived from OTD / LIS (Ce-cil et al., 2014) provides a unique observational basis for the global flash distribution, seasonal cycles (e.g., Chris-tian et al., 2003) or diurnal cycles (Mach et al., 2011; Blakeslee et al., 2014). Furthermore, OTD / LIS measure-ments enable quantitative analyses of various quantities
1Note that the TRMM platform has exhausted its fuel so that it is
2716 S. Beirle et al.: Global patterns of lightning properties derived by OTD and LIS related to lightning. For instance, OTD / LIS flash rate
den-sities, i.e., the number of flashes per time and area, can serve as validation reference for parametrized flash rate den-sities. Such parameterizations are required in global chem-istry models to account for the production of nitrogen oxides (NOx= NO + NO2) by lightning, which has a large impact on tropospheric chemistry as it enables catalytic production of tropospheric ozone. Several flash parameterization schemes exist which are based on various input parameters, e.g., cloud top height, updraft velocity, or convective precipitation. Tost et al. (2007) compared several up-to-date flash parameter-izations and showed that they differ substantially from each other, and none is capable of reproducing the OTD / LIS flash rate climatology satisfactorily.
OTD / LIS flash rates are also directly used to up-scale var-ious per-flash parameterizations. For instance, Nesbitt et al. (2000) and Murray et al. (2012) estimate the global light-ning NOx (LNOx) production by scaling the climatological flash rate densities by a per-flash LNOx production factor, which is, however, rather uncertain as well (Schumann and Huntrieser, 2007), and the assumption of one globally valid number of the LNOxproduction per flash is a coarse simpli-fication.
Similarly, precipitation parameters, e.g., the rain-yield (Takayabu, 2006) or ice precipitation (Blyth et al., 2001), can be up-scaled globally from a flash climatology.
Most of such studies involving the OTD / LIS climatology employ the provided flash rate densities. These are derived from the number of detected flashes, without any differenti-ation of flash characteristics. However, flash properties, like intra-cloud (IC) vs. cloud-to-ground (CG) flashes, channel length, channel current, multiplicity, or energy, are highly variable. Consequently, empirical relations of various quan-tities to flash counts show very high scatter (see, e.g., the correlations of flash rates with cloud heights shown in Ushio et al., 2001).
In addition to statistical fluctuations, flash characteristics (particularly channel length) vary systematically on regional and temporal (seasonal) scales as a consequence of differ-ences in cloud depth and thundercloud charge extent; see for example the comparison of summertime storms in New Mex-ico with wintertime storms in Japan shown in Krehbiel et al. (1983).
Huntrieser et al. (2008) report on regional differences of the per-flash LNOxproduction. High NOxper flash has been observed over Florida, while tropical LNOxproduction over Brazil was found to be lower. As a possible explanation, Huntrieser et al. (2008) proposed that subtropical flashes have, on average, longer stroke lengths as a consequence of higher vertical wind shear compared to tropical flashes. Beirle et al. (2010) analyzed satellite observations of NO2 af-ter lightning events, and found regional differences as well: enhanced NO2, if any, was observed primarily over the south-eastern US, the Mediterranean, or south-eastern China, while al-most no NO2enhancement was observed in the tropics.
How-ever, many studies based on flash counts (or flash rate den-sities) simply ignore such regional variations of flash prop-erties for lack of empirical data. This potentially has a large impact for conclusions based on lightning climatologies.
In this study, we investigate to what extent the OTD / LIS measurements themselves provide additional information on regionally varying flash properties. A “flash” identified by OTD or LIS is the result of a multi-step clustering algorithm. The detected number of “events” and “groups” per flash (see Sect. 2), as well as information on total flash radiance, du-ration, and spatial extent, are provided for each individual flash. We investigate the spatial patterns of these flash proper-ties. The resulting means (Sect. 3) reveal clear and consistent spatial patterns, showing regions with “strong” vs. “weak” flashes.
Below, we thus simply use the term “strength” to summa-rize the level of the average flash properties. Though a di-rect physical interpretation is difficult (Sect. 4), such semi-quantitative information of regionally varying flash strength is still of high importance for the interpretation of lightning climatologies (see Sect. 5).
2 Methods
In this study we investigate mean global patterns of various flash properties, based on the OTD and LIS time series. LIS provides better statistics due to the longer measurement pe-riod. OTD, however, allows us to investigate the extra-tropics as well.
OTD and LIS flash detection is based on radiance mea-surements at 777.4 nm, a prominent atomic oxygen line in lightning spectra. Flashes are detected in a multiple step pro-cedure, as explained in detail in Christian et al. (2000) and Mach et al. (2007):
– An event is the basic unit, defined as a single CCD de-tector pixel exceeding the intensity background thresh-old.
– A group is defined as one or more simultaneous events, i.e., events that occur in adjacent detector pixels within the same integration time frame (≈2 ms).
– Finally, all groups occurring within 330 ms of a previous group and within 16.5 / 5.5 km (OTD / LIS) are clustered into a flash.
S. Beirle et al.: Global patterns of lightning properties derived by OTD and LIS 2717
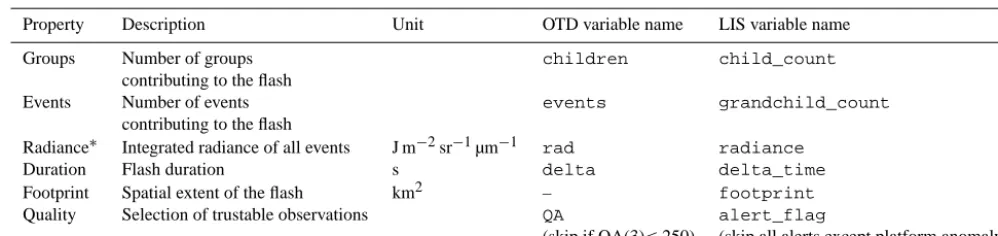
Table 1. Investigated flash properties and the respective filed names in the hdf data files provided by NASA.
Property Description Unit OTD variable name LIS variable name
Groups Number of groups children child_count
contributing to the flash
Events Number of events events grandchild_count
contributing to the flash
Radiance∗ Integrated radiance of all events J m−2sr−1µm−1 rad radiance
Duration Flash duration s delta delta_time
Footprint Spatial extent of the flash km2 – footprint
Quality Selection of trustable observations QA alert_flag
(skip if QA(3)≤250) (skip all alerts except platform anomaly)
∗Note that (a) the “flash radiance” data product is integrated over time (see unit), and (b) individual integrated event radiances are simply added to obtain the total flash radiance, so
the data product is not a solid-angle-averaged value. See the Appendix of Koshak (2010) for additional details.
The orbital OTD / LIS data sets are provided by NASA in hierarchical data format (hdf). For each individual flash, in-formation on place and time, number of events and groups, flash duration, radiance, and footprint (i.e., the spatial ex-tent, LIS only) is given. Table 1 lists the investigated quan-tities and the respective hdf field names in the OTD and LIS data sets. Note that the applied quality criteria basi-cally removes measurements affected by the South Atlantic Anomaly (SAA). LIS is less affected by the SAA than OTD due to the lower orbit.
All quantities are averaged by summing them up over the complete time series (OTD: 1995–2000; LIS: 1998–2012) on a global 1◦×1◦grid, and setting them in relation to the abso-lute number of flashes subsequently. Grid pixels are removed completely from the further analysis if more than 50 % of to-tal flashes are flagged. By this conservative masking, poten-tial artefacts are avoided. Nevertheless, similar investigations might be possible for a less restrictive flagging, if potential biasses are carefully excluded.
We also perform the analysis separately for continen-tal/oceanic/coastal flashes as classified on 0.1◦resolution. In order to investigate diurnal and seasonal variations, we bin mean flash statistics as function of hour and season.
3 Results
Mean flash properties have been calculated on a 1◦×1◦grid. Here we present the results for total flash counts (a) and the investigated mean flash properties, i.e., groups per flash (b), events per flash (c), flash radiance (d), duration (e), and foot-print (f) (LIS only), in three ways: (i) as global2maps (Figs. 1 and 2), (ii) as tables of mean properties for land and ocean,
2Note that henceforth we use the term “global” for simplicity for
both the overall patterns from OTD and LIS, despite (a) the latter only covers tropical latitudes and (b) parts of South America are masked out as a consequence of the SAA. OTD covers latitudes up to 70◦, which practically means global coverage, as polar regions show only negligible lightning activity. LIS, though covering only latitudes below 38◦, nevertheless covers 90 % of global flashes, as
and some dedicated regions (Tables 2 and 3), and (iii) as zonal means, separately for land and ocean (Fig. 3). Note that statistical errors of the zonal means are negligible due to the high sample size (>5000 for each latitude bin). Instead, we display error bars of 10%, corresponding to the uncertainty of total flash counts due to the clustering algorithm (Mach et al., 2007): if the number of flashes were biased by 10 %, the mean number of events per flash etc. would be biased by about 10 % as well.
The data presented in Figs. 1 and 2, as well as additional figures are provided in a supplement, including zonal means for coastal flashes (Supplementary Fig. S1), the diurnal cycle (Fig. S2), and seasonal maps/zonal means (Figs. S3–S6).
Note that the absolute numbers of all properties are differ-ent for OTD and LIS due to differdiffer-ent instrumdiffer-ental and orbital properties. Nevertheless, the relative patterns and latitudinal dependencies are very similar for OTD and LIS. For better comparability, we adjust the scales for both instruments ac-cording to the respective global mean value as given in the first rows in Tables 2 and 3.
Figures 1a and 2a display the total flash counts for OTD and LIS, respectively. Note that the conversion of these flash counts into a flash rate density, i.e., flashes per time and area, as provided in OTD / LIS climatologies, requires additional information on detection efficiency and view time. In par-ticular, the latitudes close to the orbital turning points are better covered than the low latitudes (compare the maxima of LIS flash counts at 30–35◦, which are not visible in the OTD data, see Fig. 3a). The appropriate correction of these effects is done elsewhere (e.g., Christian et al., 2003; Cecil et al., 2014), while in this study, the actual number of de-tected flashes is needed for the calculation of the mean flash properties. But still, the simple flash counts clearly indicate the regions with strong lightning activity in central Africa, the southeastern US, or northern India. Parts of South Amer-ica, where lightning activity is high as well, are masked by the applied quality flag as a consequence of the SAA.
2718S. Beirle et al.: Global patterns of lightning properties derived by OTD and LISS. Beirle et al.: Global patterns of lightning properties derived by OTD and LIS11
−40 −20 0 20 40 60
a)
SAA
−40 −20 0 20 40 60
b)
SAA
CG−
IC−
−40 −20 0 20 40 60
c)
SAA
CG−
IC−
−40 −20 0 20 40 60
d)
SAA
CG: 0.7
IC−
−150 −100 −50 0 50 100 150
−40 −20 0 20 40 60
e)
SAA
CG−
IC−
Number of flashes
0
500
1000
1500
2000
Groups per flash
0
2
4
6
8
Events per flash
0
5
10
15
Radiance per Flash
[J/m
2 /sr/
µ
m]
0
0.2
0.4
Flash duration [s]
0
0.1
0.2
0.3
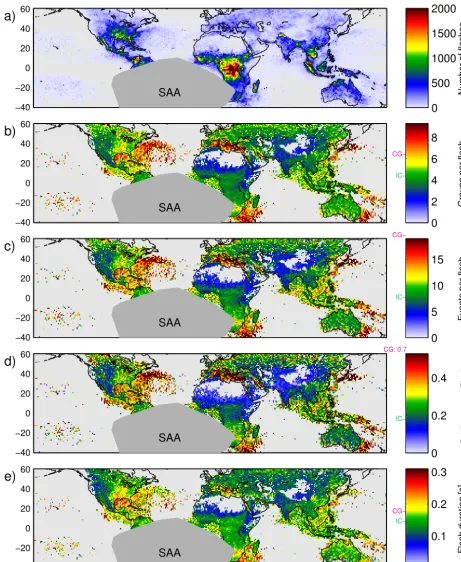
Figure 1. (a)Total number of flashes derived from OTD (1995–2000) on1◦×1◦grid. Parts of South America are masked out by the applied
quality flags as a consequence of the SAA.(b–e)Mean flash properties, i.e. groups(b), events(c), radiance(d), and duration(e)per flash.
Grid pixels with less than 50 flashes and the area affected by the SAA are discarded (light/dark grey, respectively). The color scale of panels
(b)to(e)ranges from 0 to twice the respective global mean value (see first row in Table 2). The IC/CG marks in cyan/magenta at the colorbar
indicate the mean properties of IC/CG flashes in the US as derived by Koshak (2010) (see Sect. 4.4 for details).
Figure 1. (a) Total number of flashes derived from OTD (1995–2000) on 1◦×1◦grid. Parts of South America are masked out by the applied quality flags as a consequence of the SAA. (b–e) Mean flash properties, i.e., groups (b), events (c), radiance (d), and duration (e) per flash. Grid pixels with less than 50 flashes and the area affected by the SAA are discarded (light/dark grey, respectively). The color scale of panels
(b)–(e) ranges from 0 to twice the respective global mean value (see first row in Table 2). The IC / CG marks in cyan/magenta at the color
S. Beirle et al.: Global patterns of lightning properties derived by OTD and LIS 2719
12 S. Beirle et al.: Global patterns of lightning properties derived by OTD and LIS
−40 −20 0 20 40
a)
SAA
−40 −20 0 20 40
b)
SAA
−40 −20 0 20 40
c)
SAA
−40 −20 0 20 40
d)
SAA
−40 −20 0 20 40
e)
SAA
−150 −100 −50 0 50 100 150 −40
−20 0 20 40
f)
SAA
Number of flashes
0
5000
10000
Groups per flash
5
10
15
20
Events per flash
20
40
60
80
100
Radiance per Flash
[J/m
2 /sr/
µ
m]
0
0.5
1
1.5
Flash duration [s]
0
0.2
0.4
Flash footprint [km
2 ]
0
200
400
600
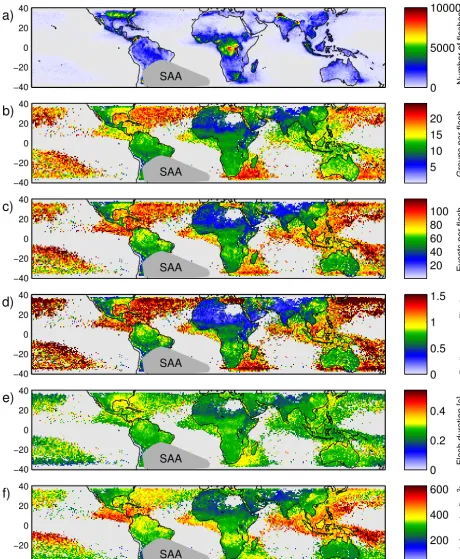
Figure 2. (a)Total number of flashes derived from LIS (1998–2012) on1◦×1◦grid. Parts of South America are masked out by the applied
quality flags as a consequence of the SAA.(b–f)Mean flash properties, i.e. groups(b), events(c), radiance(d), duration(e), and footprint(f)
per flash. Grid pixels with less than 50 flashes and the area affected by the SAA are discarded (light/dark grey, respectively). The color scale
of panels(b)to(f)ranges from 0 to twice the respective global mean value (see first row in Table 3).
2720 S. Beirle et al.: Global patterns of lightning properties derived by OTD and LIS
Table 2. Mean OTD flash properties 1995–2000 for different regions. Global values are given in absolute numbers (first row). The following
rows are given relative to the global value for better comparison to LIS (Table 3).
Region Flashes Groups per flash Events per flash Radiance per flash Duration per flash Footprint per flash
Global 4.39 4.7 9.5 0.265 0.15 –
unit ×106 J
m2sr µm s
Land 74.4 % 88 % 86 % 84 % 92 % –
Ocean 22.3 % 139 % 144 % 152 % 124 % –
Coast 3.3 % 110 % 113 % 116 % 114 % –
US East 3.6 % 115 % 111 % 103 % 123 % –
US West 1.5 % 82 % 75 % 74 % 84 % –
Congo 13.0 % 80 % 80 % 72 % 93 % –
India 3.5 % 66 % 60 % 51 % 72 % –
Japan (Winter) 0.0 % 301 % 404 % 794 % 117 % –
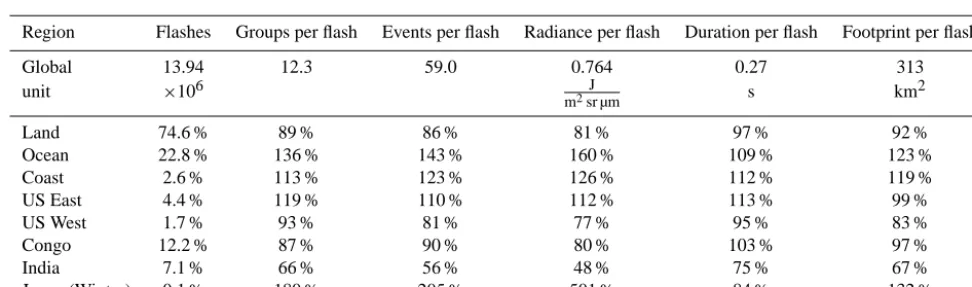
Table 3. As Table 2, but for LIS 1998–2012.
Region Flashes Groups per flash Events per flash Radiance per flash Duration per flash Footprint per flash
Global 13.94 12.3 59.0 0.764 0.27 313
unit ×106 J
m2sr µm s km2
Land 74.6 % 89 % 86 % 81 % 97 % 92 %
Ocean 22.8 % 136 % 143 % 160 % 109 % 123 %
Coast 2.6 % 113 % 123 % 126 % 112 % 119 %
US East 4.4 % 119 % 110 % 112 % 113 % 99 %
US West 1.7 % 93 % 81 % 77 % 95 % 83 %
Congo 12.2 % 87 % 90 % 80 % 103 % 97 %
India 7.1 % 66 % 56 % 48 % 75 % 67 %
Japan (Winter) 0.1 % 180 % 205 % 501 % 84 % 132 %
The global maps of the various flash properties (Figs. 1 and 2b–f) reveal clear spatial patterns, which are widely consis-tent among the different flash properties, as well as between OTD and LIS (note that (1) light/dark grey pixels represent missing values due to low statistics/the SAA, respectively, and (2) OTD means are generally noisier due to the shorter time series).
The numbers of groups (b) and events (c) per flash are strongly correlated. The radiance per flash (d) is very sim-ilar to the number of events (c) per flash, but with higher amplitude of regional variation. The flash duration (e) shows rather weak, but nevertheless significant regional variability. The mean footprint (f) shows regional variations similar to (b) or (c) over land, but a different latitudinal dependency over ocean compared to (b) (compare Fig. 3).
Below we list the main findings of the spatial and temporal variability of mean flash characteristics.
3.1 Spatial patterns
Flash counts (a) are generally far lower over oceans than over continents, as reported before (e.g., Christian et al., 2003). All investigated per-flash quantities (b–f), however,
show higher values over oceans than over land. For instance, the flash radiance over ocean is, on average, almost twice as high as over land. The number of groups and events per flash, as well as the flash footprint, are up to 50 % higher over ocean, while the flash duration is on average only 10 % longer over ocean (see Tables 2 and 3). Mean flash properties of coastal flashes fall between those of coastal and oceanic flashes (Fig. S1).
Beyond the land–ocean contrast, additional regional dif-ferences can be observed: for all properties, the lowest con-tinental values are found over North Africa, western China, and particularly India, where mean radiance per flash is only half of the global mean. High values over land are observed for the eastern US, eastern China, and Indonesia. In central Africa, where calibrated OTD / LIS flash rate densities are highest (Cecil et al., 2014), flash properties are slightly be-low average (compare Tables 2 and 3). Oceanic flashes show particularly high values at the eastern coasts of the US, Aus-tralia, and South Africa, around Japan, and over the Mediter-ranean Sea.
S. Beirle et al.: Global patterns of lightning properties derived by OTD and LISS. Beirle et al.: Global patterns of lightning properties derived by OTD and LIS 272113
0 5 10 15
% of total flashes
a)
− Land LIS/OTD− OceanLIS/OTD
0.5 1 1.5 2 LIS 0.1 0.2 0.3 0.4 0.5 0.6 OTD
flash counts [10
6 ] 50 % 100% 150% 200% 250% Groups/Flash
b)
10 15 20 25 30 4 6 8 10 50 % 100% 150% 200% 250% Events/Flashc)
50 75 100 125 150 5 10 15 20 50 % 100% 150% 200% 250% Radiance/Flashd)
0.5 0.75 1 1.25 1.5 1.75 0.2 0.3 0.4 0.5 0.6 [J/m 2 /sr/ µ m] 50 % 100% 150% 200% 250% Duration/Flashe)
0.2 0.3 0.4 0.5 0.6 0.1 0.15 0.2 0.25 0.3 0.35 0.4 [s]−40 −20 0 20 40 60
50 % 100% 150% 200% 250% Footprint/Flash
f)
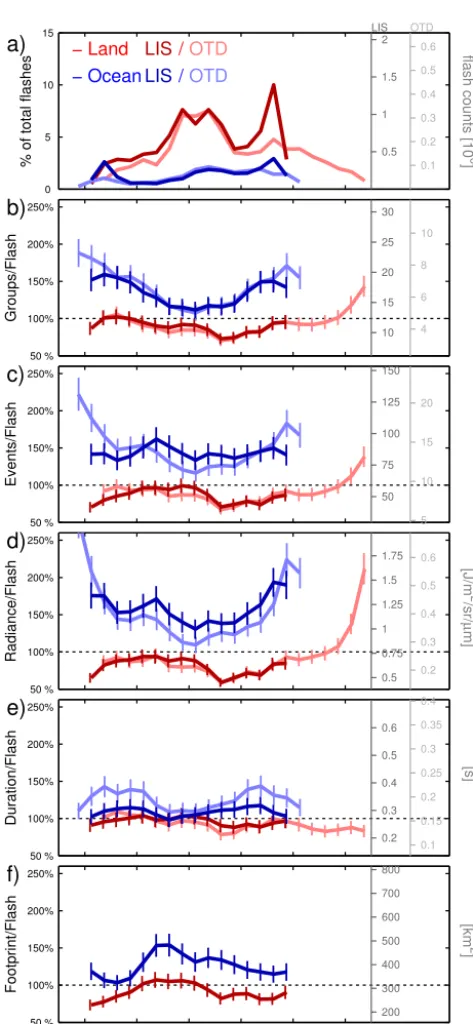
lat 200 300 400 500 600 700 800 [km 2 ]Figure 3.Latitudinal dependency of the mean flash properties for OTD (light) and LIS (dark), separately for land (red) and ocean
(blue). All quantities are integrated in latitudinal bands of 5◦width
and normalized to the respective global sum of flash counts(a)or
the global mean (btof), respectively (see first rows in Tables 2 and
3), to make OTD and LIS comparable. The original scales for both OTD and LIS are shown on additional axes at the right. Means with less than 5000 flashes in a latitudinal band are skipped. Footprint is not available for OTD. Error bars indicate the uncertainty of 10 % due to the clustering algorithm (Mach et al., 2007), while statistical errors of the means are negligible due to the high sample size.
Figure 3. Latitudinal dependency of the mean flash properties for
OTD (light) and LIS (dark), separately for land (red) and ocean (blue). All quantities are integrated in latitudinal bands of 5◦width and normalized to the respective global sum of flash counts (a) or the global mean (b–f), respectively (see first rows in Tables 2 and 3), to make OTD and LIS comparable. The original scales for both OTD and LIS are shown in the additional axes on the right. Means with less than 5000 flashes in a latitudinal band are skipped. Foot-print is not available for OTD. Error bars indicate the uncertainty of 10 % due to the clustering algorithm (Mach et al., 2007), while statistical errors of the means are negligible due to the high sample size.
over ocean, but also evident over land, but at slightly higher latitudes (≈10◦N) (Fig. 3). Latitudinal dependencies of
events per flash (c) and mean radiance (d) are similar. The flash footprint (f), however, shows a clear maximum at≈ 10◦S, both over land and ocean. The flash duration (e) shows no significant latitudinal dependency over land, while over oceans, two maxima at±30◦can be seen in OTD, which are, however, only faint in LIS data.
Groups and events per flash and particularly radiance per flash increase polewards. However, this is rather caused by the seasonal cycle than a general latitudinal dependency: the seasonal analysis (see next section and Supplemen-tary Sect. S3) reveals that in particular winter lightning in the outer tropics reveals high radiance per flash (compare Figs. S3d and S5d and note that the scale of they axis is different in order to cover the wintertime maxima).
3.2 Temporal patterns
Temporal patterns of flash rate densities derived from OTD / LIS measurements have been reported before, i.e., sea-sonal cycles (e.g., Christian et al., 2003) and diurnal cycles (Mach et al., 2011; Blakeslee et al., 2014). In the supplemen-tary material, diurnal (Sect. S2) and seasonal (Sect. S3) pat-terns of mean flash properties are presented and discussed.
Diurnal cycles of mean flash properties (Fig. S2) as a func-tion of universal time (UT) have to be interpreted with care due to the masking of the SAA, removing most flashes from South America from our analysis, and the diurnal cycle as a function of local time (LT) is affected by the satellites’ detec-tion efficiency (compare Boccippio et al., 2002). Neverthe-less, over land, mean flash properties are significantly lower after noon (≈12:00–16:00 UT, see Fig. S2 right), when thun-derstorm activity over Africa is highest.
Mean flash properties generally show only weak depen-dence on season (Figs. S3–S6). But for mid-latitudes in win-ter, very high values are observed for events and groups per flash, and in particular for the mean flash radiance. The in-crease is strongest around Japan, up to a factor of 5 / 8 for LIS / OTD, respectively (see Tables 2 and 3 and Sect. 4.7).
4 Discussion
2722 S. Beirle et al.: Global patterns of lightning properties derived by OTD and LIS 4.1 The land–ocean contrast
The physical differences between continental and oceanic thunderstorms is discussed in Williams and Stanfill (2002); thunderstorms over land have higher updraft speeds as com-pared to sea, and continental flashes are by far more frequent than oceanic flashes, mainly due to differences in surface temperature driving convection.
But the investigated mean flash properties are generally higher over ocean than over land; mean radiance per flash is almost twice as high over ocean than over land. In-tense oceanic flashes have been reported before: for instance, Füllekrug et al. (2002) report on intense negative lightning discharges occurring more often over ocean than continents in April 1998. Orville and Huffines (2001) report on en-hanced peak currents of the first stroke of negative CG flashes over oceans for the US. Said et al. (2013) found a strong and sharp land–sea contrast of peak currents globally, with much higher values over sea (compare Sect. 4.6). The physical rea-son for this land–sea difference of flash strength, intensity, or peak currents, however, remains unclear and requires further investigations.
4.2 The OTD / LIS clustering algorithm
The OTD / LIS flash clustering algorithm is carefully elabo-rated (Christian et al., 2000) and validated (Boccippio et al., 2000), while variations of the applied thresholds have only a small impact on the resulting flash counts (Mach et al., 2007). However, due to the need for an algorithm working on global scale, the clustering algorithm has to be optimized for a wide range of conditions, and thus might be performing less accurately for specific regions with extreme conditions. Validation so far is limited to some comparisons to ground-based lightning-detection networks, mostly over the US (us-ing the National Lightn(us-ing Detection Network™, NLDN). Over remote regions like central Africa, and particularly over oceans, validation of OTD / LIS flash counts is quite difficult. For example, over northern India, a region with a signif-icantly high number of flash counts, all investigated quanti-ties are minimum. Thus, the flash counts might be overes-timated by the clustering algorithm due to extraordinary re-gional conditions. Validation of the OTD / LIS measurements with ground-based lightning location networks in different parts of the world would thus be highly desirable.
4.3 Thundercloud effects
Variations in the meteorological regimes and cloud micro-physical properties drive varied electrification processes and thundercloud charge distributions, which directly affect the characteristics (like energy, current, or channel length) of the resulting lightning discharges.
In addition, clouds have a strong impact on the propa-gation of the optical pulse. Essentially, they cause a
spa-tial smearing of the optical pulse via cloud multiple scatter-ing, and the effect is more pronounced for flashes embedded more deeply below cloud top (Thomason and Krider, 1982; Koshak et al., 1994).
A comprehensive explanation of the regional variations in the observed OTD / LIS flash properties therefore requires in-depth examination of both the lightning source and the cloud multiple scattering medium. But cloud effects alone cannot explain the consistent patterns of Figs. 1 and 2, as spatial smearing by clouds can result in more events per flash, but not in enhanced flash radiances.
Thus, the observed regional variations in the OTD / LIS parameters probably indicate, to a significant extent, phys-ical differences of the flash characteristics rather than cloud conditions.
4.4 Cloud-to-ground vs. intra-cloud flashes
One important specification of flashes is the differentiation into CG and IC flashes. The partitioning is usually defined by the ratio of IC to CG flashes and denoted asz. The IC / CG ratio reveals high temporal and spatial variability; on aver-age, IC flashes are more frequent (z≈3). A systematic de-crease ofzwith latitude was reported in early studies (Pierce, 1970; Mackerras and Darveniza, 1994), and has been related to latitudinal variation of cloud base, cloud top, and freezing level heights, which determine charge separation and cloud electrification processes (see Price and Rind, 1993; Mushtak et al., 2005, and references therein).
The LNOx production per flash was considered to be higher for CG flashes. However, different studies reveal high variability, and a few studies even suggest that the LNOx pro-duction per flash is about equal for both IC and CG flashes (see the discussion and references given in Schumann and Huntrieser, 2007).
Boccippio et al. (2001) compiled maps of the IC / CG ratio over the US by comparing flash rates from OTD (IC+CG) to ground-based measurements from NLDN (CG only). Koshak (2010) has investigated the statistics of OTD flash radiance, area, duration, number of events and number of groups sep-arately for CG and IC flashes (again identified by coinci-dent NLDN measurements). A high variability of all these quantities was found, but there was a clear separation of the means for sufficiently large sample size, with generally higher means for CG compared to IC flashes. Based on these findings, z might in principle be deduced from the flash statistics observed from space, in particular the maximum group area in a flash (Koshak, 2011; Koshak and Solakewicz, 2011).
S. Beirle et al.: Global patterns of lightning properties derived by OTD and LIS 2723 characteristics to changes ofzalone, as there are several
fac-tors affecting the statistics of OTD / LIS flash properties be-sides the IC / CG ratio: in some parts of the world, the mean values derived from OTD are out of the interval spanned by the mean values for IC and CG flashes as reported by Koshak (2010) for the US. In other words, the observed mean radi-ance per flash (or any other quantity) can not be described globally by a simple linear combination of the per-flash prop-erties of “US-type” CG and IC flashes.
Nevertheless, it is very likely that regional variations of the IC / CG ratio are a main cause of the observed patterns of lightning strength, even though an easy inversion is not possible. Given the rather complex spatial patterns of mean flash properties (Figs. 1 and 2), it is probably not adequate to reduce the regional variation ofzto just a latitudinal depen-dency. For instance, northern India and Florida, although at similar latitude, show differences in mean flash properties by a factor of 2. A spread ofzvalues of similar order of magni-tude for locations at the same latimagni-tude is also visible in Fig. 1 of Mackerras and Darveniza (1994).
4.5 Flash duration vs. flash multiplicity
A flash typically consists of several successive strokes. As the total flash duration is generally longer for a larger num-ber of strokes (Malan, 1956), the global distribution of flash duration from OTD and LIS might be interpreted as proxy of the flash multiplicity. This interpretation is in accordance to the findings of Rakov and Huffines (2003), who report on a low fraction of single-stroke flashes (i.e., a high frac-tion of multiple stroke flashes) in the southeastern US, which is the continental region with longest flash duration. Also, the mean flash multiplicity maps derived from NLDN mea-surements by Orville and Huffines (2001, Figs. 17 and 18 therein) show similar patterns as mean flash duration. How-ever, a direct comparison is difficult as OTD/LIS statistics are dominated by IC flashes, while Orville and Huffines (2001) (as well as other studies on flash multiplicity) focus on CG flashes.
This topic deserves further attention, and the relation be-tween flash multiplicity and flash duration should be investi-gated quantitatively in more detail, ideally for different parts of the globe.
However, flash duration reveals relatively weak variations, and the range of variation of the other investigated quantities is much larger. That is, the flash multiplicity might explain partly, but not completely, the observed regional differences in flash strength.
4.6 Peak current
Orville and Huffines (2001) present maps of median peak currents for the US, separately for negative and positive CG flashes, based on NLDN measurements. Negative peak cur-rents show a similar pattern as mean OTD/LIS flash
prop-erties (i.e., higher values for the eastern US), while positive peak currents show an almost inverted pattern. The global pattern of peak currents in negative CG flashes has been in-vestigated recently by Said et al. (2013), based on observa-tions of the global lightning network GLD360. Peak currents reveal a strong and sharp land–sea contrast, with much higher values over sea, which can not be explained by DE alone (see Sect. 4.1). Over land, the mapped peak current from GLD360 reveals some similarities to our spatial patterns as well; a sig-nificant number of negative events with peak currents above 150 kA is observed over the southeastern US and over China, but only very few of such high-current flashes are found in central Africa or northern India (compare Said et al., 2013, Fig. 6 therein).
Again, comparisons to mean OTD / LIS flash properties are difficult, as they are dominated by IC flashes. But, nev-ertheless, the similar spatial patterns might be related to a common physical origin driving the peak currents and flash strengths.
4.7 The seasonal cycle and winter lightning in Japan
Flash counts show a clear seasonal cycle, which has been re-ported in detail before (Christian et al., 2003). Mean flash properties generally show only weak seasonal variations, but are significantly increased for the outer tropics in the respec-tive hemispheric winter (see Figs. S3 and S5 and note the change inyaxis compared to Fig. 3 in order to cover the full range of values). The most striking result is the record-high values around Japan in winter.
Lightning around Japan in winter has been reported to be extraordinary in several respects before (see Kitagawa and Michimoto, 1994 and references therein); Rakov and Uman (2003) dedicate a book chapter to this topic and summarize that “lightning discharges produced by winter storms in the coastal area of the Sea of Japan exhibit a number of features . . .that have not been observed . . . in any season in other geographical locations”. We want to add that flash properties in winter are extreme for other regions as well (Atlantic east of US and Mediterranean sea in December to February, east of South Africa and east of Australia in June to August), but nowhere as high as for Japan.
Reasons for the observed high per-flash properties in Japanese winter storms might be a high percentage of +CG flashes, and large and long-lasting currents, transferring charges up to 1000 C (see Rakov and Uman, 2003; Suzuki et al., 2011, and references therein).
4.8 The diurnal cycle and implications for the global electric circuit
2724 S. Beirle et al.: Global patterns of lightning properties derived by OTD and LIS a maximum at≈19:00 UT, which has since long been linked
to the diurnal cycle of lightning activity (Whipple, 1929). Diurnal patterns of OTD / LIS flash rate densities have been investigated by Mach et al. (2011) and Blakeslee et al. (2014). Generally, a good correlation between the diurnal cy-cles of flash rate densities and the Carnegie curve is observed (see Fig. 10 in Mach et al., 2011).
Diurnal cycles of mean flash properties are presented and discussed in the supplementary material (Sect. S2). Flash properties over land reveal a clear minimum around noon (UT) (see Fig. S2b–f, right) when African flashes dominate, with relatively low flash properties compared to the US (dominating the global flash activity in late after-noon/evening) and Indonesia (dominating in morning). Thus, the simple consideration of flash rate densities probably over-estimates the contribution of African flashes to the GEC, as they are frequent, but “weak” (i.e., probably carrying less current, see Sect. 4.6). Further investigations in this direction would be very interesting in order to check this hypothesis as a possible explanation of the slightly different patterns of Carnegie curve and lightning activity (compare the discus-sion in Kartalev et al., 2006). However, the discusdiscus-sion can not be reduced to conventional flashes alone, as other pro-cesses like electrified shower clouds or jets and sprites affect the GEC as well (Mach et al., 2011; Siingh et al., 2007).
4.9 Implications for lightning NOx
The flash energy is directly related to the NOxproduction by lightning (Wang et al., 1998). Thus, from the regional dif-ferences of the mean radiance per flash, one would expect particularly high LNOx production per flash e.g., over the Mediterranean, the Pacific downwind (east) from Australia, or the eastern US, whereas it should be low for e.g., cen-tral Africa. These regional differences are consistent with the findings of Huntrieser et al. (2008), who observed the highest LNOxproduction per flash in Florida, and with Beirle et al. (2010), where enhanced NO2 due to lightning, if any, was observed over the respective regions with high radiance per flash.
5 Conclusions
The satellite instruments OTD and LIS provide multi-annual time series of global lightning, establishing an ample data set sufficient for the investigation of robust mean flash charac-teristics, despite the high variability of individual flashes. We have analyzed mean OTD / LIS flash properties in order to in-vestigate regional and temporal variations in flash character-istics. All investigated quantities, i.e., the number of groups and events per flash, as well as the mean flash radiance, du-ration, or footprint, reveal clear and mostly consistent spatial patterns.
Generally, oceanic flashes – by far less frequent than con-tinental flashes – show higher per-flash values: mean
radi-ances are twice as high for oceanic flashes compared to land. Over continents, regions with strong (especially the eastern US) and weak (e.g., India, with only half as many events per flash) flash characteristics can be identified. A reduction to a simple latitudinal dependency is not sufficient to reflect these regional patterns.
The observed regional differences are driven by many factors (e.g., differences in cloud scattering properties, the relative number of CGs and ICs, flash multiplicity, frac-tion of positive polarity CGs, cloud charge extent and mag-nitude). Further investigations are needed to identify the most important drivers, which requires additional informa-tion, e.g., from local and global ground-based lightning works like NLDN, the world wide lightning detection net-work WWLLN (Lay et al., 2007; Hutchins et al., 2012) or GLD360 (Said et al., 2013). However, the observed extreme values over ocean or remote regions like central Africa will probably remain challenging to evaluate further due to the lack of regional data.
Due to the complex interaction of different effects, a sim-ple inversion of the investigated flash properties, for retriev-ing flash quantities like the IC / CG ratio, is quite difficult. Nevertheless, the regional variations of flash characteristics found in this study provide added knowledge, with direct implications for applications of OTD / LIS climatologies. In particular, the results of this study will help to improve the parameterization of the LNOxproduction within global chemistry/climate models.
The high values of mean flash properties observed in the eastern US needs to be recognized by the scientific com-munity since a significant fraction of lightning field studies and aircraft campaigns are conducted in this region. That is, LNOxestimates derived from this region are likely not appli-cable to the global scale.
The Supplement related to this article is available online at doi:10.5194/nhess-14-2715-2014-supplement.
Acknowledgements. We thank Christoph Hörmann, Marloes Penning de Vries, Steffen Dörner (MPI for Chemistry), Ulrich Finke (Hannover University), Hartmut Höller, Heidi Huntrieser (both DLR Oberpfaffenhofen), and Dennis Buechler (University of Alabama, Huntsville) for valuable suggestions and comments on this study. We appreciate the comments and suggestions of Colin Price and Yoav Yair during NHESS discussion, all of which im-proved and strengthened the study significantly. Original OTD/LIS data is provided by NASA: http://thunder.msfc.nasa.gov/data/.
The service charges for this open access publication have been covered by the Max Planck Society.
Edited by: A. Mugnai
S. Beirle et al.: Global patterns of lightning properties derived by OTD and LIS 2725 References
Beirle, S., Huntrieser, H., and Wagner, T.: Direct satellite obser-vation of lightning-produced NOx, Atmos. Chem. Phys., 10, 10965–10986, doi:10.5194/acp-10-10965-2010, 2010.
Blakeslee, R. J., Mach, D. M., Bateman, M. G., and Bailey, J. C.: Seasonal variations in the lightning diurnal cycle and implica-tions for the global electric circuit, Atmos. Res., 135–136, 228– 243, doi:10.1016/j.atmosres.2012.09.023, 2014.
Blyth, A. M., Christian Jr., H. J., Driscoll, K., Gadian, A. M., and Latham, J.: Determination of ice precipitation rates and thunderstorm anvil ice contents from satellite observations of lightning, Atmos. Res., 59–60, 217–229, doi:10.1016/S0169-8095(01)00117-X, 2001.
Boccippio, D. J., Koshak, W., Blakeslee, R., Driscoll, K., Mach, D., Buechler, D., Boeck, W., Christian, H. J., and Goodman, S. J.: The Optical Transient Detector (OTD): instrument characteris-tics and cross-sensor validation, J. Atmos. Ocean. Tech., 17, 441– 458, 2000.
Boccippio, D. J., Cummins, K. L., Christian, H. J., and Goodman, S. J.: Combined satellite- and surface-based estimation of the intracloud-cloud-to-ground lightning ratio over the continental United States, Mon. Weather Rev., 129, 108–122, 2001. Boccippio, D. J., Koshak, W. J., and Blakeslee, R. J.: Performance
assessment of the optical transient detector and lightning Imag-ing sensor. Part I: Predicted diurnal variability, J. Atmos. Ocean. Tech., 19, 1318–1332, 2002.
Cecil, D. J., Buechler, D. E., and Blakeslee, R. J.: Grid-ded lightning climatology from TRMM-LIS and OTD: Dataset description, Atmos. Res., 135–136, 404–414, doi:10.1016/j.atmosres.2012.06.028, 2014.
Christian, H. J., Blakeslee, R. J., Goodman, S. J., and Mach, D. M.: Algorithm Theoretical Basis Document for the Lightning Imag-ing Sensor, available at: http://thunder.nsstc.nasa.gov/bookshelf/ pubs/atbd-lis-2000.pdf, last access: 22 November 2012, 2000. Christian, H. J., Blakeslee, R. J., Boccippio, D. J., Boeck, W. L.,
Buechler, D. E., Driscoll, K. T., Goodman, S. J., Hall, J. M., Koshak, W. J., Mach, D. M., and Stewart, M. F.: Global fre-quency and distribution of lightning as observed from space by the Optical Transient Detector, J. Geophys. Res., 108, 4005, doi:10.1029/2002JD002347, 2003.
Füllekrug, M., Price, C., Yair, Y., and Williams, E. R.: Letter to the
Editor Intense oceanic lightning, Ann. Geophys., 20, 133–137,
doi:10.5194/angeo-20-133-2002, 2002.
Harrison, R. G.: The Carnegie Curve, Surv. Geophys., 34, 209–232, doi:10.1007/s10712-012-9210-2, 2013.
Huntrieser, H., Schumann, U., Schlager, H., Höller, H., Giez, A., Betz, H.-D., Brunner, D., Forster, C., Pinto Jr., O., and Calheiros, R.: Lightning activity in Brazilian thunderstorms during TROC-CINOX: implications for NOxproduction, Atmos. Chem. Phys., 8, 921–953, doi:10.5194/acp-8-921-2008, 2008.
Hutchins, M. L., Holzworth, R. H., Rodger, C. J., and Brundell, J. B.: Far-field power of lightning strokes as measured by the World Wide Lightning Location Network, J. Atmos. Ocean. Tech., 29, 1102–1110, doi:10.1175/JTECH-D-11-00174.1, 2012. Kartalev, M. D., Rycroft, M. J., Fuellekrug, M., Papitashvili, V. O., and Keremidarska, V. I.: A possible explanation for the dominant effect of South American thunderstorms on the Carnegie curve, J. Atmos. Sol.-Terr. Phy., 68, 457–468, doi:10.1016/j.jastp.2005.05.012, 2006.
Kitagawa, N. and Michimoto, K.: Meteorological and electrical aspects of winter thunderclouds, J. Geophys. Res., 99, 10713– 10721, doi:10.1029/94JD00288, 1994.
Koshak, W. J.: Optical characteristics of OTD flashes and the im-plications for flash-type discrimination, J. Atmos. Ocean. Tech., 27, 1822–1838, doi:10.1175/2010JTECHA1405.1, 2010. Koshak, W. J.: A mixed exponential distribution model
for retrieving ground flash fraction from satellite light-ning imager data, J. Atmos. Ocean. Tech., 28, 475–492, doi:10.1175/2010JTECHA1438.1, 2011.
Koshak, W. J. and Solakewicz, R. J.: Retrieving the fraction of ground flashes from satellite lightning imager data using CONUS-based optical statistics, J. Atmos. Ocean. Tech., 28, 459–473, doi:10.1175/2010JTECHA1408.1, 2011.
Koshak, W. J., Solakiewicz, R. J., Phanord, D. D., and Blakeslee, R. J.: Diffusion model for lightning radiative transfer, J. Geo-phys. Res., 99, 14361–14371, 1994.
Krehbiel, P. R., Brook, M., Lhermitte, R. L., and Lennon, C. L.: Lightning charge structure in thunderstorms, in: Proceedings in Atmospheric Electricity, edited by: Ruhnke, L. H. and Latham, J., A. Deepak Publ., Hampton, VA, 408–410, 1983. Lay, E. H., Jacobson, A. R., Holzworth, R. H., Rodger, C. J.,
and Dowden, R. L.: Local time variation in land/ocean light-ning flash density as measured by the World Wide Light-ning Location Network, J. Geophys. Res., 112, D13111, doi:10.1029/2006JD007944, 2007.
Mach, D. M., Christian, H. J., Blakeslee, R. J., Boccippio, D. J., Goodman, S. J., and Boeck, W. L.: Performance assessment of the Optical Transient Detector and Lightning Imaging Sen-sor, J. Geophys. Res., 112, D09210, doi:10.1029/2006JD007787, 2007.
Mach, D. M., Blakeslee, R. J., and Bateman, M. G.: Global elec-tric circuit implications of combined aircraft storm elecelec-tric cur-rent measurements and satellite-based diurnal lightning statistics, J. Geophys. Res., 116, D05201, doi:10.1029/2010JD014462, 2011.
Mackerras, D. and Darveniza, M.: Latitudinal variation of lightning occurrence characteristics, J. Geophys. Res., 99, 10813–10821, doi:10.1029/94JD00018, 1994.
Malan, D. J.: The relation between the number of strokes, stroke in-tervals and the total durations of lightning discharges, Geofisica Pura e Applicata, 34, 224–230, doi:10.1007/BF02122829, 1956. Matsudo, Y., Suzuki, T., Hayakawa, M., Yamashita, K., Ando, Y., Michimoto, K., and Korepanov, V.: Characteristics of Japanese winter sprites and their parent lightning as estimated by VHF lightning and ELF transients, J. Atmos. Sol.-Terr. Phy., 69, 1431– 1446, doi:10.1016/j.jastp.2007.05.002, 2007.
Murray, L. T., Jacob, D. J., Logan, J. A., Hudman, R. C., and Koshak, W. J.: Optimized regional and interannual variability of lightning in a global chemical transport model constrained by LIS/OTD satellite data, J. Geophys. Res., 117, D20307, doi:10.1029/2012JD017934, 2012.
Mushtak, V., Williams, E. R., and Boccippio, D. J.: Lati-tudinal variations of cloud base height and lightning parameters in the tropics, Atmos. Res., 76, 222–230, doi:10.1016/j.atmosres.2004.11.010, 2005.
2726 S. Beirle et al.: Global patterns of lightning properties derived by OTD and LIS
Optical Transient Detector (OTD), Tellus B, 52, 1206–1215, doi:10.1034/j.1600-0889.2000.01121.x, 2000.
Orville, R. and Henderson, R.: Global distribution of mid-night lightning – September 1977 to August 1978, Mon. Weather Rev., 114, 2640–2653, doi:10.1175/1520-0493(1986)114<2640:GDOMLS>2.0.CO;2, 1986.
Orville, R. E. and Huffines, G. R.: Cloud-to-ground lightning in the United States: NLDN results in the first decade, 1989– 98, Mon. Weather Rev., 129, 1179–1193, doi:10.1175/1520-0493(2001)129<1179:CTGLIT>2.0.CO;2, 2001.
Pierce, E. T.: Latitudinal Variation of Lightning Parame-ters, J. Appl. Meteorol., 9, 194–195, doi:10.1175/1520-0450(1970)009<0194:LVOLP>2.0.CO;2, 1970.
Price, C. and Rind, D.: What Determines the Cloud-to-Ground Lightning Fraction in Thunderstorms, Geophys. Res. Lett., 20, 463–466, doi:10.1029/93GL00226, 1993.
Rakov, V. A. and Huffines, G. R.: Return-stroke multiplicity of neg-ative cloud-to-ground lightning flashes, J. Appl. Meteorol., 42, 1455–1462, 2003.
Rakov, V. A. and Uman, M. A.: Lightning: Physics and Effects, Cambridge University Press, 2003.
Said, R. K., Cohen, M. B., and Inan, U. S.: Highly intense light-ning over the oceans: estimated peak currents from global GLD360 observations, J. Geophys. Res., 118, 6905–6915, doi:10.1002/jgrd.50508, 2013.
Schumann, U. and Huntrieser, H.: The global lightning-induced nitrogen oxides source, Atmos. Chem. Phys., 7, 3823–3907, doi:10.5194/acp-7-3823-2007, 2007.
Siingh, D., Gopalakrishnan, V., Singh, R. P., Kamra, A. K., Singh, S., Pant, V., Singh, R., and Singh, A. K.: The atmospheric global electric circuit: An overview, Atmos. Res., 84, 91–110, doi:10.1016/j.atmosres.2006.05.005, 2007.
Suzuki, T., Matsudo, Y., Asano, T., Hayakawa, M., and Michimoto, K.: Meteorological and electrical aspects of several winter thun-derstorms with sprites in the Hokuriku area of Japan, J. Geophys. Res., 116, D06205, doi:10.1029/2009JD013358, 2011.
Takayabu, Y. N.: Rain-yield per flash calculated from TRMM PR and LIS data and its relationship to the contribution of tall convective rain, Geophys. Res. Lett., 33, L18705, doi:10.1029/2006GL027531, 2006.
Thomason, L. W. and Krider, E. P.: The effects of clouds on the light produced by lightning, J. Atmos. Sci., 39, 2051–2065, 1982. Tost, H., Jöckel, P., and Lelieveld, J.: Lightning and
convec-tion parameterisaconvec-tions – uncertainties in global modelling, At-mos. Chem. Phys., 7, 4553–4568, doi:10.5194/acp-7-4553-2007, 2007.
Ushio, T., Heckman, S. J., Boccippio, D. J., Christian, H. J., and Kawasaki, Z. I.: A survey of thunderstorm flash rates compared to cloud top height using TRMM satellite data, J. Geophys. Res., 106, 24089–24095, doi:10.1029/2001JD900233, 2001.
Wang, Y., DeSilva, A. W., Goldenbaum, G. C., and Dickerson, R. R.: Nitric oxide production by simulated lightning: depen-dence on current, energy, and pressure, J. Geophys. Res., 103, 19149–19159, doi:10.1029/98JD01356, 1998.
Whipple, F. J. W.: On the association of the diurnal variation of electric potential gradient in fine weather with the distribution of thunderstorms over the globe, Q. J. Roy. Meteor. Soc., 55, 1–18, doi:10.1002/qj.49705522902, 1929.