Analysis On The Effect Of
Express Checkouts In Retail Stores
Jin Kyung Kwak, Ewha Womans University, South KoreaABSTRACT
In this study, we investigate the effect of having express checkout lanes in retail stores. Express checkout lanes are being used to reduce expected wait time of small-buying customers, but their operational effect has not been analyzed so far. By comparing the wait time and the queue length of the two scenarios (universal checkout lanes only and separated checkout lanes with express counters) via simulation, we have found that the average wait time of the separated checkout lanes may not be shorter than that of universal checkout lanes. This may be due to that the effect of pooling servers decreases as the number of servers being pooled at each checkout set decreases. The queue length of express checkout lanes may be shorter than that of universal checkout lanes, but in some cases, the average queue length of separated checkout lanes is longer than that of universal checkout lanes, probably due to the effect of pooling servers. By conducting a computational study, we have observed that the effect of pooling servers decreases with customer arrival rate, decreases with regular checkout duration, and slightly increases with regular checkout time variability. These results give us an insight on when the express checkout counters can be effective in retail service operations.
Keywords: Express Checkout; Queueing Simulation; Wait Time; Queue Length; Pooling Effect; Retail Industry
1. INTRODUCTION
any Companies make various efforts in order to enhance operational efficiency and/or increase customer satisfaction in the long run. However, it is of question whether their strategies or practices actually do the job for the intended purposes. Express checkout lanes, which we commonly face in large retail outlets, are one of such systems designed for better operational performance. Some retail stores have express checkout lanes to reduce expected waiting time of the customers who buy fewer items (e.g. 15 items or less) in addition to regular checkout lanes. It is expected that these small-buying customers may not have to wait for checkout so long by such separation. There have been some marketing or psychological literatures about customer checkout behaviors in retail industries (Miranda, 2008), but as far as it is known, there is no comprehensive study about operational effects of express checkout lanes.
In this article, we investigate the impact of retail stores having express checkout counters on customers’ expected wait time and average queue length. Related research questions are as follows. Does having express checkout lanes reduce the wait time or the queue length of small-buying customers? How much does the existence of express checkout counters reduce the average customer wait time or the average queue length? What factors affect the effect of having express checkout counters? By comparing the two scenarios – the universal checkout lanes only and the separated checkout lanes with express counters, we observe how the separation affects the wait time and the queue length of the checkout customers.
The two scenarios are simplified, modeled, and analyzed with a specific setup. We assume that customer inter-arrival times are exponentially distributed and checkout durations are normally distributed. We also assume that the checkout duration depends on whether the customer buys small or large. The computational results show that, in more than half of the simulated cases, both the average wait time and the average queue length are longer when the checkout lanes are separated into express and regular. This observation seems due to that the effect of pooling servers is reduced if the checkout lanes are separated. Though the models analyzed in this study are relatively simple, the results imply that it may be better not to have express checkout counters as they decrease the benefit from pooling the checkout clerks. Express checkout lanes may reduce the queue length for small-buying customers,
but may not reduce the average wait time and the average number of waiting customers under some situations. Further consideration should be imposed when the checkout lanes are separated into express and regular.
As a result of the computational study, we have found that the effect of pooling servers in universal checkout lanes decreases with arrival rate and regular service time, and increases with regular service time variability. The effect of pooling seems closely related with the number of total checkout servers. Particularly, when the arrival rate is high and the regular service time is long, the average queue length can be reduced by having express checkout lanes. These findings give us a managerial insight about when the express checkout counters can be beneficial in retail stores.
In the next section, related literatures are introduced. The research models to analyze the effect of express checkout counters are illustrated in section 3. The computational setup and analysis are presented in section 4. Section 5 concludes the study with limitations and future research directions.
2. LITERATURE REVIEW
It is quite surprising that there have been very few studies about the effect of express checkout in retail industries even though more than twenty years have passed since the express checkout counters were introduced (Trinkaus, 1993). It does not mean the subject is not important; the situations to be analyzed are rather complicated. In this study, we do not evaluate the express checkout counters with the criteria of customer satisfaction; instead we want to analyze the effectiveness of express checkout counters by comparing when there are express checkout lanes and when there are not.
Existing literatures have focused on the impact of customers’ wait time on their satisfaction in services. In general, as the customers’ average wait time increases, the degree of satisfaction in services decreases (Davis & Vollmann, 1990; Davis & Heineke, 1998). Even when the wait time is not very long, the waiting itself has a negative impact on service evaluation (Taylor, 1994). Bielen & Demoulin (2007) and Anic, Radas, & Miller (2011) have analyzed the impact of consumer wait time on the store loyalty. These researches support the need of express checkout counters for customer satisfaction but have not considered operational aspect of how the existence of express checkout actually influences on the waiting of customers. While these former studies have found that the waiting of customers has a negative impact on service operations, this study verifies the effectiveness of a policy designed to reduce the waiting problems.
Another related research theme is retail checkout lanes, but there are very few studies on the topic. Industrial periodicals, rather than academic journals, have reported the findings about retail checkouts. According to Natural Foods Merchandiser (2007), if the consumers’ wait time at the checkout counters is longer than 5 minutes, their satisfaction level is observed to be significantly low whereas 90% of customers are very satisfied if the wait time is between 1 and 3 minutes. One of ten customers who leave the store without purchase pointed out the waiting as one of the reasons of their leaving. Chain Store Age (2008) has introduced the similar observations. From these surveys, the issue of waiting for checkout is designated to be important for retail service operations.
The academic literatures about retail checkouts usually analyze the layout design (Davidson, 1978) or the self-service checkout lanes (Dabholkar, Bobbit, & Lee, 2003; Dean, 2008; Marzocchi & Zammit, 2006). Self-self-service checkouts are different from express checkouts with regards to the purposes or the effects. For self-service checkouts, there is no restriction on the number of items the customers purchase and the customers themselves actively do the checkout job instead of being served. As far as we know, this is the first study to analyze the operational aspect of express checkout lanes.
3. MODELS
Both models have the following common assumptions. First, customer inter-arrival times are exponentially distributed and service (checkout) times are normally distributed. Second, the queue discipline is come, first-served. Third, the customers who arrive for checkout do not balk, jockey, or renege. Fourth, the service time (checkout duration) depends on whether the customer buys small (15 items or less) or large (16 items or more). Lastly, virtually there is only one waiting line for several checkout counters. In reality, there can be several queues, one for each counter. However, instead of s times of M/G/1 case, we assume an M/G/s case as it is a reasonable assumption that waiting customers for checkout will choose an available clerk if any. Schimmel (2013) has also asserted that the best case (M/G/s) is a good approximation of the simulation case where each checkout counter has a queue and customers join the shortest queue of the express or regular lines respectively.
Model 1 is for universal checkout lanes. In other words, regardless of item numbers, the customers form a waiting line in front of a pool of identical checkout counters and are served whenever there is an available checkout clerk.
Figure 1. Model 1 for universal checkout lanes
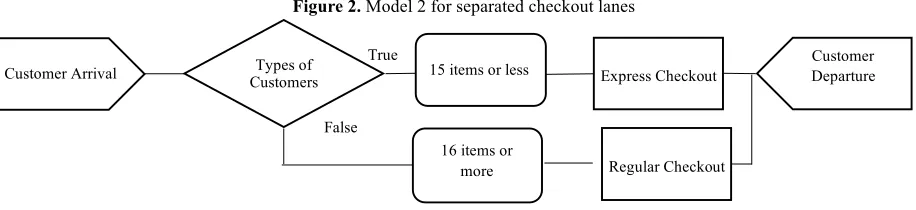
On the other hand, Model 2 is for separated checkout lanes. The customers who buy 15 items or less form a queue in front of a pool of express checkout counters and are served whenever there is an available express checkout clerk. The customers who buy 16 items or more form another queue in front of a pool of regular checkout counters and are served whenever there is an available regular checkout clerk.
Figure 2. Model 2 for separated checkout lanes
Though the models are relatively simple, they sufficiently support to analyze the effect of separating checkout lanes into express and regular in comparison to having universal checkouts only. By comparing the wait time and the queue length of both models, we can search for whether and when the existence of express checkout lanes does help to reduce the waiting problems.
Customer Arrival Customers Types of 15 items or less Checkout
Customer Departure
16 items or more True
False
Customer Arrival Customers Types of Express Checkout
Customer Departure
16 items or more True
False
4. COMPUTATIONAL STUDY
In order to analyze the effect of express checkouts by comparing the wait time and the queue length of two models, we conduct a computational study with a specific setup via simulation. We use ARENA simulation with 10,000 iterations for each case. The simulation setup is as follows.
• Express service time = Normal(2,1) (unit: minutes) fixed as a ground measure • Arrival rate = {60, 120, 180} (unit: customers/hour)
• Regular service time = {Normal(4,1), Normal(4,2), Normal(4,3), Normal(6,1), Normal(6,2), Normal(6,3), Normal(8,1), Normal(8,2), Normal(8,3)} (unit: minutes)
• Ratio of Small-buying Customers = {10, 20, 30, 40, 50, 60, 70, 80, 90} (unit: %)
As a ground measure, we assume that express checkout service time is normally distributed with mean 2 minutes and standard deviation 1 minute. We vary other variables and this computational setup generates 243 different cases. For each case, we compare Model 1 and Model 2.
First, we compute the number of servers needed for checkout under each setup. In this study, we determine the number of servers to maximize the utilization of express and regular checkout sets respectively in Model 2. For example, when the arrival rate is 120, the regular service time is Normal(6,1), and the small-buying ratio is 10%, 12 customers use the express checkout counters on average and thus we need one express checkout clerk as the service rate of the express clerks is 30; 108 customers use the regular checkout counters on average and thus we need 6 regular checkout clerks as the service rate of the regular checkout counters is 20; and for Model 1, there are 7 checkout clerks under this setup. The utilization of Model 1 in this case may not be maximized, but as our purpose is to compare the two models, the total number of checkout clerks should be the same. That is, we allocate the same workforce for both models, which is an appropriate assumption considering the labor issues. We simulate all the cases with 100 replications assuming each day equals two working hours. For each case, we obtain the wait time and the queue length of customers waiting for checkout in both models.
As a result of the computational study, the queue length of express checkouts in Model 2 is shorter than the queue length of universal checkouts in Model 1 in 193 out of 243 cases (79.42%). Other than that, the customers are worse off when there are express checkout lanes in more than half cases. The wait time of express checkouts in Model 2 is shorter in 87 out of 243 cases (35.80%) and the wait time of regular checkouts in Model 2 is shorter in only 2 out of 243 cases (0.82%) than the wait time of universal checkouts in Model 1. The queue length of regular checkouts in Model 2 is shorter in 116 out of 243 cases (47.74%) and the queue length of both express and regular checkouts in Model 2 is shorter in 68 out of 243 cases (27.98%) than the queue length of universal checkouts in Model 1.
These results are counter-intuitive as the existence of express checkout lanes does not always reduce the overall wait time and queue length of the customers waiting for checkout. In fact, we rather observe that average wait time and average queue length is even longer for separated checkout lanes. Average wait time and average queue length of Model 2 are computed as a weighted mean using the ratio of small-buying customers. Average wait time of Model 2 is shorter than the wait time of Model 1 in only 2 out of 243 cases (0.82%), and average queue length of Model 2 is shorter than the queue length of Model 1 in 113 out of 243 cases (46.50%). The possible explanation is an effect of pooling servers. It is known that average wait time is reduced when the servers are pooled (Cachon & Terwiesch, 2009) as the pooled process prevents the case that one resource is idle while the others face waiting customers. When the checkout lanes are separated into express and regular, the effect of pooling servers seems to decrease because the number of servers being pooled at each checkout set decreases.
In order to analyze under what circumstances the universal checkouts are more effective, we define the two measures, Pooling Effect in Wait Time and Pooling Effect in Queue Length, as follows.
2 Model of Time Wait Average 1 Model of Time Wait -2 Model of Time Wait Average 100 (%) Time in Wait Effect
This measure reflects the percentage reduction in average wait time for checkout of all customers when the checkout lanes are not separated compared to when the checkout lanes are separated into express and regular. Under the computational setup, the average value of this measure is 44.83% with the minimum -1.93% and the maximum 71.53%.
2 Model of Length Queue Average
1 Model of Length Queue -2 Model of Length Queue Average 100
(%) Length Queue in Effect
Pooling = ´
This measure indicates the percentage reduction in average queue length for checkout of all customers when the checkout lanes are not separated compared to when the checkout lanes are separated into express and regular. Under the computational setup, the average value of this measure is 2.25% with the minimum -62.60% and the maximum 68.51%.
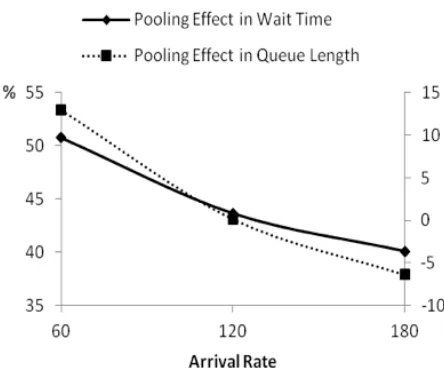
Figure 3 shows the average value of the above-defined measures with respect to arrival rate. It is observed that both Pooling Effect in Wait Time and Pooling Effect in Queue Length decreases as the arrival rate increases. As the arrival rate increases, the total number of checkout clerks increases. For the computational setup, average number of total checkout clerks is 5.11 for arrival rate 60, 9.11 for arrival rate 120, and 13.11 for arrival rate 180. Considering that the marginal effect of pooling servers decreases as the number of servers increases, the benefit from universal checkout seems to decrease as the arrival rate increases. When the arrival rate is 180, average Pooling Effect in Queue Length has a negative value, which means the separation of checkout lanes into express and regular can reduce the average number of customers waiting for checkout.
Figure 3. Pooling Effect with respect to Arrival Rate
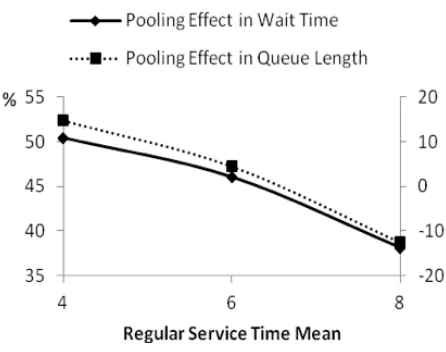
Figure 4. Pooling Effect with respect to Regular Service Time Mean
Figure 5 shows the average value of the measures with respect to regular service time variability. It is observed that both Pooling Effect in Wait Time and Pooling Effect in Queue Length increases slightly as the standard deviation of regular checkout service time increases. The average number of total servers is 9.11 regardless of service time standard deviations. That is probably why the difference of pooling effect for different service time variability is minimal. The slight increase of the pooling effects with respect to the regular service time variability may be due to that the benefit of pooling servers increases when the uncertainty in service time increases.
Figure 5. Pooling Effect with respect to Regular Service Time Variability
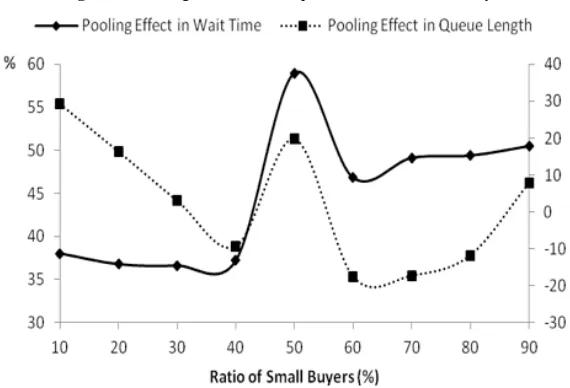
Figure 6. Pooling Effect with respect to Ratio of Small Buyers
5. CONCLUSION
In this study, we have found that the express checkout lanes may not reduce the expected wait time of customers waiting for checkout in retail stores in contrast to the intended purposes of having them. Therefore, under some situations, it may be more desirable not to have express checkout counters. This may be related to pooling servers. It is known that pooling servers reduces the expected wait time of customers. Separating checkout lanes into express and regular makes the number of servers being pooled at each checkout set reduced, thereby decreasing the effect of pooling servers.
The existence of express checkout lanes may reduce the average queue length of small-buying customers. It may also reduce the average queue length of all customers in some cases, particularly when the arrival rate is high and/or when the regular checkout time is long. This seems because the marginal effect of pooling decreases as the number of servers increases. However, in some cases, the average queue length may be even longer for separated checkout lanes probably due to the effect of pooling servers.
From the computational study, we have observed that the effect of pooling servers in the average wait time and in the average queue length decreases with the arrival rate, decreases with the regular service time mean, and slightly increases with the regular service time variability. These results may be related to the number of servers. We do not find the specific relationship between the effect of pooling servers and the ratio of small-buying customers. What factors directly affect the effect of pooling servers needs to be explored in future research.
The results of this study implies that we may have to be careful adapting express checkout lanes in retail industry. For example, it may be desirable not to have express lanes especially when the customer arrival rate is low and/or when the regular checkout duration is relatively short. In addition to the practical implication, this study contributes to the operations management literature with the theoretical finding that separating checkout lanes is not beneficial in average wait time and in average queue length as it reduces the effect of pooling servers.
the rules in Model 2, that is, small-buying customers always use the express checkout lanes and large-buying customers use the regular checkout lanes. This may not be realistic, but still raises no problem to analyze the effect of separated checkout lanes. To sum up, the models in this study do not reflect all the complicated situations in reality, but there is no problem for giving us an insight on whether and when the express checkout lanes can be effective. How the results may change if the complex reality is reflected in the models merits some valuable future studies.
AUTHOR BIOGRAPHY
Jin Kyung Kwak graduated from Seoul National University in South Korea, majoring in Business Administration and obtained the bachelor’s and master’s degrees. She got her Ph.D. from Cornell University in Ithaca, New York. Her research interests lie in the supply chain management area. Since 2012, she has been an assistant professor in Ewha School of Business in South Korea. E-mail: [email protected]
REFERENCES
Anic, I.D., Radas, S. & Miller, J.C. (2011), Antecedents of consumers’ time perceptions in a hypermarket retailer. The Service Industries Journal, 31(5), 809-828.
Bielen, F. & Demoulin, N. (2007). Waiting time influence on the satisfaction-loyalty relationship in services. Managing Service Quality, 17(2), 174-193.
Cachon, G. & Terwiesch, C. (2009). Matching Supply with Demand: An Introduction to Operations Management. McGraw-Hill Irwin 2nd edition, 148-151.
Chain Store Age (2008). Don't keep 'em waiting, 20.
Dabholkar, P.A., Bobbit, L.M. & Lee, E. (2003). Understanding consumer motivation and behavior related to self-scanning in retailing. International Journal of Service Industry Management, 14(1), 59-95.
Davidson, D. (1978). Checking out the hidden agenda. Interfaces, 8(3), 29-31.
Davis, M.M. & Heineke, J. (1998). How disconfirmation, perception and actual waiting times impact customer satisfaction. International Journal of Service Industry Management, 9(1), 64-73.
Davis, M.M. & Vollmann. T.E. (1990). A framework for relating waiting time and customer satisfaction in a service operation. The Journal of Service Marketing, 4(1), 61-69.
Dean, D.H. (2008). Shopper age and the use of self-service technologies. Managing Service Quality, 18(3), 225-238. Marzocchi, G. & Zammit, A. (2006). Self-scanning technologies in retail: determinants of adoption. The Service Industries
Journal, 26(6), 651-669.
Miranda, M.J. (2008). Determinants of shoppers’ checkout behavior at supermarket. Journal of Targeting, Measurement, & Analysis for Marketing,16(4), 312-321.
Natural Foods Merchandiser. (2007). Satisfaction wanes with long checkout lanes. 28(7), 16.
Schimmel, M. (2013). Deployment of express checkout lines at supermarkets. Research paper Business Analytics, VRIJE Universiteit Amsterdam, Netherlands.
Talyor, S. (1994). Waiting for service: The relationship between delays and evaluations of service. Journal of Marketing, 58(2), 56-69.