Effect Of Nanofluids On The Performance Of
Corrugated Channel Within Out-Of-Phase
Arrangement
Dr Hassan Majdi, Azher M. AbedABSTRACT: Numerical investigations in the channel with lower and upper corrugated plate under constant heat flux conditions using nonafluids are carried out. CFD model by a finite volume method (FVM) with the structured uniform grid system is employed to solve the continuity, momentum and energy equations. The flow and heat transfer developments are simulated by using the k- standard turbulent model. The corrugated plates with corrugated tilt angle of 60 are tested with the height of the channel of 17.5 mm and wavy height of 2.5 mm. The model was simulated for the Reynolds number in the range of 5000 -20000. Studies are carried out for nanoparticles with different volume fractions in the range of 0%-4% and different nanoparticles diameters in the range of 20-80 nm. The results show that the heat transfer enhancement increased by using nonafluids as working fluid. The nanofluid with has the highest Nusselt number compared with base fluid . It is found that the average Nusselt number increased with the increase of volume fraction of the nanoparticles and Reynolds number, accompanied by a slight increase in pressure drop. It is found that with the decrease of nanoparticle diameter the Nusselt number increased for - water. Therefore, the nonafluids has a significant effect on the performance of heat transfer in the corrugated plate.
Keywords: Plate heat exchanger, Nanofluid, FVM,Nusselt number
————————————————————
1.
INTRODUCTION
Increasing the demand for smaller and lightest high-performance devices drives for more efforts to optimize their heat and mass transfer characteristics. Traditional heat transfer fluids have inherently poor thermal conductivities. Many researchers have reported numerical and experimental studies on the thermal conductivity of nanoflu ds as presented below [1] measured the thermal conduct v ty of (EG) based nanoflu d conta n ng Zn . To max m ze the heat transfer effic ency w th a smooth flow, the viscosity as well as the thermal conductivity should be cons dered as mportant phys cal propert es of a nanoflu d.
[2-4] measured the thermal conduct v ty of nanoflu ds
containing l and CuO nanoparticles. Their results show that the thermal conduct v ty of the nanoflu ds increased with increasing volume fraction of the nanoparticles . [5, 6] investigated experimentally the relative effects of four types of nanoflu ds conta n ng l ,CuO, and Zn d spersed n a base flu d of 60:40 (by mass) ethylene glycol and water mixture.
Apart from various works on the corrugated channels to enhance heat transfer process,[7-13] Their results concluded that the use of nanoflu ds n plate heat exchanges can lead to size reductions of the overall system and more effic ent use of the heat transfer flu ds. The above survey; the numerous experimental and theoretical studies have been reported concerning the heat transfer enhancement using nanofluids in the CPHE. However, no data reported on thermal and flow field in the corrugated channel within out-of-phase arrangement using nanofluids. The objective of this paper is to numerical investigation in the corrugated channel with V- corrugated channel using different type of nanofluids.
2.
Mathematical Modeling
2.1 Physical Model and Assumptions
The schematic diagram of the present problem is shown in
Fig.1 which consisted of a two symmetric corrugated plate. The wall of the channel is composed of a flat wall and a corrugated wall. The length of each adiabatic flat section before, and after the corrugated section is 100 - 200 mm.
2.2 Governing Equations
By considering the geometry and physical problem as shown in Fig.1, the k-ε standard turbulence model [14, 15]is used to simulate the turbulent heat transfer and flow characteristics. The main governing equations [14, 15] can be written in the following form:
Continuity equation:
t d v 0
For an ncompress ble flu d ( .e. a l qu d) the dens ty s constant and equation (3.1) becomes [16].
d v 0
_______________________
Dr Hassan Majdi, Azher M. Abed
Department of Air conditioning and Refrigeration,
Al-Mustaqbal University College
Solar Energy Research Institute, Universiti
Kebangsaan Malaysia (UKM), Locked Bag No: 320, 43600 Bangi, Selangor, Malaysia
Momentum equation:
X-Momentum: u t
p
x d v gradu Y-Momentum: v t py d v gradv y 4 Where P s the pressure (Pa), the v scos ty (Pa s) and and y the source term in the x and y direction.
Energy equation:
t pd v d v gradT + where
t
= (
)/ε
0.0 ,
ε.4 ,
ε. ,
.0,
ε.
2.3 Methods of Calculation
In the present study, the solution of the governing equations of pressure drop, wall shear stress, friction factor, turbulence intensity ,average heat transfer rate, average Nusselt number , effective density , heat capacity and the effective thermal conduct v ty of the nanoflu d .The methods of calculations for the mentioned terms, as [17], Defined and derived, are locally presented hereinafter, but together with our assumptions and simplifications: The average heat transfer coefficient along the corrugated channel hc can be calculated from the average heat transfer rate obtained from
[18]:
ave hc c T ( .6 )
where c is the surface area of the corrugated plate. The average heat transfer coefficient is presented in terms of average Nusselt number [18]as follows:
( . )
where is the half distance of the channel height, k is the thermal conductivity of liquid , cis the distance from the leading edge of the corrugated plate to the end of the domain , and is the distance from the leading edge of the corrugated plate along the corrugated surface as shown in
Fig.1. The local heat transfer h(x) is defined as :
h(x) = - (2.8)
q represents the heat flux, Ts(x) and Tb(x) are the local surface wall and bulk temperatures, respectively. At the corrugated channel section, the inlet water temperature was taken as 300 K and the inlet water velocity was calculated using :
u n e h
( . )
The hydraulic diameter is computed as [8]:
h 4
P m n max
( . 0)
Where Hmin and Hmax are the height of the lower and the upper corrugated channel as shown in Fig.1. The friction factor is defined as [19]:
f 4 fx ( . )
The Fanning friction factor is defined as follows:
fx = s u n (2.13)
sis wall shear stress. The pressure drop for the flow in the corrugated channel is computed as [19]:
p f c u n
h ( . 4 )
Turbulence intensity is the ratio of the root mean square of the turbulent velocity fluctuation at a particular location of the average of the velocity at the same location. It can be expressed as follows:
u u 00
( . )
where ,
u: The turbulence velocity
2.4 Properties of nanofluids
The effect ve dens ty and heat capac ty of the nanoflu d at the reference temperature (T0 is determined from the following equations [20]:
nf f p ( . 6)
Where f and nf are the mass densities of the based fluid and the solid nanoparticles, respectively.
p nf ( p)f ( p)p ( . )
Where ( p)f and ( p)pare heat capacities of the based fluid and the solid nanoparticles, respectively. By using Brownian motion of nanoparticles in corrugated channel, the effective thermal conductivity can be obtained by using the following mean empirical correlation [5, 6]:
eff stat c rwn an (2.18)
stat c f
p f f p p f f p
(2.18.1)
rown an 04 f p,f T p dp
f(T, (2.18.2)
Where:
Values of for d fferent part cles are l sted n Table Modelling, f(T, ), For ≤ ≤ 4 and 00 T 325K. The effective viscosity can be obtained by using the following mean empirical correlation [20]:
M: is the molecular weight of base fluid., N: is the Avogadro number = 6.022*1023 mol-1, f: is the mass density of the based fluid calculated at temperature To=293K
2.5 Boundary Conditions
In this study, no slip and constant heat flux boundary conditions are applied on the test section as follows:
At the wall
u 0 , v 0 , q qwall ( . )
where, uandv are the velocities.
Initial conditions:
At the inlet, the uniform profiles for all the properties are as follows:
u u n v 0 T T n n ε ε n ( . ) At the outlet, the flow may safely be assumed as fully developed, which implies negligible stream wise gradients of all variables.
( . )
2.6 Numerical Computation
In order to simulate and compute the detailed fluid flow characteristics of the corrugated channel problem, a commercial CFD code, namely GAMBIT 2.0 and FLUENT 6.3 software package, were employed. The fluid flow governing equations is solved by using the finite volume method It is based on the control volume method, SIMPLEC algorithm of Versteeg and Malalasekera [15] is used to deal with the problem of velocity and pressure coupling. Second – order upwind scheme and structure uniform grid system are employed to discretize the main governing equation as shown in Fig.2. The solutions are considered to be converted when the normalized residual values reach 0 ) for all variables.
2.7 Code Validations and Grid Testing
Fig.3 shows the average corrugated plate temperature for air flow through two opposite corrugated plats is calculated and compared with a numerical and experimental study of Naphon [18]. It is observed that the results are in good agreement. To achieve the goal of having a near-wall
modeling approach that will possess the accuracy of the standard two-layer approach for fine near-wall meshes and that, at the same time, will not significantly reduce the accuracy for wall-function meshes, four different meshes were tested, to evaluate the number of elements required. To test the grid independence, the grid sizes 24000, 34000, 48000 and 88000. It is found that after 48000 cells, further increase in cells gives less than 2% variation in average Nusselt number value which is taken as a criterion for grid independence.
3.
Results and Discussion
3.1 Effect of Nanoparticles
In this section, the type of nanoparticle which is, and and pure water as a base fluid are used. The Nusselt number for nanofluids at wavy angle =60°, wavy height =2.5 mm, channel height =17.5 mm and different Reynolds numbers are shown in Fig. 4. It is seen that the nonafluids possess a higher Nusselt number compared to pure water. This is due to that the fluid velocity plays significant role on heat transfer, as the fluids move through the channel and having the highest average velocity, due to lowest density than base fluid [21]. The effect of nanofluids on the pressure drop is shown in Fig.5. The nanoparticle concentration considered is 4% for different Reynolds numbers. It can be seen that the nanofluids has the highest pressure drop. This is due to that the lower mean velocity gives the lower velocity gradient among the fluids, which in turn reduces the wall shear stress. The reduced friction results in lower pressure difference required to move the fluid along the channels, which is indicated by the pressure drop values [21].
3.2 The Effect of Different Nanoparticles Volume Fractions
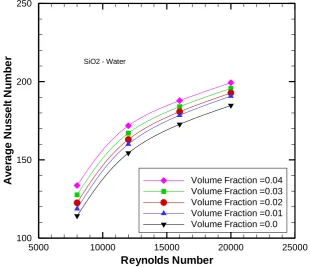
Fig.6 illustrates the effects of nanoparticle and volume
fraction on Nusselt number. It demonstrates that adding a low volume fraction of nanoparticle (0.01-0.04) with particle diameter of 20 nm for to the base fluid leads to significant increase in Nusselt number. The higher mass concentrations of nanoparticles compared to the base fluid molecules have higher momentum, this momentum carry and transfer thermal energy more efficiently at greater distance within the base fluid before releasing the thermal energy in colder regions of the fluid [13].It can be seen that the Nusselt number increases with increased value of volume fraction. As indicated in the Fig.7 the results show that the pressure drop of the – water increases with the increase of Reynolds number and nanoparticle concentration. With an increase in the particle volumetric concentration in the nanofluids the density and viscosity increase and hence they cause an increased pressure drop
[6]. Fig.8 illustrates that the increasing volume fraction of nanoparticles, which is responsible for large heat transfer performance leads to higher pressure drop. It should be noted that the enhancement in heat transfer increases with the increase of volume fraction of nanoparticles at the same value of the Reynolds number. It can be seen that for the same value of the volume fraction the heat transfer enhancement decreases slightly as the Reynolds number increases. Fig.9 gives the streamlines and isotherms contours for nanoflu d flow n a wavy channel at w f T, . 0 . 0 T
T0
.066 0 . 0
( .
eff f ( 4. ( d
p df) 0. .0 )
df 6 f
2.5, 60 , Re=16000 and dp= 20 nm for different volume fraction. The streamlines show that there is such appreciable change in flow pattern for a particular Re with increase the volume fraction.
3.3 The Effect of Different Nanoparticles Diameters
The working fluid – water is used to study the effect of nanoparticles diameters on the Nusselt number. The range of nanoparticles diameter used is 20-70 nm, volume fraction of 4% with different Reynolds numbers. As illustrated in Fig.10, for – Water nanofluid, decreasing the particle diameter leads to a higher Nusselt number. This is due aggregation of nanoparticles and stronger Brownian motion at smaller nano-particles diameters, which leads to higher thermal conductivity of nanofluids [13]].Similar trends of enhancement in Nusselt number by decreasing the particle diameter was obtained from [22].As indicated in the Fig.11, the results show that the pressure drop of the – water increases with the increase of Reynolds number. It can be seen that the pressure drop increases with the decrease of nanoparticle diameters. This is due to the decrement of viscosity as the practical diameter increased for the same volume fraction. This observation is consistent with that presented by Vajjha [6].
4.
Conclusions
In this paper, heat transfer enhancement and pressure drop due to flow nanofluids flowing in a corrugated channel under constant heat flux boundary condition are studied numerically for a range of Reynolds number of 8000 -20000, nanoparticle volume fraction varying from 0 to 0.04 and nanoparticles diameters varying from of 20-80 nm .The effects of nanoparticle types, nanoparticle concentration ( , nanoparticles diameter (dp) and type of base fluid on the thermal and hydraulic behavior of CPHE were examined. The results indicate that the gives the highest Nusselt number and pressure drop, while the pure water gives the lowest Nusselt number and pressure drop. It is also shown that the Nusselt number and pressure drop increased by increasing the nanoparticle volume fractions. The study noted that the Nusselt number increased with decreasing the nanoparticle diameter. In the cases examined, the highest enhancement in heat transfer was found at Reynolds number of 8000, nanoparticle volume fraction of 4%, and nanoparticle diameter of 20nm with an enhancement of around 18 % over the base fluid.
5-
.
References
[1]. Lee, G.-J., et al., Thermal conductivity enhancement of ZnO nanofluid using a one-step physical method. Thermochimica Acta, 2012. 542: p. 24-27.
[2]. H. Xie, et al., Thermal Conductivity Enhancement of Suspensions Containing Nanosized Alumina Particles. International Journal of Applied Physics, 2002. 91: p. 4568–72.
[3]. X. Wang, X.Xu, and S.U.S. Choi, Thermal Conductivity of Nanoparticle–Fluid Mixture. International Journal of Thermo Physic Heat Transfer, 1999. 13: p. 474–80.
[4]. S.K.Das, et al., Temperature Dependence of Thermal onduct v ty Enhancement for anoflu ds. ASME Journal of Heat Transfer, 2003. 125: p. 567–74.
[5]. Vajjha, R.S. and D.K. Das, Experimental determination of thermal conductivity of three nanofluids and development of new correlations. International Journal of Heat and Mass Transfer, 2009. 52(21-22): p. 4675-4682.
[6]. Vajjha, R.S., D.K. Das, and D.P. Kulkarni, Development of new correlations for convective heat transfer and friction factor in turbulent regime for nanofluids. International Journal of Heat and Mass Transfer, 2010. 53(21-22): p. 4607-4618.
[7]. Ahmed, M.A., N.H. Shuaib, and M.Z. Yusoff, Numerical investigations on the heat transfer enhancement in a wavy channel using nanofluid. International Journal of Heat and Mass Transfer, 2012. 55(21-22): p. 5891-5898.
[8]. Ahmed, M.A., et al., Numerical investigations of flow and heat transfer enhancement in a corrugated channel using nanofluid. International Communications in Heat and Mass Transfer, 2011. 38(10): p. 1368-1375.
[9]. Heidary, H. and M.J. Kermani, Effect of nano-particles on forced convection in sinusoidal-wall channel. International Communications in Heat and Mass Transfer, 2010. 37(10): p. 1520-1527.
[10]. Pandey, S.D. and V.K. Nema, Experimental analysis of heat transfer and friction factor of nanofluid as a coolant in a corrugated plate heat exchanger. Experimental Thermal and Fluid Science, 2012. 38: p. 248-256.
[11]. Pantzali, M.N., A.A. Mouza, and S.V. Paras, Investigating the efficacy of nanofluids as coolants in plate heat exchangers (PHE). Chemical Engineering Science, 2009. 64(14): p. 3290-3300.
[12]. Santra, A.K., S. Sen, and N. Chakraborty, Study of heat transfer due to laminar flow of copper–water nanofluid through two isothermally heated parallel plates. International Journal of Thermal Sciences, 2009. 48(2): p. 391-400.
[13]. Seyf, H.R. and M. Feizbakhshi, Computational analysis of nanofluid effects on convective heat transfer enhancement of micro-pin-fin heat sinks. International Journal of Thermal Sciences, 2012. 58: p. 168-179.
[15]. H.K.Versteeg , W.M., An Introduction to Computational Fluid Dynamics 1995. : Longman Group.
[16]. J.Koo and C. Kleinstreuer, Viscous Dissipation Effects in Microtubes and Microchannels. International Journal of Heat and Mass Transfer, 2004. 47: p. 3159-3169.
[17]. Mohammed, H.A., A.M. Abed, and M.A. Wahid, The effects of geometrical parameters of a corrugated channel with in out-of-phase arrangement. International Communications in Heat and Mass Transfer, 2013. 40: p. 47-57.
[18]. Naphon, P., Effect of corrugated plates in an in-phase arrangement on the heat transfer and flow developments. International Journal of Heat and Mass Transfer, 2008. 51(15-16): p. 3963-3971.
[19]. F.P, I. and D. P.Dewitt, Fundamentals of Heat and Mass Transfer Vol. 5th Editions, . 2002: John Wiley & Sons,Inc.
[20]. Corcione, M., Heat Transfer Features of Buoyancy-Driven Nanofluids Inside Rectangular Enclosures Differentially Heated at the Sidewalls International Journal of Thermal Sciences, 2010. 49: p. 1536-1546.
[21]. H.A.Mohammed, et al., Numerical Study of Heat Transfer Enhancement of Counter Nanofluids in Rectangular Microchannel Heat Exchanger Superlattices and Microstructures, 2011. 50: p. 215-233.
[22]. Seyf, H.R. and B. Nikaaein, Analysis of Brownian motion and particle size effects on the thermal behavior and cooling performance of microchannel heat sinks. International Journal of Thermal Sciences, 2012. 58: p. 36-44.
Hw
Lc
Velocity Inlet Hmax Hmin Outlet
adiabatic wall
adiabatic wall
Heat flux Heat flux
Fig. 1: Schematic Diagram of the Corrugated Channel.
Fig.3: Comparison of the Average Corrugated Plate Temperature of the Present Study with the Results of Naphon [18] for Different Reynolds Numbers.
Fig.4: Nusselt Number for Channel with Different Nanofluids Types at Different Reynolds Number.
Reynolds Number
A
v
e
ra
g
e
C
o
rr
u
g
a
te
d
P
la
te
T
e
m
p
e
ra
tu
re
(c
°)
600 800 1000 1200 1400 1600
0 20 40 60 80 100
wavy angle (40°) Naphon wavy angle (40°) Present study Heat Flux = 1.08 kW/m2
Reylonds Number
A
v
e
ra
g
e
N
u
s
s
e
lt
N
u
m
b
e
r
5000 10000 15000 20000 25000
100 150 200 250
SiO2-Water Water Volume fraction =0.04
Nanoparticle diameter =20 nm
Fig. 5: Pressure Drop at Various Nanoparticles Types with Particle Volume Concentration of 4% for Different Reynolds Number.
Fig. 6: Effect of Volume Fraction on the Nusselt Number at Various Reynolds Numbers.
Reynolds Number
P
re
s
s
u
re
D
ro
p
(
p
a
)
5000 10000 15000 20000 25000
0 25 50 75 100 125 150
SiO2-Water Water
Volume fraction =0.04 Nanoparticle diameter =20 nm
Reynolds Number
A
v
e
ra
g
e
N
u
s
s
e
lt
N
u
m
b
e
r
5000 10000 15000 20000 25000
100 150 200 250
Volume Fraction =0.04 Volume Fraction =0.03 Volume Fraction =0.02 Volume Fraction =0.01 Volume Fraction =0.0
SiO2 - Water
Fig.7: Pressure Drop of the Nanofluids at Various Particle Volume Concentrations as a Function of the Reynolds Number.
Fig .8: Average Nusselt Number Enhancement Versus Reynolds Number for Different Nanoparticle Concentrations .
Reynolds Number
P
re
s
s
u
re
D
ro
p
(
p
a
)
50000 10000 15000 20000 25000
25 50 75 100 125 150
Volume fraction = 0.04 Volume fraction = 0.03 Volume fraction = 0.02 Volume fraction = 0.01 Volume fraction = 0.0
SiO2-Water
Reynolds Number
A
v
e
ra
g
e
N
u
s
s
e
lt
N
u
m
b
e
r
E
n
h
a
n
c
e
m
e
n
t
(%
)
5000 10000 15000 20000 25000
0 5 10 15 20 25 30
Volume fraction = 0.04 Volume fraction = 0.03 Volume fraction = 0.02 Volume fraction = 0.01
Fig.9: Streamlines (left) and Isotherms (right) Contours for Different Volume Fraction at, dp=20 nm and Re=16000 Contours of Stream Function (kg/s)
FLUENT 6.3 (2d, dp, pbns, ske) Jul 07, 2012
4.95e+00 4.70e+00 4.45e+00 4.20e+00 3.96e+00 3.71e+00 3.46e+00 3.21e+00 2.97e+00 2.72e+00 2.47e+00 2.23e+00 1.98e+00 1.73e+00 1.48e+00 1.24e+00 9.89e-01 7.42e-01 4.95e-01 2.47e-01 0.00e+00
Contours of Static Temperature (k)
FLUENT 6.3 (2d, dp, pbns, ske) Jul 07, 2012
3.00e+02 3.00e+02 3.00e+02 3.00e+02 3.00e+02 3.00e+02 3.00e+02 3.00e+02 3.00e+02 3.00e+02 3.00e+02 3.00e+02 3.00e+02 3.00e+02 3.00e+02 3.00e+02 3.00e+02 3.00e+02 3.00e+02 3.00e+02 3.00e+02
Contours of Stream Function (kg/s)
FLUENT 6.3 (2d, dp, pbns, ske) Jul 07, 2012
5.45e+00 5.18e+00 4.91e+00 4.64e+00 4.36e+00 4.09e+00 3.82e+00 3.55e+00 3.27e+00 3.00e+00 2.73e+00 2.45e+00 2.18e+00 1.91e+00 1.64e+00 1.36e+00 1.09e+00 8.18e-01 5.45e-01 2.73e-01 0.00e+00
Contours of Static Temperature (k)
FLUENT 6.3 (2d, dp, pbns, ske) Jul 07, 2012
3.00e+02 3.00e+02 3.00e+02 3.00e+02 3.00e+02 3.00e+02 3.00e+02 3.00e+02 3.00e+02 3.00e+02 3.00e+02 3.00e+02 3.00e+02 3.00e+02 3.00e+02 3.00e+02 3.00e+02 3.00e+02 3.00e+02 3.00e+02 3.00e+02
Contours of Stream Function (kg/s)
FLUENT 6.3 (2d, dp, pbns, ske) Jul 07, 2012
6.10e+00 5.80e+00 5.49e+00 5.19e+00 4.88e+00 4.58e+00 4.27e+00 3.97e+00 3.66e+00 3.36e+00 3.05e+00 2.75e+00 2.44e+00 2.14e+00 1.83e+00 1.53e+00 1.22e+00 9.16e-01 6.10e-01 3.05e-01 0.00e+00
Contours of Static Temperature (k)
FLUENT 6.3 (2d, dp, pbns, ske) Jul 07, 2012
3.00e+02 3.00e+02 3.00e+02 3.00e+02 3.00e+02 3.00e+02 3.00e+02 3.00e+02 3.00e+02 3.00e+02 3.00e+02 3.00e+02 3.00e+02 3.00e+02 3.00e+02 3.00e+02 3.00e+02 3.00e+02 3.00e+02 3.00e+02 3.00e+02
Contours of Stream Function (kg/s)
FLUENT 6.3 (2d, dp, pbns, ske) Jul 07, 2012 6.95e+00 6.60e+00 6.25e+00 5.91e+00 5.56e+00 5.21e+00 4.86e+00 4.52e+00 4.17e+00 3.82e+00 3.47e+00 3.13e+00 2.78e+00 2.43e+00 2.08e+00 1.74e+00 1.39e+00 1.04e+00 6.95e-01 3.47e-01 0.00e+00
Contours of Static Temperature (k)
FLUENT 6.3 (2d, dp, pbns, ske) Jul 07, 2012 3.00e+02 3.00e+02 3.00e+02 3.00e+02 3.00e+02 3.00e+02 3.00e+02 3.00e+02 3.00e+02 3.00e+02 3.00e+02 3.00e+02 3.00e+02 3.00e+02 3.00e+02 3.00e+02 3.00e+02 3.00e+02 3.00e+02 3.00e+02 3.00e+02
Contours of Stream Function (kg/s)
FLUENT 6.3 (2d, dp, pbns, ske) Jul 07, 2012
8.07e+00 7.67e+00 7.27e+00 6.86e+00 6.46e+00 6.06e+00 5.65e+00 5.25e+00 4.84e+00 4.44e+00 4.04e+00 3.63e+00 3.23e+00 2.83e+00 2.42e+00 2.02e+00 1.61e+00 1.21e+00 8.07e-01 4.04e-01 0.00e+00
Contours of Static Temperature (k)
FLUENT 6.3 (2d, dp, pbns, ske) Jul 07, 2012
Fig.10: Average Nusselt Number Versus Reynolds Number of Different Nanoparticle Diameters.
Fig.11: Pressure Drop Versus Different Nanoparticle Diameters of Different Reynolds Number.
Reynolds Number
A
v
e
ra
g
e
N
u
s
s
e
lt
N
u
m
b
e
r
5000 10000 15000 20000 25000
100 150 200 250
dp =20 nm dp=40 nm dp=55 nm dp=70 nm SiO2-Water
Volume fraction =4%
Nanoparticles diameter
P
re
s
s
u
re
d
ro
p
(P
a
)
10 20 30 40 50 60 70 80
0 25 50 75 100 125 150
Re=20000 Re=16000 Re=12000 Re=8000 SiO2-water
volume fraction = 4%