R E S E A R C H
Open Access
Frail older adults with minor fractures show
lower health-related quality of life (SF-12)
scores up to six months following
emergency department discharge
Véronique Provencher
1*, Marie-Josée Sirois
2, Marcel Émond
2, Jeffrey J. Perry
3, Raoul Daoust
4, Jacques S. Lee
5,
Lauren E. Griffith
6, Brice Lionel Batomen Kuimi
2, Litz Rony Despeignes
2, Laura Wilding
3, Vanessa Fillion
2,
Nadine Allain-Boulé
2, Johan Lebon
2and On behalf of the Canadian Emergency Team Initiative on Mobility in
Aging
Abstract
Background:Minor fractures (e.g. wrist, ankle) are risk factors for lower physical health-related quality of life (HRQoL) in seniors. Recent studies found that measures of frailty were associated with decreased physical and mental HRQoL in older people. As most people with minor fractures go to emergency departments (EDs) for treatment, measuring their frailty status in EDs may help stratify their level of HRQoL post-injury and provide them with appropriate health care and services after discharge. This study thus examines the HRQoL of seniors visiting EDs for minor fractures at 3 and 6 months after discharge, according to their frailty status.
Methods:This prospective sub-study was conducted within the larger Canadian Emergency Team Initiative (CETI) cohort. Independent seniors (≥65 years) were recruited in 7 Canadian EDs after treatment for various minor fractures. Frailty status in the ED phase was assessed by theCanadian Study of Health and Aging–Clinical Frailty Scale(CSHA-CFS). The SF-12 questionnaire was completed at 3 and 6 months after ED discharge to ascertain HRQoL. Demographic and clinical data were collected. Linear mixed models were used to test for differences between frailty levels and HRQoL outcomes, controlling for confounding variables and repeated measures over time.
Results:The sample comprised 334 participants with minor fractures. Prevalence of frailty was as follows: 56.6 %very fit-well; 32.3 %well with treated comorbidities-apparently vulnerable; and 11.1 %mildly-moderately frail. After adjusting for confounding variables, the frailest group showed significantly lower mean HRQoL scores than the fittest group on the physical scale at 3 months (49.3 ± 3.7vs60.9 ± 2.0) and 6 months (48.7 ± 3.8vs61.1 ± 1.8), as well as on the mental scale at 3 months (59.5 ± 4.4vs69.6 ± 1.9). Analyses exploring differences in proportion of patients with HRQoL < 50/100 between the three groups produced similar results.
Conclusions:Older adults with minor fractures who were frail had lower physical and mental HRQoL scores at 3 and 6 months after ED discharge than their fittest counterparts. Measuring the frailty status of older adults who suffered a minor fracture in ED might help clinical decision-making at the time of discharge by providing them with appropriate health care and services to improve their HRQoL in the following months.
Keywords:Frail elderly, Health-related quality of life, Minor fractures, Emergency department, Geriatric assessment
* Correspondence:veronique.provencher@usherbrooke.ca
1Université de Sherbrooke, and Centre de recherche sur le vieillissement, Sherbrooke, QC, Canada
Full list of author information is available at the end of the article
Background
Older adults account for an increasing proportion of visits to North American emergency departments (EDs) [1, 2]. Fractures are the most common reason (41 %) for injurious fall-related ED visits by seniors [3]. About half (49 %) of these fractures can be considered “minor” as they do not result in hospital admission [3]. As most seniors with injuries like minor fractures return home following their ED visit [4], it is important to ensure that they receive the appropriate healthcare to optimize their health-related quality of life (HRQoL) after ED discharge.
The concept of HRQoL can be defined as aspects of quality of life that are influenced by, or that can influence, one’s health status directly [5]. The Short Form-12 Health Survey (SF-12) is one of the most frequently used generic tools for assessing the physical and mental components of a person’s HRQoL [6]. A cross-sectional study done by Sanfélix et al. [7] revealed that the physical dimension of HRQoL, measured with the SF-12, was significantly lower in older adults having suffered a minor fracture (spine or wrist), compared to their uninjured counterparts. In one of the few studies to investigate the evolution of HRQoL in patients with a minor fracture (wrist) following ED dis-charge, Gonzalez et al. (2014) [8] found that the physical dimension of the SF-12 deteriorated up to 6 months after the injury, especially in older women. However, little is known about the characteristics of older adults who show poorer HRQoL following a minor fracture. It is thus essential to identify those seniors so that appropriate healthcare and community-based services may be pro-vided following their ED visits.
One hypothesis is that older adults with minor fractures who demonstrate poorer HRQoL following ED visits are in a frail state. Frailty refers to a state of increased vulner-ability to stressors, leading to higher risks for adverse outcomes such as falls and fractures [9], as well as dis-ability, hospitalization and mortality. Recently, several cross-sectional studies [10–13] reported worse HRQoL measures in frail community-dwelling adults than in non-frail ones. This association was also found in a recent prospective study by Bagshaw [14] with a sample of survivors of critical illness, among whom frail individ-uals showed lower physical and mental HRQoL in the year after discharge from an intensive care unit, compared to their non-frail counterparts. Based on these previous studies conducted in other settings and on other popula-tions, we expected that measuring the frailty status of older adults who suffered a minor fracture before ED discharge might help to stratify their level of HRQoL post-injury and improve clinical decision-making at dis-charge by implementing a healthcare approach tailored to the specific needs of these patients. Targeting these patients in ED may thus help to provide them with
appropriate health care and services upon returning home, as some community-based interventions [15] and virtual ward program [16] recently showed promising results to improve HRQoL in frail older adults. To our knowledge, no previous study has documented the prospective relationship between frailty and HRQoL among ED patients treated for minor fractures. This study thus aimed to compare the HRQoL measures of seniors visiting EDs for minor fractures, according to their frailty status.
Methods
Study design and population
This prospective sub-study was conducted within the lar-ger Canadian Emergency Team Initiative (CETI) research program on mobility and aging, aimed at improving ED care for independent seniors with minor injuries (http:// www.cha.quebec.qc.ca/ceti/). Data for the current study were collected over 2 years between March 2011 and March 2013 in 7 EDs in 5 Canadian cities (Quebec, Montreal, Ottawa, Toronto and Hamilton). Clinicians and/or research assistants identified and screened con-secutive potential participants (24/7). Participants were included in the study if they: 1) were aged 65 years or older; 2) presented to the ED with the chief complaint being a minor fracture (bone lesions of lower or upper limbs, head, chest or spine); 3) were independent in Basic Activities of Daily Living (BADL) in the 4 weeks preceding the injury, based on the Older Americans Resources and Services (OARS) [17] questionnaire; and 4) were sent home. Patients were excluded if they: 1) presented with significant injuries leading to hospitalization; 2) were unable to give verbal consent or attend follow-up eval-uations; 3) resided in long-term care facilities pre-trauma; or 4) were unable to communicate in French or English.
Data collection procedure
Demographic and clinical data were collected by trained research assistants during initial evaluation and follow-ups (at 3 and 6 months), except for the medical informa-tion pertaining to the fractures, which was documented by the treating physicians during the ED visit. For about 30 % of the sample (randomly selected participants), data pertaining to HRQoL were collected through in-person assessments at 3 and 6 months at the different centers. For the remaining participants, phone interviews were conducted. The frailty status assessments for all partici-pants were performed in-person by the treating physicians during the initial ED visit.
were maintained through regular telephone and in-person team meetings.
The study was approved by the research ethics board of each recruiting site and written informed consent was obtained from study participants.
Variables and outcomes
Frailty status was assessed by the Canadian Study of Health and Aging–Clinical Frailty Scale (CSHA-CFS) [18]. This tool is based on the judgment of clinicians and has been validated in a population-based study of Canadian seniors. It classifies older adults as very fit (level 1), well (level 2), well with treated comorbidities (level 3), apparently vulnerable (level 4), mildly frail (level 5), moderately frail (level 6) or severely frail (level 7). In the present study, participants were classi-fied according to three frailty status:very fit-well(level 1–2); well with treated comorbidities-apparently vul-nerable (level 3–4); and mildly to severely frail (level 5–7). To make this article easier to read, these three groups are referred to as: 1) fit, 2) vulnerable, and 3) frail.
Health-related quality of life was determined using the SF-12 [19]. This tool has been shown to be a reliable and valid measure of health status in older adults living independently [20]. The SF-12 is a brief, widely used questionnaire, which consists of 12 questions covering 8 health domains: general health, mental health, vitality, social functioning, role limitation due to physical health problems, role limitation due to emotional problems, bod-ily pain limiting usual activities, and physical functioning. These domains can be summarized in a Physical Compo-nent Summary scale (PCS) and Mental CompoCompo-nent Summary scale (MCS), ranging from 0 (worst) to 100 (best) score. A score of 50 or more indicates positive self-rated health, while a score below 50 indicates a negative perception [8].
Potential confounding demographic and clinical var-iables considered in this study were measured at base-line. Age, gender, schooling (<12 years), living alone (without help), ED visits in the last 3 months, falls in the last 3 months, number of comorbidities (catego-rized in 0–4 and 5–13), number of outings/week (<5) and occasional use of a walking aid (yes/no) were col-lected through self-reported interview. Types, loca-tions, and severity of each fracture as well as co-occurring injuries were coded by trained professional according to the 2005 revision of the Abbreviated In-jury Scale(AIS) [21]. AIS severity codes from 1(minor) to 6 (maximum) were used to compute the aggregated Injury Severity Scores (ISS) which ranges from 1 (minor) to 75 (unsurvivable) [22, 23]. Self-reported pain intensity was measured by 0 to 10 Visual Analog
Scale [24]. Basic (BADL) and instrumental activities of daily living (IADL) scores were measured by theOlder American Resources Scale (OARS)[25]. The OARS has been widely validated and shows good test-retest reli-ability [26]. Fall efficacy (fear of falling) was measured by the Short Falls Efficacy Scale-International (short FES-I) [27] which has excellent test-retest reliability. Cognitive status was measured by theMontreal Cogni-tive Assessment (MoCA) [28] or the modified Tele-phone Interview for Cognitive Status (TICS-m) [29]. The MoCA is a brief, reliable and sensitive to decline in cognitive function [28]. The TICS-m is useful an economical alternative to standard in-person screen-ing for population studies [29, 30]. Social support was measured by the Social support index (SSI) from Qué-bec Health Surveys[31]. It measures both quantity and satisfaction with available support. It has been vali-dated in the general population of the province of Québec in both French and English and norms are available (a higher score indicates lower support) [31]. All the variables mentioned above were selected based on their clinical relevance and correlation with the main variables [8, 32]. Cut-offs for potential covariates were published clinical cut-offs when available (e.g. FES-I, MoCA, TICS-m, SSI) or those found out to be the most predictive of post-injury functional decline in a recent study (e.g. education, number of outings, pain) [33].
Statistical analysis
Descriptive analyses were performed to characterize the sample. Simple linear mixed models were used to ex-plore differences in HRQoL between the three groups (frail, vulnerable, fit) at 3 and 6 months. This type of analysis accounts for within-subject correlation among repeated measures.
proportions (RP) of patients with a HRQoL < 50/100 between the three groups (frail, vulnerable, fit) at 3 months and 6 months were calculated. These ana-lyses were conducted using a general estimating equa-tions approach. All analyses were performed with PROC MIXED and GENMOD using SAS 9.4 (SAS Institute Inc., Cary, NC).
Results
A total of 428 participants who had suffered a minor fracture were initially enrolled in the study. Of those, 334 completed the HRQoL assessment at least one of the two time points (3 and 6 months). Baseline char-acteristics of participants and dropouts are detailed in Appendix. Mean age of participants was 76 ± 7.3 years. Most fractures were caused by a fall from own or greater height (74.7 %). Main reason for dropouts was that they could not be reached within the allowed timeframe (19.4 %). No significant differences were found between participants and those lost to follow-up (3 and 6 months), except for schooling; older adults lost to follow-up had less schooling than par-ticipants. Loss to follow-up (fit: 48.9 %; vulnerable: 38.9 %; frail: 12.2 %) did not differ significantly be-tween the three groups (p= 0.42). On the SF-12, aver-age mental scores (3 months: 67.3 ± 19.0; 6 months: 69.3 ± 16.7) and physical scores (3 months: 66.1 ± 22.6; 6 months: 65.3 ± 20.8) remained quite stable be-tween time measures.
Participants’ characteristics according to their frailty status are shown in Table 1. The proportions of partic-ipants in the 3 groups were as follows: 56.6 % were very fit-well (level 1–2); 32.3 % were well with treated comorbidities or apparently vulnerable(level 3–4); and 11.1 % were mildly to moderately frail(level 5–6). Be-cause of the inclusion criteria, no participants were classified as severely frail (level 7) on the CSHA Clin-ical Frailty Scale. Participants in the frailest group were older, had more comorbidities, showed less fall efficacy and presented with more IADL disabilities than the other two groups. Also, more participants in that group reported occasionally using a walking aid. The vulnerable group had less schooling. The fittest group demonstrated less cognitive impairment, had higher IADL scores and went out more often than the other two groups.
Before adjusting for confounding variables, the PCS and MCS mean scores differed significantly (p= <0.01) between the 3 groups (frail, vulnerable, fit) at 3 and 6 months: frail participants showed lower unadjusted PCS and MCS mean scores at all time points than the other two groups (see Table 2). After adjusting for confounding variables, the frailest group showed lower
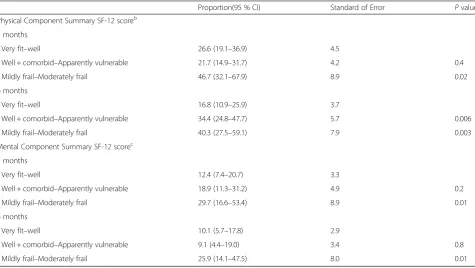
PCS scores (p= <0.01) than the fittest group at 3 months and 6 months, as well as on the MCS (p= 0.03) at 3 months. The frailest group also scored lower on the PCS (p= <0.01) than the vulnerable group at 3 months, while the vulnerable group scored lower (p= 0.01) than the fittest group on the MCS (See Table 3). Other analyses produced similar results: the frailest group showed higher proportions of HRQoL < 50/100 (indicat-ing negative self-rated health) than the fittest group on the PCS at 3 months (relative proportion [RP]: 1.76,p= 0.02) and 6 months (RP: 2.40, p< 0.01), as well as on the MCS at 3 months (RP: 2.40, p= 0.01) and 6 months (RP: 2.56,p= 0.01). The frailest group also show higher proportions of HRQoL < 50 than the vulnerable group on the PCS at 3 months (RP: 2.15, p= 0.01), as well as on the MCS at 6 months (RP: 2.85, p= 0.01) (see Table 4).
Within each group, no significant changes were re-ported in mean SF-12 scores over time (3 vs 6 months) for the frailest and fittest groups. More variations in SF-12 scores were found in the vulnerable group: MCS scores increased (p< 0.01) between 3 and 6 months (from 63.5 to 69.0), while PCS scores decreased (p= 0.04) over the same interval (from 62.4 to 57.5). Based on Al Sayah et al. [32], this change in HRQoL scores can be considered clinically significant (difference≥5 points).
Discussion
Table 1Participants’characteristics according to their frailty status
Very fit–well(N= 189) Well + comorbid–Apparently vulnerable(N= 108)
Mildly frail–Moderately frail(N= 37)
p-value*
Age
65-74 98 (51.9) 42 (38.9) 8 (21.6) 0.0006
75-85 77 (40.7) 50 (46.3) 19 (51.4)
85+ 14 (7.4) 16 (14.8) 10 (27.0)
Male 45 (23.3) 24 (22.4) 9 (24.3) 1.0
Schooling
Primary 14 (7.6) 17 (16.0) 4 (11.1) 0.0004
Secondary 55 (29.7) 47 (44.3) 11 (30.6)
College 40 (21.6) 23 (21.7) 3 (8.3)
University 76 (41.1) 19 (17.9) 18 (50.0)
Number of comorbidities
0–4 125 (66.1) 59 (54.6) 14 (38.9) 0.004
5–13 64 (33.9) 49 (45.4) 22 (61.1)
Living alone, without help 66 (35.1) 36 (33.3) 9 (24.3) 0.4
Social Support Index (SSI > 63/100) 159 (84.6) 83 (78.3) 24 (68.6) 0.06
ED visits in the last 3 months 21 (11.2) 17 (15.9) 4 (11.8) 0.5
Falls in the last 3 months 31 (16.4) 24 (22.2) 7 (20.0) 0.5
Numbers of outings/week < 5 150 (82.9) 69 (63.9) 18 (56.3) 0.0001
Occasional use of a walking aid 17 (9.1) 25 (23.2) 17 (47.2) <0.0001
Baseline BADL score (14/14) 137 (72.5) 98 (90.7) 29 (78.4) <0.0001
Baseline IADL score (<14) 137 (72.5) 51 (47.2) 15 (40.5) <0.0001
Injury mechanisma
- Fall from own height 134 (72.0) 80 (75.5) 31 (86.1) 0.5
- Fall from greater height 24 (12.9) 16 (15.1) 4 (11.1)
- Motor vehicle accident 5 (2.7) 3 (2.8) 0 (0.0)
- Others 23 (12.4) 7 (6.6) 1 (2.8)
Location of fracture (injured body region)a
Head 9 (4.8) 6 (5.6) 3 (8.1) 0.6
Spine 5 (2.7) 3 (2.8) 3 (8.1)
Upper limb 104 (55.0) 53 (49.1) 22 (59.5)
Thorax 27 (14.3) 17 (15.7) 5 (13.5)
Lower limb 37 (19.6) 25 (23.2) 4 (10.8)
Multiple 7 (3.7) 4 (3.7) 0 (0.0)
Description of injury
Fracture only 133 (70.4) 61 (56.5) 28 (75.7) 0.02
With co-occurring injuriesb 56 (29.6) 47 (43.5) 9 (24.3)
Tear 1 (0.5) 1 (0.9) 0
Abrasion 9 (4.8) 12 (11.1) 0
Luxation 1 (0.5) 0 0
Laceration 10 (5.3) 16 (14.8) 0
help identify older patients with poorer HRQoL so that appropriate home care and community services could be provided after ED discharge for optimal recovery.
One important finding of our study is that both the mental and physical components were worse in our
frail participants in the months following their ED visit for minor fractures. Past cross-sectional and prospect-ive studies [7, 8] in seniors revealed that the physical dimension of HRQoL was affected by minor fractures while the mental component remained stable after dis-charge. Identifying frail older adults may help to refer
Table 1Participants’characteristics according to their frailty status(Continued)
Sprain 5 (2.7) 4 (3.7) 2 (5.4)
Avulsion 1 (0.5) 1 (0.9) 1 (2.7)
Effusion 1 (0.5) 0 0
Traumatic brain injury 16 (8.5) 14 (13) 5 (13.5)
Injury Severity Score (ISS) (/75)
1–2 22 (11.6) 10 (9.3) 3 (6.9) 0.1
3–4 141 (74.6) 70 (64.8) 27 (62.7)
5 + 26 (13.8) 28 (25.9) 7 (18.9)
Pain (Visual Analog Scale≥7/10) 20 (10.7) 14 (13.0) 6 (16.2) 0.6
Short Falls Efficacy Scale-International (<9.8) 120 (63.5) 56 (51.9) 14 (38.9) 0.01
Cognitive status (MoCA < 23/30 or TICS-modified≤31/50)
36 (19.7) 37 (35.2) 10 (28.6) 0.01
*Chi-Squarea
Fisher testb
Not mutually exclusive categories
Table 2Unadjusted HRQoL mean scoresa, according to the frailty groups at 3 months and 6 months
Mean(95 % CI) Standard of Error Pvalue
Physical Component Summary SF-12 scoreb
3 monthsc
- Very fit–well 69.6 (66.2 72.7) 21.9
- Well + comorbid–Apparently vulnerable 65.6(61.4 69.9) 21.4
- Mildly frail–Moderately frail 51.9 (43.9 59.9) 24.1 <0.001
6 months
- Very fit–well 70.2 (67.3 73.1) 17.8
- Well + comorbid–Apparently vulnerable 61.6 (56.7 66.4) 22.1
- Mildly frail–Moderately frail 50.5 (41.7–59.3) 23.1 <0.001
Mental Component Summary SF-12 scored
3 months
- Very fit–well 70.6 (68.1 73.1) 16.5
- Well + comorbid–Apparently vulnerable 64.5 (60.5–68.5) 20.3
- Mildly frail–Moderately frail 59.2 (51.7 66.8) 22.7 <0.001
6 months
- Very fit–well 71.0 (68.773.2)
- Well + comorbid–Apparently vulnerable 69.7 (66.0–73.5)
- Mildly frail–Moderately frail 59.6 (50.4–68.8) 0.003
a
obtained by linear mixed model
b
Adjustments based on schooling, comorbidities, use of walking aid, baseline IADL score, and number of outings per week
c
Very fit—well (n= 173); Well + comorbid–Apparently vulnerable (n= 101); Mildly frail–Moderately frail (n= 37)
d
Table 3Adjusted HRQoL mean scoresa, according to the frailty groups at 3 months and 6 months
Mean(95 % CI) Standard of Error P value
Physical Component Summary SF-12 scoreb
3 monthsc
- Very fit–well 60.9 (57.0–64.8) 2.0
- Well + comorbid–Apparently vulnerable 62.4 (58.1–66.7) 2.2 0.6
- Mildly frail–Moderately frail 49.2 (42.1–56.5) 3.7 0.005
6 months
- Very fit–well 61.1 (57.6–64.8) 1.8
- Well + comorbid–Apparently vulnerable 57.5 (52.6–62.5) 2.5 0.2
- Mildly frail–Moderately frail 48.7 (41.2–56.2) 3.8 0.003
Mental Component Summary SF-12 scored
3 months
- Very fit–well 69.6 (65.8–73.4) 1.9
- Well + comorbid–Apparently vulnerable 63.5 (59.2–67.7) 2.2 0.014
- Mildly frail–Moderately frail 59.5 (50.9–68.1) 4.4 0.032
6 months
- Very fit–well 70.1 (66.5–73.7) 1.84
- Well + comorbid–Apparently vulnerable 69.0 (65.2–72.9) 1.94 0.6
- Mildly frail–Moderately frail 60.8 (51.1−70.6) 4.96 0.08
a
obtained by linear mixed model
b
Adjustments based on schooling, comorbidities, use of walking aid, baseline IADL score, and number of outings per week
c
Very fit—well (n= 173); Well + comorbid–Apparently vulnerable (n= 101); Mildly frail–Moderately frail (n= 37)
d
Adjustments based on age, schooling, comorbidities, use of walking aid, baseline IADL score, cognitive status, and number of outings per week
Table 4Adjusted proportionsa(score < 50), according to the frailty groups at 3 months and 6 months
Proportion(95 % CI) Standard of Error Pvalue
Physical Component Summary SF-12 scoreb
3 months
- Very fit–well 26.6 (19.1–36.9) 4.5
- Well + comorbid–Apparently vulnerable 21.7 (14.9–31.7) 4.2 0.4
- Mildly frail–Moderately frail 46.7 (32.1–67.9) 8.9 0.02
6 months
- Very fit–well 16.8 (10.9–25.9) 3.7
- Well + comorbid–Apparently vulnerable 34.4 (24.8–47.7) 5.7 0.006
- Mildly frail–Moderately frail 40.3 (27.5–59.1) 7.9 0.003
Mental Component Summary SF-12 scorec
3 months
- Very fit–well 12.4 (7.4–20.7) 3.3
- Well + comorbid–Apparently vulnerable 18.9 (11.3–31.2) 4.9 0.2
- Mildly frail–Moderately frail 29.7 (16.6–53.4) 8.9 0.01
6 months
- Very fit–well 10.1 (5.7–17.8) 2.9
- Well + comorbid–Apparently vulnerable 9.1 (4.4–19.0) 3.4 0.8
- Mildly frail–Moderately frail 25.9 (14.1–47.5) 8.0 0.01
a
obtained by sensitivity analyses were conducted using a general estimating equations approach
b
Adjustments based on age, schooling, comorbidities, use of walking aid, baseline IADL score, and number of outings per week
c
them to existing services tailored to their needs, which might improve not only their physical functioning but also their mental health.
Our study also showed that HRQoL measures did not vary between 3 and 6 months within levels of frailty, ex-cept for the vulnerable group. These results are consist-ent with the concepts of vulnerability and reversibility associated with early stages of frailty [34]. On the one hand, as PCS scores decreased for the vulnerable group between the two time points, it could be hypothesized that this group may not have the capacity to resist the potential adverse effects of minor fractures as effectively as their fitter counterparts. Since physical activity has been shown to have a positive impact on HRQoL in pre-frail older adults [35], targeting this specific sub-group will help to provide them with appropriate interventions to prevent further decline of their HRQoL physical com-ponent. On the other hand, as HRQoL mental scale scores increased for that group between the two time points, our results suggest that vulnerable older adults, compared to their frailest counterparts, can recruit enough social and emotional resources to improve their MCS despite their PCS decline. Our results thus point to the relevance of categorizing older adults according to different levels of frailty for the purpose of identifying those who may present lower mental and physical HRQoL following ED visits.
One important clinical implication of the present study is that it highlights the potential importance of screening for frailty in the ED, a place where this is rarely done [36]. Older people with minor fractures cur-rently do not receive differential ED care. An easy-to-administer frailty measure such as the CSHA-CFS [36] could help ED clinicians identify those who may need more clinical attention. To stratify the level of HRQoL post-discharge may help to implement healthcare ap-proaches tailored to the specific needs of the frailest pa-tients; these approaches have shown promising results in other clinical settings with respect to quality of life out-comes [15, 16].
Our findings should be interpreted in light of sev-eral limitations. First, HRQoL scores may have been underestimated due to attrition bias (approximately 20 %) at 3 and 6 months. However, further analysis revealed no difference in dropout rates between the 3 groups at 3 and 6 months. Second, HRQoL was not measured during the ED phase. The lack of SF-12 measures at baseline raises the question of whether a change might have been observed in HRQoL from ED discharge up to 3 months and could not provide information on how HRQoL improved or deterio-rated during this length of time. The first HRQoL measure may also have taken short after ED dis-charge (<6 weeks) to reduce delay, as one might
expect recovery during this length of time. Third, no frailty measures were taken at 3 months and 6 months, which do not allow to known if a change in group classification (fit, vulnerable, frail) would have occurred over time. Fourth, the impact of some potential confounding variables on HRQoL scores, such as depression and anxiety, was not verified. However, the comorbidities that we controlled for in our study included items related to depression and anxiety. Fifth, frailty assessments could have been performed by 2 raters to increase reliability and pre-vent misclassification. However, the tool used showed high interrater reliability in a previous study [37]. Finally, the data should be interpreted with caution due to the small number of participants in the frailest group.
Current findings build on existing work. Results were obtained via a multicenter study consecutively recruit-ing a large sample of participants. Generalization of findings to the population of older adults visiting EDs for minor fractures is thus increased through these methodological strengths. The ability of the frailty measure to help identify older adults showing poorer HRQoL post-discharge has received little attention to date in specific clinical settings. To our knowledge, there have been no other studies conducted with inde-pendent older adults admitted to EDs for minor frac-tures, although this type of injury is frequent in non-disabled seniors [8, 38].
Conclusion
This study demonstrates that older adults with minor fractures who are frail have poorer mental and phys-ical HRQoL in the months following ED discharge, suggesting that they require special attention in clin-ical care. Our results thus support the importance of including some easy-to-administer frailty screening tools in routine ED assessments. Measuring the frailty status of older adults who suffered a minor fracture might improve clinical decision-making at discharge, such as offering them preventive strategies tailored to their needs, so that HRQoL could be improved in the following months. Future studies could document which services (e.g., referral to day hospital/center to improve physical function and increase social con-tacts) should be provided following ED visits to im-prove HRQoL observed in frail participants who have suffered a fracture.
Ethics, consent and permissions
Appendix
Abbreviations
CSHA-CFS:Canadian Study of Health and Aging–Clinical Frailty Scale; ED: emergency department; HRQoL: Health-related quality of life; MCS: Mental Component Summary scale; PCS: Physical Component Summary scale; RP: relative proportion; SF-12: Short Form-12 Health Survey.
Competing interests
The authors declare that they have no competing interests.
Authors’contributions
Study concept and design: VP, MJS, MÉ, JJP, RD, JSL, LEG, LRD. Acquisition of subjects and data: NA-B, LW, LRD. Data analysis and interpretation: VP, MJS, MÉ, JJP, RD, JSL, LEG, BLBK, JL. All authors were involved in drafting the manuscript or revising it critically for important intellectual content. All authors read and approved the final manuscript.
Acknowledgments
The authors thank all CETI members for their invaluable assistance in completing this study, as well as the research assistants who collected the data and helped to edit the manuscript.
Funding sources
This research is part of the Canadian Emergency Team Initiative (CETI) funded by the Canadian Institutes of Health Research through their Emerging Team Grant Program on Mobility in Aging (CIHR-108750), and by Université Laval in Québec City. Information about CETI can be found at www.cha.quebec.qc.ca/ceti/. Author details
1Université de Sherbrooke, and Centre de recherche sur le vieillissement, Sherbrooke, QC, Canada.2Université Laval, and Centre de Recherche du CHU de Québec, Quebec, QC, Canada.3University of Ottawa, and Ottawa Hospital Research Institute, Ottawa, ON, Canada.4Université de Montréal, and Research Center, Hôpital du Sacré-Cœur de Montréal , Montréal, QC, Canada. 5University of Toronto, and Sunnybrook Health Science Center, Toronto, ON, Canada.6McMaster University, Hamilton, ON, Canada.
Received: 17 July 2015 Accepted: 29 February 2016 Table 5Baseline characteristics of independent senior
participants and dropouts at 3 and 6 months
Participants Dropouts p-value*
N= 334 (%) N= 94 (%)
Age (years)
65–74 148 (44.3) 35 (37.2) 0.2
75–85 146 (43.7) 41 (43.6)
85 + 40 (12.0) 18 (19.2)
Gender
Women 256 (76.9) 69 (73.4) 0.6
Men 77 (23.2) 24 (25.5)
Schooling
Primary 35 (10.7) 12 (12.9) 0.0008
Secondary 113 (34.6) 51 (54.8)
College 66 (20.2) 15 (16.1)
University 113 (34.6) 15 (16.1)
Number of comorbidities
0–4 198 (59.5) 59 (63.4) 0.5
5–13 135 (40.5) 34 (36.6)
Living alone, without help 111 (33.3) 32 (34.4) 0.8
Living alone, with some help 124 (37.2) 38 (40.9) 0.5
Social Support Index (SSI > 63/100) 266 (80.8) 69 (77.5) 0.5
ED visits in the last 3 months 42 (12.8) 13 (14.0) 0.8
Falls in the last 3 months 62 (18.7) 13 (14.0) 0.3
Numbers of outings/week < 5 237 (73.8) 67 (72.0) 0.7
Occasional use of a walking aid (baseline)
59 (17.8) 19 (20.4) 0.6
Baseline BADL score (14/14) 312 (93.4) 87 (92.6) 0.8
Baseline IADL score (<14) 131 (39.2) 44 (46.8) 0.2
Injury mechanisma
- Fall from own height 245 (74.7) 68 (72.3) 0.3
- Fall from greater height 44 (13.4) 13 (13.8)
- Motor vehicle accident 8 (2.4) 0 (0.0)
- Other 31 (9.5) 13 (13.8)
Location of fracture (injured body region)a
Head 18 (5.4) 7 (7.5) 0.2
Spine 11 (3.3) 4 (4.3)
Upper limb 179 (53.6) 56 (59.6)
Thorax 49 (14.7) 8 (8.5)
Lower limb 66 (19.8) 19 (20.2)
Multiple 11 (3.3) 0 (0.0)
Description of injury
- Fracture only 222 (66.5) 54 (57.4) 0.1
- Co-occurring injuries 112 (33.5) 40 (42.6)
Table 5Baseline characteristics of independent senior participants and dropouts at 3 and 6 months(Continued)
Injury Severity Score (ISS) (/75)
1–2 35 (10.5) 11 (11.7) 0.7
3–4 238 (71.3) 63 (67.1)
5 + 61 (18.3) 20 (21.3)
Pain (Visual Analog Scale≥7/10) 40 (12.1) 11 (12.0) 1.0
Short Falls Efficacy Scale-International (short FES-I) (<9.8)
143 (42.9) 48 (51.6) 0.3
Cognitive status (MoCA < 23/30 or TICS-modified≤31/50)
88 (26.4) 23 (30.3) 0.5
CHSA-Frailty Scale
Very Fit 72 (21.6) 21 (23.3) 0.4
Well 117 (35.0) 23 (25.6)
Well + treated comorbidities 73 (21.9) 28 (31.1)
Apparently vulnerable 35 (10.5) 7 (7.8)
Mildly frail 28 (8.4) 8 (8.9)
Moderately frail 9 (2.6) 3 (3.3)
*Chi-Squarea
References
1. Albert M, McCaig LF, Ashman JJ. Emergency department visits by persons aged 65 and over: United States, 2009–2010. Hyattsville: National Center for Health Statistics; 2013.
2. Pines JM, Mullins PM, Cooper JK, Feng LB, Roth KE. National trends in emergency department use, care patterns, and quality of care of older adults in the United States. J Am Geriatr Soc. 2013;61(1):12–7.
3. Owens PL, Russo CA, Spector W, Mutter R. Emergency department visits for injurious falls among the elderly, 2006. Healthcare Cost and Utilization Project (HCUP) Statistical Briefs [Internet]. Rockville: Agency for Healthcare Research and Quality; 2009. http://www.ncbi.nlm.nih.gov/books/NBK53603/. Accessed 26 June 2015
4. Wilber ST, Blanda M, Gerson LW, Allen KR. Short-term functional decline and service use in older emergency department patients with blunt injuries. Acad Emerg Med. 2010;17(7):679–86.
5. Peterman A, Rothrock N, Cella D. Evaluation of health-related quality of life (HRQL) in patients with a serious life-threatening illness. 2015. http://www. uptodate.com/contents/evaluation-of-health-related-quality-of-life-hrql-in-patients-with-a-serious-life-threatening-illness. Accessed 26 June 2015. 6. Lehmann P, Simmons CA. Tools for strengths-based assessment and
evaluation. Springer Publishing Company; 2013. 534 pages. https://books. google.ca/books/about/Tools_for_Strengths_Based_Assessment_and. html?id=Axd8rLFuUyIC&redir_esc=y). Accessed 26 June 2015 7. Sanfélix-Genovés J, Hurtado I, Sanfélix-Gimeno G, Reig-Molla B, Peiró S.
Impact of osteoporosis and vertebral fractures on quality-of-life. a population-based study in Valencia, Spain (The FRAVO Study). Health Qual Life Outcomes. 2011;9:20. doi:10.1186/1477-7525-9-20.
8. González N, Aguirre U, Orive M, Zabala J, García-Gutiérrez S, Las Hayas C, et al. Health-related quality of life and functionality in elderly men and women before and after a fall-related wrist fracture. Int J Clin Pract. 2014; 68(7):919–28. doi:10.1111/ijcp.12410. Epub 2014 Mar 25.
9. Tom SE, Adachi JD, Anderson Jr FA, Boonen S, Chapurlat RD, Compston JE, et al. GLOW Investigators. Frailty and fracture, disability, and falls: a multiple country study from the global longitudinal study of osteoporosis in women. J Am Geriatr Soc. 2013;61(3):327–34. doi:10.1111/jgs.12146. Epub 2013 Jan 25. 10. Chang YW, Chen WL, Lin FG, Fang WH, Yen MY, Hsieh CC, et al. Frailty and its impact on health-related quality of life: a cross-sectional study on elder community-dwelling preventive health service users. PLoS One. 2012;7(5):e38079. doi:10.1371/journal.pone.0038079.
11. Lin CC, Li CI, Chang CK, Liu CS, Lin CH, Meng NH, et al. Reduced health-related quality of life in elders with frailty: a cross-sectional study of community-dwelling elders in Taiwan. PLoS One. 2011;6(7):e21841. doi:10.1371/journal. pone.0021841.
12. Masel MC, Ostir GV, Ottenbacher KJ. Frailty, mortality, and health-related quality of life in older Mexican Americans. J Am Geriatr Soc. 2010;58(11):2149–53. doi:10.1111/j.1532-5415.2010.03146.x.
13. Bilotta C, Bowling A, Case A, Nicolini P, Mauri S, Castelli M, et al. Dimensions and correlates of quality of life according to frailty status: a cross-sectional study on community-dwelling older adults referred to an outpatient geriatric service in Italy. Health Qual Life Outcomes. 2010;8:56. doi:10.1186/ 1477-7525-8-56.
14. Bagshaw SM, Stelfox HT, Johnson JA, McDermid RC, Rolfson DB, Tsuyuki RT, et al. Long-term association between frailty and health-related quality of life among survivors of critical illness: a prospective multicenter cohort study. Crit Care Med. 2015;43(5):973–82. doi:10.1097/CCM.0000000000000860. 15. Hernández C, Alonso A, Garcia-Aymerich J, Serra I, Marti D, Rodriguez-Roisin R,
et al. Effectiveness of community-based integrated care in frail COPD patients: a randomised controlled trial. NPJ Prim Care Respir Med. 2015;25:15022. doi:10.1038/npjpcrm.2015.22.
16. Leung DY et al. The effect of a virtual ward program on emergency services utilization and quality of life in frail elderly patients after discharge: a pilot study. Clin Interv Aging. 2015;10:413–20. doi:10.2147/CIA.S68937. 17. Fillenbaum GG. Multidimensional functional assessment of older adults: The
Duke Older American Resources and Services Procedures. Hillsdale: Lawrence Erlbaum Associates; 1988.
18. Rockwood K, Song X, MacKnight C, Bergman H, Hogan DB, McDowell I, et al. A global clinical measure of fitness and frailty in elderly people. CMAJ. 2005;173(5):489–95.
19. Ware Jr J, Kosinski M, Keller SD. A 12-Item Short-Form Health Survey: construction of scales and preliminary tests of reliability and validity. Med Care. 1996;34(3):220–33.
20. Resnick B, Nahm ES. Reliability and validity testing of the revised 12-item Short-Form Health Survey in older adults. J Nurs Meas. 2001;9(2):151–61. 21. Abbreviated Injury Scale (AIS) 2005. Illinois: Association for the Advancement of
Automotive Medicine Publications; 2008.
22. Copes WS, Champion HR, Sacco WJ, et al. The injury severity score revisited. J Trauma. 1988;28(1):69–77.
23. Daoust R, Beaulieu P, Manzini C, et al. Estimation of pain intensity in emergency medicine: a validation study. Pain. 2008;138:565–70. 24. Fillenbaum G. Multidimensional functional assessment: The OARS
Methodology - A manual. Durham: Center for the study of ageing and human development, Duke University; 1978.
25. Haywood KL, Garratt AM, Fitzpatrick R. Older people specific health status and quality of life: a structured review of self-assessed instruments. J Eval Clin Pract. 2005;11(4):315–27.
26. Kempen GI, Yardley L, van Haastregt JC, Zijlstra GA, Beyer N, Hauer K, et al. The Short FES-I: a shortened version of the falls efficacy scale-international to assess fear of falling. Age Ageing. 2008;37:45–50. doi:10.1093/ageing/afm157. 27. Nasreddine ZS, Phillips NA, Bedirian V, Charbonneau S, Whitehead V, Collin I,
et al. The Montreal Cognitive Assessment, MoCA: A brief screening tool for mild cognitive impairment. J Am Geriatr Soc. 2005;53:695–9.
28. de Jager CA, Budge MM, Clarke R. Utility of TICS-M for the assessment of cognitive function in older adults. Int J Geriatr Psychiatry. 2003;18(4):318–24. 29. Vercambre MN, Cuvelier H, Gayon YA, et al. Validation study of a French
version of the modified telephone interview for cognitive status (F-TICS-m) in elderly women. Int J Geriatr Psychiatry. 2010;25(11):1142–9.
30. Audet N, Lemieux M, Cardin J. Enquête sociale et de santé 1998-Cahier technique et méthodologique: Définitions et composition des indices. Québec: Montréal; 2001.
31. Adachi JD, Adami S, Gehlbach S, Anderson Jr FA, Boonen S, Chapurlat RD, et al. Impact of prevalent fractures on quality of life: baseline results from the global longitudinal study of osteoporosis in women. Mayo Clin Proc. 2010;85(9):806–13. doi:10.4065/mcp.2010.0082. Epub 2010 Jul 15. 32. Sirois MJ, Emond M, Ouellet MC, et al. Cumulative incidence of functional
decline after minor injuries in previously independent older Canadian individuals in the emergency department. J Am Geriatr Soc. 2013;61(10):1661–8. 33. Al Sayah F, Majumdar SR, Johnson JA. Association of Inadequate Health
Literacy with Health Outcomes in Patients with Type 2 Diabetes and Depression: Secondary Analysis of a Controlled Trial. Can J Diabetes. 2015. doi: 10.1016/j.jcjd.2014.11.005. [Epub ahead of print].
34. Lang PO, Michel JP, Zekry D. Frailty syndrome: a transitional state in a dynamic process. Gerontology. 2009;55:539–49. doi:10.1159/000211949. 35. Kwon J, Yoshida Y, Yoshida H, Kim H, Suzuki T, Lee Y. Effects of a combined
physical training and nutrition intervention on physical performance and health-related quality of life in prefrail older women living in the community: a randomized controlled trial. J Am Med Dir Assoc. 2015;16(3):263.e1-8. doi:10.1016/j.jamda.2014.12.005. Epub 2015 Feb 3.
36. Goldstein JP, Andrew MK, Travers A. Frailty in older adults using pre-hospital care and the emergency department: a narrative review. Can Geriatr J. 2012;15(1):16–22.
37. Grossman D, Rootenberg M, Perri G-A. Enhancing communication in end‐ of‐life care: a clinical tool translating between the Clinical Frailty Scale and the Palliative Performance Scale. J Am Geriatr Soc. 2014;62(8):1562–7. 38. Edwards BJ, Song J, Dunlop DD, Fink HA, Cauley JA. Functional decline after