4005
Quality Work Life Of Employees In Mines Industry
Nishad Nawaz, Anjali Mary Gomes
ABSTRACT: The paper assesses the effectiveness of a quality work-life of the employee the mines Industry in Andhra Pradesh. The study established aim, objective and hypothesis are designed & tested to know the effectiveness of quality of work-life in Mines Industry. The results acquired by using of percentage method, Beta, t test. For the data collection, a well-structured questionnaire developed, collected 100 samples for the study. The study found that the relationship between age and employee workload, age and overall satisfaction of the employees towards the quality of work-life positively influence the organizational performance. Furthermore, quality of work-life will play a vital role in the relationship management of employees. Some insights discussed; this will be useful for managers & practitioners.
Keywords: Quality of work life, employee age, employee satisfaction, Mines Industry. Classification: Research paper. ————————————————————
1. INTRODUCTION
In the speed of technology era, an individual spends most of their lives in the workplace ([1]. Therefore the working environment and work condition plays a vital role in employee’s satisfaction as well as productivity generation. It is historical evidence that work has occupied an important place in human beings life. The quality of work-life (QWL) has started in 1990’s to bring changes in industrial policies to deal with the workforce. During the twentieth century, the formation of a concept like scientific management, socio-technical system theory has brought various new changes in employees handling. QWL is associated with adequate wage, hours and working condition, safe working environment, the opportunity for career advancement, [2]. QWL has emphasised and contributed more on healthy industrial relation, which has reduced industrial conflict. This concept also rapidly brought changes in the Indian service sector which is contributing high towards counties The concept of QWL appeared in India during mid-seventies when the county was passing through instance labour unrest. However, the concept failed to take root even though concerned authorities supported the promoters. In India however, GDP in comparison to another industry. The present study has emphasised how employees perceive the high quality of work-life experience in the service sector. Improvement of QWL may cause numerous gains in organisational development. It may lead to higher work esteem and job involvement of the individual in an organisation. Effective QWL also results in building up of productive employees by enhancing their moral and well-being. QWL has a broad coverage which addresses a wide variety of programmes, techniques and management tactics through which organisation can design its operational activities. This process may grant more autonomy, responsibility and authority than is usually done. QWL remarkably contributed to enhancing employee’s satisfaction, commitment and productivity [3]. Quality of work-life (QWL) facilitate all inputs of the organization, by keeping aim of employee satisfaction and development of organizational effectiveness.
The aim of the organizations is to develop good working conditions for all the jobs in the organization, this will leads to the economic development in order to achieve satisfaction, motivation, involvement in all level of the work. Quality of the work life to give excellence work conditions that will give employee satisfaction and will increase the individual performance. The first time the QWL term introduced in 1960. From that onwards term repeatedly gaining importance and contributing much better conditions in the employee’s life. Any time of organization only with technology can not survived, human resource are important. The quality of life is the process of more facilities to employees, means that good working condition, work life and adequate payment system Therefore, the study aimed to know the employee satisfaction towards the quality of work-life in the Mines Industry, especially, Andhra Pradesh, India.
2. LITERATURE REVIEW
Many researchers opined an enormous number of predictors for QWL. However, certain studies have been empirically examined from Asian context [4]; [5]. The most of the literature in QWL originated from developed western societies [6], [7], [8], [9], [10]. Quality of work life identify major conceptual items that are working condition, safety, adequate compensation, fair wage and salary structure develop human competencies, professional development and security, social integration to understand the QWL. [11]. All most all organizations work life is becoming an important issue to achieve the goals of the organization in every sector, whether it is education, service sector, banking sector, tourism, manufacturing. The study relived that if the organization provides a good quality of work life, that develops health working atmosphere and employee satisfaction. The best QWL enhances effectiveness of the organization that will impact om whole organization to wards innovations, continues contribution to the employees that will provide productivity. In present days quality of the work life also affect all the organizations. QWL act as bridge between the employee satisfaction at work place and family life. The study relived that if the organization provides a good QWL, that develops health working atmosphere and employee satisfaction. The best quality of work life enhances effectiveness of the organization that will impact om whole organization to wards innovations, continues contribution to the employees that will provide productivity. In present days quality of the work life also affect all the organizations. QWL act as bridge between the employee satisfaction at workplace and family life as well. Therefore. quality of work life gain always importance. [12]. The India is the huge Industry revolution in all the states not only in technology and other
_________________________________
Nishad Nawaz PhD, Assistant Professor, Department of Business Management, College of Business Administration, Kingdom University, Bahrain. http://www.researcherid.com/rid/M-7696-2016 http://orcid.org/0000-0003-4781-7993
4006 areas of products because the policies and administrative
make them to well diversified in the International network. By keeping this background the literature is very less in the respect of Andhra Pradesh mines Industry, therefore the present study has been conducted to reduce the gap. The study develop following objective to know quality of work-life in Mines industry in selected organization in Andhra Pradesh, India. The study searched literature review to develop constructs for QWL, to get appropriate literature, the study has been used various methods to collect relevant data, used Web of science, Scopus, Elsevier, Emerald and Science direct to get meaningful information in selected area of the topic. Moreover, other sources also used such as industry reports and various sites, which are related and relevant to topic chosen, for this purpose used very effective method (i) used essential keywords and searched various databases like ProQuest, Scopus, EBSCO, , Emerald, Elsevier, Springer, Taylor and Francis and Wiley Inderscience to reach proper information, quality of work-life, employee satisfaction, Mines Industry keywords were used, (ii) taken help google, google scholar, research gate, academia, bing, yahoo, baidu, yandex.ru, duckDuckGo, ask.com, aol.com, microsoft academic, base, core, science.gov & semantic scholar and finally accessed periodic and review of leading journals, which are frequently published articles in quality of work-life, human resource management and also used various sites by having aim not to miss any update related to the topic.
Table 1 : Constructs and items identified from the literature.
Constructs References
employee salary, workload distribution, employee allowances, safety equipment’s
performance appraisal system,
work responsibility, Incentives for higher education, employee professional growth, discrimination policy, work life influence on family daily activities.
[12], [13], [14]
2. 1 RESEARCH METHODS
Hypotheses development
Organizational working conditions, quality of work life supports and develop employee satisfaction by facilitating rewards, career growth, job satisfaction and professional development. The employees who are happy with incentive, the same employee felt satisfaction with job security. [15]. The quality of work-life and employee satisfaction directly depend on each other. A meaningful relationship like leadership, the rule of law, social cohesion, human development capabilities, the delegation of authority etc is influencing QWL[16]. The various researcher argued different components of QWL. [3] opined six factors that distinguish more and less successful QWL efforts are delineated. The study concluded that three major components of QWL, such as project development at diffirent level, changes in structure and management systems and changes in top or middle management behaviour has in significant impact on QWL. The financial and marketing performance affected by the level of QWL exists in the organisation. The company’s high quality of work-life can create a win-win situation and at the result, can enjoy exceptional growth and profitability [17]. The transformational and transactional leadership are significant predictors of
quality go work life. The transformational leadership and QWL, gender is statistically significant on the other hand, transactional leadership and QWL, it found to be no significant [18]. Among several factors of QWL, the flexibility in time and work atmosphere has a significant impact on QWL. These factors stand as a strong predictor to enhance QWL, particularly marries female and male counterpart [19]. Above sections discussed details about stayed literature, after finding the gap, the following hypotheses were developed to test and to encounter the research objective. Therefore, the present study was taken study in Mines Industry of Andhra Pradesh. The first hypotheses, (H1) There is an association in between age and workload satisfaction and second, (H2) There is an association in between age and overall quality of work-life satisfaction.
2.2. Data collection and sample
To know the values the study used such as percentage, Beta (β), ―t‖ test and adopted convince sampling to get required data for the study. The study conducted via web-based and circulated well-designed questionnaire, all the items were found from the literature review in Table 1. The questions with the measurement scale of liker scale [20] were used with a range of very satisfied (5) to very dissatisfied (1), and some of the constructs used as closed-ended for the study. The study questions developed, selected 6 experts in the field, 3 members from academic & 3 from industry to check the questions are correct or not as per the aim and objective and also to know relevance of questions to the present context, moreover to check the grammar, question clarity, after receiving feedback from the experts, the questions has been modified as per the suggestions of the experts and varied the carefully soon after the final questionnaire was distributed via using questionpro application (survey-based data collection tool). The questionnaire circulated in between July 2019 to September 2019, those who are working in the mines. The request and questionnaire link sent via social media such as whatsapp, facebook & twitter and email ids also used for this purpose. After all, they received 160 questionnaires, in some of them are half-filled, some of them not adequately inserted their inputs. Therefore, the researchers used excel sheet to know, which questionnaire was appropriately filed, after careful investigation, 100 questionnaires filled, and these 100 questionnaires are used for the analysis to identify the results. Table 2 and Table 3 demonstrate the respondent’s demographic profiles of the study.
3. ANALYSIS AND FINDINGS
To know the QWL of the employees, the study incorporated the percentage method and Beta & t test values and the results as follows.
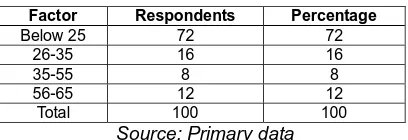
Table 2 Respondents defendant age distribution
Factor Respondents Percentage
Below 25 72 72
26-35 16 16
35-55 8 8
56-65 12 12
Total 100 100
4007 Table 2 shows the age distribution among the selected
respondents. As per the opined a large number of the respondents below 25 years, 16 percentage in between the 26 and 35 years, 56-65 age 12 percentage and remaining are in between of 35- 55 are involved in the present study.
Table 3 Respondents experience distribution
Factor Respondents Percentage
1-10 70 70
11-20 18 18
21-30 9 9
Above 31 11 11
Total 100 100
Source: Primary data
In the matter of experience distribution 70 out of 100 respondents having ten years of experience, 11-20 experience 18 respondents, 21-30 are 9 and above 31 years of experience 11 are participated in the study, the values are in Table 3.
Table 4 Respondents gender distribution
Factor Respondents Percentage
Male 63 63
Female 37 37
Total 100 100
Source: Primary data
Table 4 shows the distribution of gender, 63 male, 37 female are participated in the study.
Table 5 Respondents Education details
Factor Respondents Percentage
10th or below 00 00
Graduate 24 24
Post Graduate 50 50
Professional Degree 20 20
Doctoral Degree 6 6
Total 100 100
Source: Primary data
Table 5 explained on education details of the respondents, the details as follows, graduate 24 percentage, 50 out 100 are postgraduate, 20 are having a professional degree, 6 employees holding a doctoral degree in the selected sample.
Table 6 Respondents designation details.
Designation Respondents Percentage
DGM 1 1
AGM 4 4
Sr.Manager 6 6
Manager 12 12
DM 14 14
AM 28 28
JM 30 30
Executive 4 4
Total 100 100
Source: Primary data
Table 6 describes designation-wise details of the respondents, 30 respondents are junior managers (JM) 28 are from assistant managers (AM), 14 are deputy managers (DM), 12 are managers, 6 from senior managers, assistant general managers (AGM) are 4, executives 4 and one from deputy general manager (DGM) are participated in the study.
Table 7 Respondents details in department-wise
Department Respondents Percentage
Personnel 32 32
Mechanical 2 2
Chemical 2 2
Materials 16 16
Finance 10 10
Civil 6 6
Industrial Engineering 4 4
Geology 4 4
C&IT 6 6
Environment 4 4
Mining 14 14
Total 100 100
Source: Primary data
Table 7 displays details about the departments, from personnel department 32, material department 16, mining department 14, civil department 6, computer & information technology (C&IT) department 6, industrial engineering, geology, environment departments each 4. mechanical, chemical department each two are involved in the study.
Table 8 Respondents on work schedule
Department Respondents Percentage
General shift 80 80
3 shift with rotation 14 14
Permanent first shift 12 12
Total 100 100
Source: Primary data
Table 8 shows the details of the work schedule of the respondents, 80 employees are working in general shift, 14 are 3 shift with rotation and remaining are in permanents first shift are involved in the study.
Construct reliability
To identify the reliability, conducted reliability test on constructs by using Cronbach’s alpha the values range in between 0 to 1, it shows that the construct reliability is acceptable [21]. As per the [22] the threshold acceptation range is 0.70. If the values more than 0.70 that indicates, there is a significant relation in between the constructs. Additionally, the study constructs value is 0.87; the total number of items are (13).
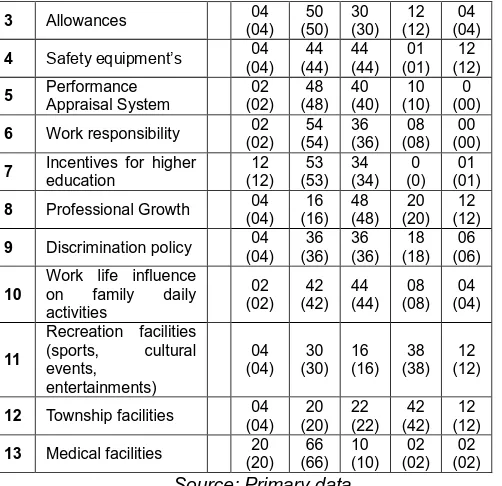
Table 9 Respondents opinion on various factors of quality of work life in Mines Industry.
SL Variables Opinion
VS S N D VD
Respondents
1 Salary 12
(12) 53 (53)
34 (34)
0 (0)
01 (01)
2 Workload distribution 08 (16)
34 (34)
42 (42)
12 (12)
4008
3 Allowances 04
(04) 50 (50) 30 (30) 12 (12) 04 (04)
4 Safety equipment’s 04 (04) 44 (44) 44 (44) 01 (01) 12 (12)
5 Performance Appraisal System 02 (02) 48 (48) 40 (40) 10 (10) 0 (00)
6 Work responsibility 02 (02) 54 (54) 36 (36) 08 (08) 00 (00)
7 Incentives for higher education (12) 12 (53) 53 34 (34) (0) 0 (01) 01
8 Professional Growth 04 (04) 16 (16) 48 (48) 20 (20) 12 (12)
9 Discrimination policy 04 (04) 36 (36) 36 (36) 18 (18) 06 (06) 10
Work life influence on family daily activities 02 (02) 42 (42) 44 (44) 08 (08) 04 (04) 11
Recreation facilities (sports, cultural events, entertainments) 04 (04) 30 (30) 16 (16) 38 (38) 12 (12)
12 Township facilities 04 (04) 20 (20) 22 (22) 42 (42) 12 (12)
13 Medical facilities 20 (20) 66 (66) 10 (10) 02 (02) 02 (02) Source: Primary data
Note: The percentage values are presented in the parenthesis.
Note: SL: Serial Number, R: Respondents, VS: Very satisfied S : Satisfied N : Neutral D : dissatisfied VD : Very dissatisfied.
Table 9 shows various factors regarding the quality of work-life in the Mines Industry, the element of salary respondents opined that 53 per cent are satisfied, 34 respondents said neutral, 12 are very satisfied. In the employee workload most of the employees selected neutral, 34 mentioned satisfaction, 12 dissatisfaction, 8 very satisfied and rest very dissatisfied. Employee allowance 5 percent of respondents opined satisfied, 30 neutral, 12 disagreed, 04 very satisfied and rest of them are in very unhappy. In the safety equipment’s there is equal distribution in the matter of satisfaction and neutral, 12 respondents felt very dissatisfied and 4 are very satisfied. Performance appraisal system 48 are satisfied, 40 neutral 10 dissatisfied about the system. The employee work responsibility 54 respondents are satisfied, 36 neutral, 8 dissatisfied,02 are highly satisfied, The employees are encouraging higher education with incentives for this employees stated that 53 satisfied, 34 neutral, 12 very satisfied and 1 very dissatisfied, in the concern of professional development the employees are presented following opinion, 48 as a neutral, 20 dissatisfied, 16 satisfied, 4 very satisfied and 12 are very dissatisfied, the policy of discrimination 36 respondents are opined satisfied and neutral,18 are dissatisfied,06 very dissatisfied and rest of them in very satisfied part, employees work life influence family daily life activities, most of the respondents revealed as neutral, 42 satisfied, 8 dissatisfied, 4 very dissatisfied and two are in very satisfied, employee recreation such as sports, cultural, events, entertainments, respondents opined that 30 are satisfied, 38 disappointed, 16 neutral, 12 very dissatisfied and 04 are very satisfied, regards to township facilities respondents stated that 42 are dissatisfied, 12 are very dissatisfied, 22 neutral, 20 satisfied, 04 very satisfied and the last factor of medical facilities 66 respondents are satisfied, 20 very satisfied, 10 neutral, 2 dissatisfied, 2 very dissatisfied.
Table 10: Hypotheses test results.
Hypothesized
relationship β S.E t p HR
H1 SLW Age 0.073 0.102 6.24 0.002** A
H2 OSAQW Age 0.059 0.089 7.35 0.030* A
Source: Primary data
Significant at p<0.05, β - standardized coefficients; S.E: standard error.
Note: **denotes significant at 1% level, *denotes significant at 5% level.
Note 2 : HR : Hypothesis Result, A: Accepted
Note 3: SLW: Satisfaction level on workload, OSAQW : Overall Satisfaction about QWL.
The study tests the developed hypothesis; the results came bout positive, the values in Table 10. To know the relation in between satisfaction level on workload with age. And also, overall satisfaction about the quality of work life. The developed hypotheses are significant at the 0.05 level and accepted as well..
4. DISCUSSION
4009 discrimination satisfaction and neural both are in the same
rank. The employees said that their work would influence the work. Employees dissatisfied with employee recreation facilities such as sports, cultural events, etc. And other hands the employees stated that they are happy with the facilities of recreation, the township facilities most of them are not satisfied and yes, medical facilities the employees have shown satisfaction.The study developed the hypotheses to know the relationship between age and satisfaction level of workload, the values are shown significant results, it means that as the age the employees who are working in the mines are happy and satisfied, which are they are getting facilities. Another hypotheses age and overall satisfaction about the quality of work-life also shown positive results. This indicates that in overall employees are satisfied as they age. Therefore, here age playing an important role, employee satisfaction is dependents upon the age, so organizations have to concentrate age factor demands it indicates more productivity and performance.
4.1 Limitations and future research directions.
The study has a limitation, the research conducted in Andhra Pradesh in the selected organization of mines. The survey can be conducted in various part of India by having more sample size. The comparative study can be possible between the mines companies, states. There is another opportunity to have a comparison between the factors of quality of work of mines.
REFERENCES
[1] E. E. Lawler, ―Strategies for improving the quality of work life,‖ Am. Psychol., vol. 37, no. 5, pp. 486–493, 1982.
[2] P. H. Mirvis and E. E. Lawler, ―Accounting for the quality of work life,‖ J. Organ. Behav., vol. 5, no. 3, pp. 197–212, 1984.
[3] D. A. Nadler and E. E. Lawler, ―Quality of work life: perspectives and directions,‖ Organ. Dyn., vol. 11, no. 3, pp. 20–30, 1983.
[4] M. Uysal, M. J. Sirgy, E. Woo, and H. L. Kim, ―Quality of life (QOL) and well-being research in tourism,‖ Tour. Manag., vol. 53, pp. 244–261, 2016.
[5] L. E. D. Mark F.Levine, James C.Taylor, ―Defining Quality of Work Life,‖ Hum. Relations, vol. 37, no. 1, pp. 81–104, 1984.
[6] S. J. HAVLOVIC, ―Quality of Work Life and Human Resource Outcomes,‖ Ind. Relations A J. Econ. Soc., vol. 30, no. 3, pp. 469–479, 1991.
[7] F. van de L. and J. Benders, ―Not Just Money : Quality of Working Life as,‖ Health Manpow. Manage., vol. 21, no. 3, pp. 27–33, 1990.
[8] J. Griffith, ―Do satisfied employees satisfy customers? Support-services staff morale and satisfaction among public school administrators, students, and parents,‖ J. Appl. Soc. Psychol., vol. 31, no. 8, pp. 1627–1658, 2001.
[9] P. Janes and M. Wisnom, ―Changes in Tourism Industry Quality of Work Life Practices,‖ J. Tour. Insights, vol. 1, no. 1, pp. 107–113, 2011.
[10] S. Kanten and O. Sadullah, ―An Empirical Research on Relationship Quality of Work Life and Work Engagement,‖ Procedia - Soc. Behav. Sci., vol. 62, no. October 2012, pp. 360–366, 2012.
[11] R. Walton, ―Quality of work life activities: A research
agenda,‖ Prof. Psychol. Res. Pract., vol. 11, no. 3, pp. 484–493, 1980.
[12] R. Yadav and A. Khanna, ―Literature Review on Quality of Work Life and Their Dimensions,‖ IOSR J. Humanit. Soc. Sci., vol. 19, no. 9, pp. 71–80, 2014.
[13] T. A. El Badawy, E. Shiha, and M. M. Magdy, ―The Quality of Work Life in Egypt,‖ World J. Bus. Manag., vol. 2, no. 2, p. 34, 2016.
[14] H. Rahman and R. Kodikal, ―Quality of work life: An Empirical review,‖ Res. J. Commer. Behav. Sci., vol. 7, no. May, pp. 1–52, 2018.
[15] H. Pruijt, ―Performance and quality of working life,‖ J. Organ. Chang. Manag., vol. 13, no. 4, pp. 389–400, 2000.
[16] I. M. Yadollah Hamidi, Abdolaziz Mohammadi, Ali Reza Soltanian, ―هاگشناد نانكراك يراك يگدنز تيفيك اب نآ ‖,فرهن گ سازمان ي و راب طهJounal Ergon., vol. 3, no. 4, pp. 1–9, 2016.
[17] R. S. M. L. B. E.May, ―A Win-Win Paradigm for Quality of,‖ Hum. Resour. Dev. Q., vol. 9, no. 3, pp. 211–226, 1998.
[18] D. Kara, H. (Lina) Kim, G. Lee, and M. Uysal, ―The moderating effects of gender and income between leadership and quality of work life (QWL),‖ Int. J. Contemp. Hosp. Manag., vol. 30, no. 3, pp. 1419– 1435, 2018.
[19] R. Rastogi, P. Garg, S. Agarwal, and A. Jindal, ―The influence of quality of work life on trust: empirical insights from a SEM application,‖ Int. J. Indian Cult. Bus. Manag., vol. 15, no. 4, p. 506, 2017.
[20] A. Van alphen, R. Halfens, A. Hasman, and T. Imbos, ―Likert or Rasch? Nothing is more applicable than good theory,‖ J. Adv. Nurs., vol. 20, no. 1, pp. 196–201, 1994.
[21] Cronback LJ, ―Coefficient alpha and the internal structure of tests,‖ Psychometrika, vol. 16, no. 3, pp. 297–334, 1951.